Carbon nanotubes for lithium ion batteries
Brian J.
Landi
*,
Matthew J.
Ganter
,
Cory D.
Cress†
,
Roberta A.
DiLeo
and
Ryne P.
Raffaelle
NanoPower Research Laboratories, Golisano Institute of Sustainability, Rochester Institute of Technology, Rochester, NY 14623. E-mail: bjlsps@rit.edu
First published on 9th April 2009
Abstract
Lithium ion batteries are receiving considerable attention in applications, ranging from portable electronics to electric vehicles, due to their superior energy density over other rechargeable battery technologies. However, the societal demands for lighter, thinner, and higher capacity lithium ion batteries necessitate ongoing research for novel materials with improved properties over that of state-of-the-art. Such an effort requires a concerted development of both electrodes and electrolyte to improve battery capacity, cycle life, and charge–discharge rates while maintaining the highest degree of safety available. Carbon nanotubes (CNTs) are a candidate material for use in lithium ion batteries due to their unique set of electrochemical and mechanical properties. The incorporation of CNTs as a conductive additive at a lower weight loading than conventional carbons, like carbon black and graphite, presents a more effective strategy to establish an electrical percolation network. In addition, CNTs have the capability to be assembled into free-standing electrodes (absent of any binder or current collector) as an active lithium ion storage material or as a physical support for ultra high capacity anode materials like silicon or germanium. The measured reversible lithium ion capacities for CNT-based anodes can exceed 1000 mAh g−1 depending on experimental factors, which is a 3× improvement over conventional graphite anodes. The major advantage from utilizing free-standing CNT anodes is the removal of the copper current collectors which can translate into an increase in specific energy density by more than 50% for the overall battery design. However, a developmental effort needs to overcome current research challenges including the first cycle charge loss and paper crystallinity for free-standing CNT electrodes. Efforts to utilize pre-lithiation methods and modification of the single wall carbon nanotube bundling are expected to increase the energy density of future CNT batteries. Other progress may be achieved using open-ended structures and enriched chiral fractions of semiconducting or metallic chiralities that are potentially able to improve capacity and electrical transport in CNT-based lithium ion batteries.
 Brian J. Landi Brian J. Landi | Dr Brian J. Landi is currently a Research Faculty member at the NanoPower Research Laboratories (NPRL) in the Golisano Institute for Sustainability (GIS) at Rochester Institute of Technology (RIT). He received BS and MS degrees in Chemistry in 2002 and a PhD in Microsystems Engineering from RIT in 2006. Dr Landi was a recipient of a NASA GSRP Fellowship during his graduate studies and worked at the NASA Glenn Research Center. His present research interests involve purity assessment of carbon nanotubes as well as developing novel nanomaterials for sustainable energy applications like solar cells and lithium ion batteries. |
 Matthew J. Ganter Matthew J. Ganter | Matthew J. Ganter is currently pursuing a PhD in Sustainability at the Rochester Institute of Technology (RIT), under the direction of Dr Ryne Raffaelle, and conducting research in the NanoPower Research Laboratories (NPRL). He received his BS in Physics from St. John Fisher College in 2006 and MS in Materials Science and Engineering at RIT. His thesis work consisted of solvent interaction and separation of single walled carbon nanotubes and the implications towards lithium ion batteries. His current research focuses on advanced nanomaterials and the sustainability aspects of lithium ion batteries, including life-cycle assessment considerations. |
 Cory D. Cress Cory D. Cress | Dr Cory D. Cress is presently a National Research Council (NRC) research associate located at the Naval Research Laboratory (NRL) in Washington, D.C. He received a BS and MS in Industrial Engineering in 2003 and a PhD in Microsystems Engineering from the Rochester Institute of Technology in 2008. A recipient of a NASA GSRP Fellowship in 2007, Dr Cress researched the effects of ionizing radiation on III–V semiconductor devices and nanomaterials in the development of high efficiency solar cells and radioisotope batteries. Dr Cress's current research interests include optical, electrical, and radiation effects characterization of nanomaterials and devices. |
 Roberta A. DiLeo Roberta A. DiLeo | Roberta DiLeo is currently pursuing a PhD in Microsystems Engineering at the Rochester Institute of Technology (RIT) under the direction of Dr Ryne Raffaelle. She received her BS in Physics and MS in Materials Science and Engineering at RIT in 2008. Her thesis work consisted of nanomaterial synthesis and characterization for polymer solar cells and her current work focuses on nanomaterials for anodes in lithium ion batteries. Roberta was a 2006 recipient of the national Goldwater Scholarship and a 2008 Space Scholar at the Air Force Research Laboratories in Albuquerque, NM. |
 Ryne P. Raffaelle Ryne P. Raffaelle | Dr Ryne P. Raffaelle is a Professor of Physics and Microsystems Engineering at Rochester Institute of Technology (RIT). Dr Raffaelle is the Director of the NanoPower Research Laboratories (NPRL) and Academic Director of the Golisano Institute for Sustainability (GIS). He received a BS and MS in Physics from Southern Illinois University, and a PhD in Physics from University of Missouri at Rolla. |
Broader contextThere is currently a worldwide pursuit for sustainable energy systems that will simultaneously reduce dependence on fossil fuels and greenhouse gas emissions. Underlying these initiatives are strategies towards developing more sustainable transportation (e.g. electric vehicles) and the ability to increase renewable energy consumption from solar and wind technologies. Due to the intermittency of such production and consumption requirements, these directions require significant electrical storage capabilities that are expected to be realized effectively only with advanced batteries. Lithium ion technology has emerged as the premier battery chemistry due to the increased energy density over other rechargeable technologies. This perspective provides a discussion of conventional lithium ion batteries as a necessary framework to describe the potential use of carbon nanotubes in such an application. Carbon nanotubes (CNTs) are imbued with a variety of useful properties including a high aspect ratio, channels for lithium ion intercalation, and excellent conductivity (electrical and thermal). The prospect of incorporating CNTs into a conventional composite as a conductive additive presents a real near-term strategy to increase capacity and rate capability. Ultimately, the ability to fabricate stand-alone CNT electrodes could eliminate the need for metal foil substrates if certain cycling issues are mitigated. The free-standing CNT electrodes can store lithium and also support ultra high capacity semiconductor particles, like silicon and germanium, which will significantly increase the usable anode specific capacity (Ah kg−1) in a battery. Overall, there exists a need to develop new functional materials for lithium ion batteries with enhanced performance to facilitate our transition towards the future electrified society. |
1 Lithium ion batteries
The need to have better energy storage for technological applications like consumer electronics, hybrid-electric-vehicles, and remote sensing applications is propelling electrochemical devices to the forefront of research goals.1,2 In particular, battery technology is attracting considerable interest because of the ability to balance capacity with discharge rate compared to other electrochemical storage devices.1,3 Although primary batteries have utility in many low power or remote locations, there has been a steady evolution of rechargeable battery technology since the highly versatile lead acid batteries were first produced in 1860.4 The commercial adoption of lithium ion batteries has been ongoing since their release by Sony in 19905 based upon the higher energy density afforded to these systems compared to Ni–Cd or Ni-metal hydride counterparts.1 In addition, lithium ion systems offer a broader temperature range, a low self-discharge rate, and no voltage depression (i.e. “memory effect”) which has been a known problem with Ni–Cd.6Fig. 1 highlights the relationship between specific and volumetric energy density for the prevalent rechargeable battery technologies. The general goal for battery development is to increase energy and power densities, while minimizing volumetric and mass constraints (i.e. move to the upper right of Fig. 1). Portable electronics (e.g. cellular phones, PDAs, laptops, etc.) are an excellent example where consumer demand imposes both smaller and lighter batteries that require minimal time to charge, but without compromising talk time or usable battery life. Such a balance between energy density and rate has propelled lithium ion technology to the forefront. Therefore, in response to these expectations, the next generation of lithium ion batteries will need to achieve higher specific capacities, faster C-rates (time for cell discharge in reciprocal hours), increased safety, and appropriate cyclability.2
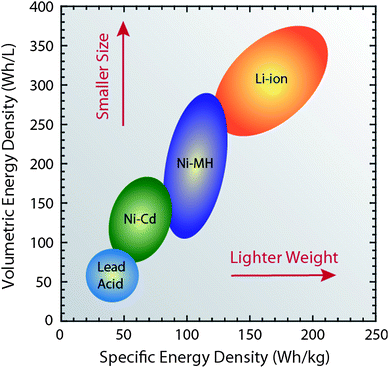 | ||
| Fig. 1 Diagram comparing the rechargeable battery technologies as a function of volumetric and specific energy densities. The arrows indicate the direction of development to reduce battery size and weight. Figure data adapted from ref. 4, 6 and 14. | ||
Conventional lithium ion batteries employ crystalline materials which have stable electrochemical potentials to allow lithium ion intercalation within the interstitial layers or spaces.6 The predominant active electrode materials have been a lithiated metal oxide for the cathode (positive electrode) and a graphitic carbon as the anode (negative electrode). The active materials are combined with a binder (e.g. polyvinylidene fluoride) – PVDF) and conductive additives (e.g.carbon black, graphite, etc.) prior to being deposited onto metal foil current collectors. The electrodes are electrically insulated in the battery through a polymer separator, most often with a microporous polypropylene/polyethylene laminate that allows for lithium ion diffusion. Fig. 2a illustrates an active material stack comprising a cathode coated on an aluminum substrate and the anode deposited onto copper foil; each opposite a commercial separator. Historically, the majority of commercial batteries have utilized LiCoO2 as the active cathode material and either graphite or mesocarbon microbeads (MCMBs) as the active anode material.6Fig. 2b and 2c are representative cross-sectional scanning electron micrographs (SEMs) of such cathode and anode composite electrodes, respectively. The composite thicknesses can range from 75 to 200 µm on thin (12–20 µm) metal foil current collectors for typical high energy density lithium ion batteries. It is important to note that the composite thickness values are highly sensitive to the formulation, coating conditions, and intended application design towards high energy density (thicker active layer) or high power density. The high power batteries being produced today typically rely on an active layer thinning strategy to increase the charge–discharge rates. This strategy presents a severe reduction in the total energy density in the battery because the relative mass of metal foil current collector increases compared to the active material. Overall, the selection of active materials is extremely important to performance, but processing variables (e.g. active material/binder/additive concentration, deposition conditions, active layer thickness, etc.) are just as critical to achieving state-of-the-art (SOA) electrodes.
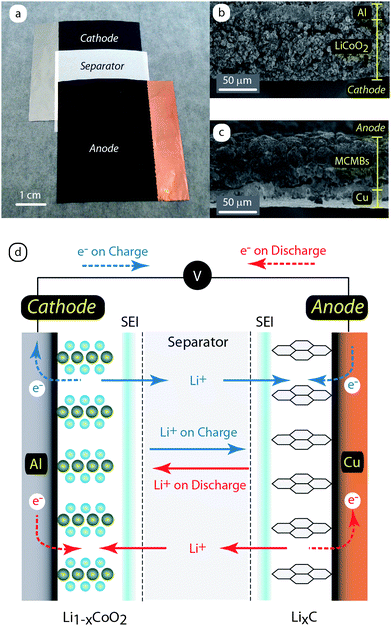 | ||
| Fig. 2 (a) Photograph of a conventional lithium ion battery active layer stack including a LiCoO2 cathode composite on aluminum, microporous poly(olefin) separator, and MCMB anode composite on copper. Cross-sectional scanning electron micrographs depict the microstructure for the (b) cathode and (c) anode, respectively. (d) Schematic illustrating the mechanism of operation for a lithium ion battery including the movement of ions between electrodes (solid lines) and the electron transport through the complete electrical circuit (dashed lines) during charge (blue) and discharge (red) states. Figure 2d adapted from ref. 6. | ||
A lithium ion battery operates by movement of lithium ions from the cathode to the anode upon charge and the reversible process occurs during discharge, as shown by the schematic in Fig. 2d. The lithiated metal oxides and graphitic carbons are layered materials with interstitial spaces receptive to lithium ion intercalation. The active material is able to store the lithium due to the simultaneous electron transport from the current collector to reduce the lithium ion at the active material “host” site. The intercalation process is aided by a necessary solid-electrolyte-interface (SEI) that forms on the surface of each electrode which serves a critical role, namely to passivate the electrode surface from further solvent reduction and to act as a selective layer to allow only lithium ions to diffuse.7 The lithium ions are present in an electrolyte comprising a lithium salt, most often LiPF6, solvated by a mixed solution of alkyl carbonates (i.e. ethylene carbonate (EC), dimethyl carbonate (DMC), etc.). The choice of electrolyte solvent is critical to forming a stable SEI due to decomposition of both salt and solvent species leading to layer components like LiF and LiCO3.7 The electrolyte formulation and origin of SEI components have been major research areas and there are still ongoing studies for new lithium salts and solvents with improved ionic conductivity and temperature ranges.8,9
One of the challenges and opportunities for lithium ion batteries is the range of intercalation compounds which can be employed for lithiation. In graphitic carbons, lithium ions intercalate between graphene layers in stages that result in a maximum configuration of one lithium atom to every six carbon atoms. The theoretical capacity for LiC6 is 372 mAh g−1.10,11Fig. 3 shows that the graphite capacity is typically larger than the practical capacity from prevalent cathode materials by a factor of two to three.2 In order to improve the specific energy density (Wh kg−1) in batteries, one can increase the overall battery capacity (Ah kg−1) and/or voltage (V). The battery voltage is derived from the electrochemical potential difference between the cathode and anode with respect to lithium metal as highlighted in Fig. 3. Since most batteries employ graphite as the anode which has a constant potential between 0.1–0.2V vs. Li/Li+, the battery voltage and extent of lithium storage is highly influenced by the cathode chemistry, stoichiometry, and crystal structure. Thus, attempts to increase the specific energy density can be done by improving the cathode capacity and/or by increasing the voltage of the cathode vs. Li/Li+.12,13 The other strategy to increase the energy density is to augment the anode capacity sufficiently to increase the number of active layers contained within an individual battery.
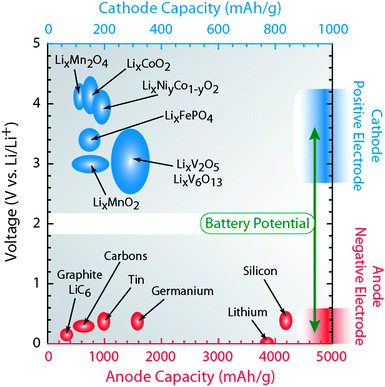 | ||
| Fig. 3 Diagram illustrating the lithium ion capacity and electrochemical reduction potentials with respect to lithium metal for conventional anode (red axis) and cathode materials (blue axis). The battery potential is the relative difference between the voltage of the selected positive electrode materials (blue ovals) and voltage of the corresponding negative electrode material (red ovals). Figure data adapted from ref. 6, 14–16. | ||
High capacity anode materials have been under development since the original lithium metal batteries were produced in the 1970s.14Lithium metal anodes have a high inherent capacity (3860 mAh g−1), but present commercial challenges related to reactivity with the electrolyte, dendrite formation during recharge, and battery safety.14 In comparison, lithium shows attractive alloy properties with pure elemental compounds or thin films of aluminum (800 mAh g−1)14 and select group 14 elements (silicon, germanium, and tin). The lithium ion capacity for these compounds is substantial; as shown in Fig. 3 for tin (994 mAh g−1), germanium (1600 mAh g−1), and silicon (4000 mAh g−1).15,16 There are, however, two main limitations to using anodes which alloy with lithium, namely excessive crystalline expansion (up to 400% volumetric expansion) and poor electron transport at high charge–discharge rates.15 If the high capacity property of the lithium semiconductor alloys could be exploited without the excessive crystalline expansion or poor charge transport, there would be a novel impact for high capacity anodes.
The development of nanostructured electrodes to address the limitations of bulk crystalline expansion can be envisioned by either decreasing the size of the semiconductor particles to the nanoscale or through introduction of other functional nanomaterials. It has been shown previously that reduction of a material's particle size to the nanoscale (i.e. <100 nm) can change the crystal structure and may modify the mechanism of volumetric expansion upon lithiation, as demonstrated recently for silicon and germanium nanowires.15,17 An additional goal would be to combine the high capacity lithium semiconductor alloys with nanostructured materials like carbon nanotubes to establish an electrically conductive percolation network on the nanoscale. Such a network could achieve fast electron transfer and rely upon shorter lithium diffusion lengths within the semiconductor nanoparticle; an analogous approach to the progress in cathode rate capability with nanoscale lithium iron phosphate structures.18 A further opportunity for the use of nanostructures, in conjunction with conventional anode carbons or the lithium semiconductor alloys, is the ability to form a free-standing electrode. This approach obviates the need for a composite blend being deposited on an inactive metal foil substrate.1,3,19 Such an approach could increase the specific and volumetric capacity of the anode, and has served as the recent motivation for developing free-standing electrodes based upon carbon–carbon composites20 and single wall carbon nanotube (SWCNT) papers.21
2 Carbon nanotubes
Carbon nanotubes can be envisioned as a rolled up graphene sheet into a seamless cylinder with fullerene caps for single wall (SWCNTs) or multiple sheets as in the case of a multi-walled carbon nanotubes (MWCNTs).22 Characteristic of MWCNTs are the concentric layers that are spaced 0.34 nm apart22 and illustrated by the transmission electron micrograph (TEM) in Fig. 4a. In the case of SWCNTs, there are prominent van der Waals interactions between sidewalls that lead to hexagonally close-packed bundles.22 The bundles are an important physical property and a corresponding TEM image from as-produced SWCNTs is shown in Fig. 4b. The electronic properties of SWCNTs are determined by the chirality of the SWCNT, which represents the diameter and helicity of the structure. The chirality determines whether the nanotube will be metallic or semiconducting in nature. Fig. 4c demonstrates the basis for assigning SWCNT chiralities with a roll-up vector (na1 + ma2) from a point of origin on a graphene sheet. The chiral angle (≤30°) is the angle between the zigzag axis and the roll up vector. The result from this exercise is a series of chiral indices with integer values of n and m, which are used to assign the uniqueness of each SWCNT. Based upon quantum confinement effects, the optoelectronic properties are unique to each (n, m) SWCNT and show a chirality-dependent relationship.23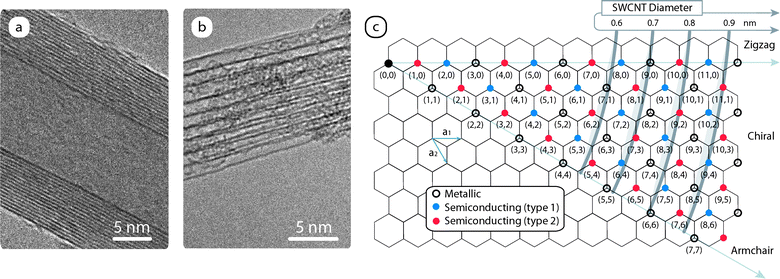 | ||
| Fig. 4 Transmission electron micrographs of an as-produced (a) multi-walled carbon nanotube (MWCNT) and (b) single-wall carbon nanotube (SWCNT) bundle. (c) Chirality chart illustrating the assignment of (n, m) SWCNT structures using a role-up vector from an origin point on a graphene sheet and the nanotube diameter. | ||
There is considerable ongoing effort to develop control over individual CNT properties (chirality, length, purity, electronic type ratio, etc.) for a variety of applications.21,24,25 This control can either be accomplished during synthesis or in conjunction with subsequent processing steps aimed at purification and separation of the desired products.26–28 Synthesis of CNTs results from a wide variety of different methods that involve the catalytic decomposition of a carbon-containing gas or solid. Some of the most common techniques are chemical vapor deposition (CVD), arc-discharge, and laser vaporization synthesis.21,24 Research efforts to modify the synthesis conditions are directed towards minimizing the various amounts of synthesis by-products (amorphous carbon, metal catalysts, fullerenes, etc.) in addition to having the ability to tailor the chirality distributions in a manner conducive to large-scale production of high quality CNTs.29 In the case of SWCNTs, the optical spectra can easily discriminate changes in synthesis conditions, particularly with respect to changes in chirality distributions.30Fig. 5 is an overlay of three prominent synthesis approaches, including commercial CoMoCAT® (Southwest Nanotechnologies) and HiPco® (Carbon Nanotechnologies Inc./Unidym) samples compared to material produced using an in-house laser vaporization reactor. The conditions to produce these types of SWCNTs are provided in the literature.29,31,32 The corresponding shifts in resonant absorption features from the distribution of individual SWCNT chiralities are evident in the overlay of Fig. 5. The SWCNT samples in Fig. 5 were analyzed after using ultracentrifugation on 1% sodium deoxycholate–D2O dispersions to effectively remove non-dispersed SWCNTs and impurities to improve the resolution of the spectra.33 By doing so, the optical spectrum becomes a unique “signature” for each SWCNT sample.23,34
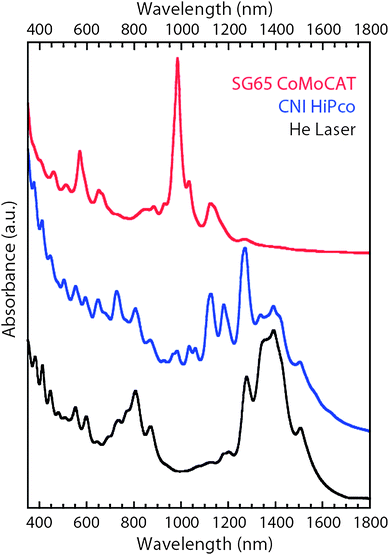 | ||
| Fig. 5 Optical absorption spectra for SWCNT samples synthesized by the CoMoCAT process (red; top curve), HiPco process (blue; middle curve), and laser vaporization in the presence of helium gas (black; bottom curve). The spectra (offset for clarity) were obtained on the supernatant from as-produced SWCNT samples that were dispersed in 1% sodium deoxycholate–D2O and subjected to ultracentrifugation at 45,000 rpm for 1 h. | ||
The ability to employ different production conditions to tune the SWCNT chiral distributions29 is an initial step to advance the characterization of chirality-dependent properties. The discovery of SWCNT fluorescence35,36 has provided a straightforward approach to discriminate the semiconducting distribution SWCNT types in a sample (see Fig. 6).34 This is a major improvement over absorption spectroscopy where multiple SWCNT features can be convolved within the same peak at a given wavelength. Fig. 6 illustrates the advantage of fluorescence “mapping” by systematic excitation of the SWCNT samples over a range of wavelengths through the visible and near-infrared region. The assignment of semiconducting chiralities34 shows how the SG65 CoMoCAT sample has the smallest diameter distribution with a predominance for the (6,5) species and CNI HiPco and Helium-Laser materials have slightly larger diameters and more heterogeneous samples. Therefore, optical spectroscopy is a critical tool to understand the SWCNT distributions in a sample, as well as offering insight during electronic type separations.
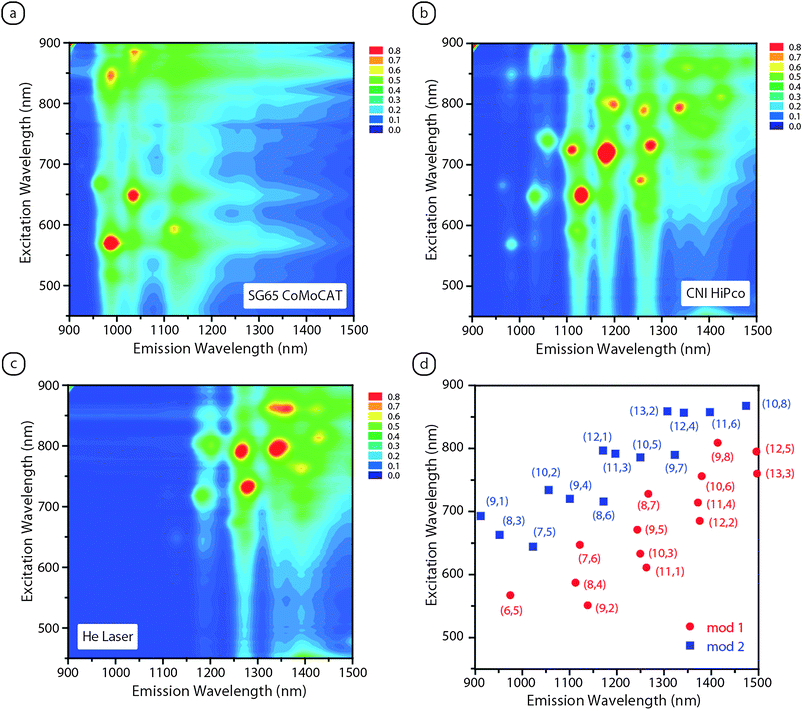 | ||
| Fig. 6 Fluorescence analysis of different as-produced SWCNT samples synthesized by the (a) CoMoCAT process, (b) HiPco process, and (c) laser vaporization in the presence of helium gas. The fluorescence samples were obtained from the supernatant after dispersion in 1% sodium deoxycholate–D2O and subjected to ultracentrifugation at 45,000 rpm for 1 h. The fluorescence assignments for peak emission by semiconducting chiralities over the spectral range analyzed is shown in (d) and are based upon values from ref. 36. | ||
The effects of chirality distributions will be critical to applications taking advantage of the remarkable physical and electrical properties of SWCNTs. In addition, there is a pressing demand by researchers for quality verification and consistency of SWCNT samples from commercial sources.37 However, at present there is no established metrology which accurately quantifies the types, amount, and morphology of SWCNT-containing materials. In general, the most important metric is the “purity”, or quantity of SWCNTs present in relation to other by-products from the synthesis.28 The by-products are the principal component of the as-produced materials or raw SWCNT “soot” and are seen to dominate the physical characteristics, especially prior to purification.28 Therefore, material standardization of SWCNTs is required in terms of electronic type and degree of purity, before being fully functional in advanced device applications.28 Our recent report represented the initial example of a calibration standard for SWCNT purity employing optical absorption spectroscopy and thermogravimetric analysis (TGA) to determine the mass fraction of SWCNTs in a sample.28 The utility of a constructed sample set and experimental extinction coefficients was shown to accurately quantify the purity of raw soot to assess changes during synthesis or to monitor the progress during purification steps.28,38 The results have demonstrated a reproducible level of SWCNT purity to be retained during purification, as well as a fundamental understanding of SWCNT thermal decomposition during TGA. The implementation of well understood characterization techniques which extract pertinent information about the sample's quality can allow for the consistency demanded in CNT-based devices.
3 Carbon nanotubes for lithium ion batteries
3.1 Overview
Several years after the discovery of CNTs,39 Nalimova et al. studied lithium vapor interactions with MWCNTs40 and subsequently Che et al. and Frackowiak et al. measured the electrochemical properties.41,42 Since then, there have been numerous reports evaluating the use of CNTs in lithium ion batteries.42–56Lithium ion capacity in CNTs results from effective diffusion of lithium ions into stable sites located on the nanotube surface and/or inside individual nanotubes through endcap or sidewall openings. In addition, lithium ion intercalation can occur between the MWCNT layers (entering through lattice defects or open nanotube ends) or in the interstitial sites of close-packed SWCNT bundles (the 2-dimensional triangular lattice arising from van der Waals attractions between nanotube sidewalls57).58–70 In addition to LixC capacity, there are calculations which propose a curvature-induced lithium condensation inside the core of the nanotubes.69,70 These results show a linear dependence with diameter that could improve the capacity further for large diameter CNTs. Overall, the theoretical calculations suggest that reversible capacities exceeding a LiC2 stoichiometry (>1116 mAh g−1) is attainable for SWCNTs,64,68 which represents a dramatic improvement over conventional graphite limits. In addition to the potential enhancement in lithium ion capacity with novel CNT anodes, there are further benefits to lithium ion batteries using CNTs as additives in composite electrodes and as a physical support for high capacity semiconductor materials.3.2 Conductive additives
The use of CNTs as an additive for either the anode or cathode has several advantages compared to other carbon additives like carbon black, acetylene black, or even carbon nanofibers. CNTs have a high theoretical electrical conductivity71 and room temperature measurements exceed 5 × 10⁵ S m−1 for the purified materials. The high aspect ratio of CNTs (ratio of length to diameter which is >10,000 for typical materials) compared to the other carbon additives allows for lower weight doping levels to achieve a comparable percolation threshold (the concentration in a composite that sustains long range connectivity or contiguous pathways for electrons to move). At SWCNT mass loadings of only 0.2% w/w, a comparable conductivity can be achieved compared to spherical particles in a composite due to the percolation network.72 Therefore, the use of CNTs could represent more than an order of magnitude reduction in additive mass compared to conventional carbon additives for a sufficient percolation network to achieve appropriate electrical conduction.The implication of a lower weight loading from the CNT additive is an immediate increase in electrode capacity equivalent to the relative increase in active material substitution for the conventional additive constituent. Results from the literature support this idea based upon efforts to incorporate CNTs with both positive and negative electrode materials.73–82 MWCNTs have been employed as an additive with LiCoO2,74 LiFePO4,75,78,83 and LiNi0.7Co0.3O2 cathodes;73,79 showing ∼10% improvement in the reversible capacity of the electrodes compared to carbon black counterparts. In terms of anode improvement, recent work investigating the enhancement in capacity using MWCNTs with nanobrookite TiO2 has shown a three-fold improvement in capacity over comparable composites using carbon black.76
While the ability to achieve electrical percolation at low doping levels is a crucial characteristic, there are other potential advantages using CNTs in the composite blend. Due to the nature of π-orbital overlap in metallic CNT chiralities, the electron conduction can occur via ballistic transport (i.e. electrons can transfer with mean free paths on the order of microns along the length of the nanotube unless scattered by a defect).22 This type of property has the potential for increased C-rate performance when used as an additive, particularly in conjunction with the poor transport inherent to cathode materials. Recent literature shows the ability to maintain the ∼10% improvement in reversible capacity at low rates up to the equivalent of a 3C rate for LiCoO274,80 and a 5C rate for LiFePO4.78
CNTs also have remarkable thermal conductivity84 properties that can promote effective heat dissipation within a composite, potentially enhancing the safety over composite electrodes with inferior carbon additives. In addition, the mechanical properties of CNTs exhibit both strength and flexibility:85 attractive features to prevent cracking during operation or in vibration environments. The ability to entangle anode and cathode particles using CNTs can obviate issues of active particle separation with extended cycling. All of the recent reports using CNT additives in the composite electrode formulation showed equivalent or improved cycling behavior with CNTs over other carbon additives.73–75,78,79,81 Thus, the ability to use CNTs as an additive in conventional electrode composites shows tremendous promise to enable higher reversible capacities and rate capability while improving battery cyclability.
3.3 Free-standing electrodes
The concept of using a free-standing carbon nanotube “paper” as an electrode in electrochemical applications comes from the ability to maintain bifunctionality (i.e. role as both the active material and current collector) as discussed previously for carbon–carbon composites.20 The potential for high temperature applications is conceivable since no binder is required to fabricate these electrodes, opening up the possibility for use in battery applications in excess of 200 °C (a temperature at which most conventional binders are unstable). The free-standing electrodes also offer a lightweight, flexible geometry for thin film batteries and alternative form factors. Lastly, an opportunity exists to combine free-standing electrodes with high capacity semiconductors by utilizing the CNT percolation network for electrical transport and as a physical support.Fig. 7a provides a representative image of a free-standing SWCNT paper after the appropriate purification steps (SEM of material in Fig. 7b). Fabrication of SWCNT papers can be accomplished either through vacuum or pressure filtration where stable dispersions are eluted through a porous inert support (e.g. Teflon®), resulting in the free standing paper. The physical properties of free-standing CNT papers are important considerations for any application, but with lithium ion batteries the obvious questions surrounding strength and conductivity are paramount. Since many battery processing steps utilize roll coaters or dye cutting, the strength is an important consideration for CNT electrodes since binder and metal substrate are absent. The tensile strength of typical SWCNT papers are 80–100 MPa, although the synthesis and processing steps can dramatically affect this property. The Young's modulus for SWCNT papers is in the range of 5–10 GPa, which indicates that a large force can be applied to these materials prior to plastic deformation. Visual evidence of this property is illustrated in Fig. 7c where strips of SWCNT paper are bent around a curved surface and twisted without any unintended or irreversible deformation. Another convenient property is that the CNT papers can be shaped into any form factor required; they can easily be cut with conventional cutters or shears.
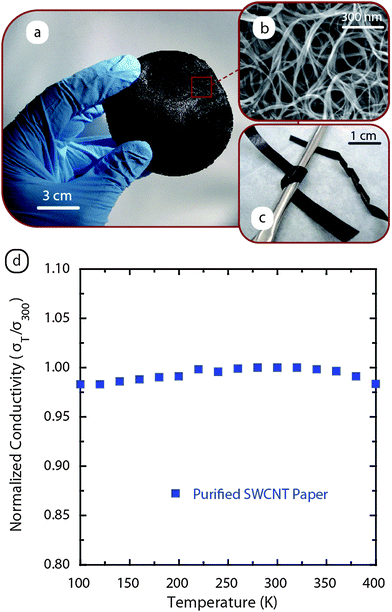 | ||
| Fig. 7 (a) Photograph of a free-standing SWCNT paper prepared using vacuum filtration. (b) SEM image of the high purity SWCNTs. (c) Image of SWCNT paper strips which are bent around a curved surface and twisted without any unintended or irreversible deformation to illustrate the flexible mechanical properties. (d) Temperature-dependent electrical conductivity measurements for a high purity laser-synthesized free-standing SWCNT paper normalized to the value at 300 K to demonstrate the lack of significant change with temperature. | ||
The electrical conductivity of purified SWCNT papers is routinely 5 × 10⁵ S m−1 and can approach pure metal conductivity with appropriate doping. The temperature-dependent response for free-standing electrodes also has attractive electrical properties, including a conductivity response that shows relatively constant values. Fig. 7d illustrates the observed behavior with less than 3% variation in conductivity over the range of 100–400 K (data normalized to conductivity at 300 K). The electronic transport in free-standing SWCNT electrodes has been attributed to predominant metallic conduction interrupted by tunneling barriers due to tube-tube interactions as well as contributions from phonon backscattering and variable range hopping.86
The most important impact of using a free-standing electrode is that the usable capacity can be increased by removing the inactive copper foil. The usable capacity is the actual electrode capacity (Ah/mass of electrode) that varies with the thickness of the anode composite and the thickness of the copper based upon simple mass averaging considerations. Although the specific capacity of the graphitic carbon is typically 300 mAh g−1, the effect of using a composite anode (assuming 90% active) and subsequent deposition onto copper foil in a bilayer design can reduce the usable capacity by 47% for 100 µm thick composites on 20 µm foil (similar conditions to electrodes in Fig. 2). Thus, a free-standing electrode with a capacity of 300 mAh g−1 has a usable capacity of 300 mAh g−1 compared to the 160 mAh g−1 for the bilayer electrode of graphitic composites on both sides of copper foil. Removal of the copper substrate has additional benefits including an increased depth of discharge and the ability to maintain a near-zero volt state of charge. It is well documented that prolonged cycling below 2.5 V leads to oxidation of the copper substrate.87 Hence, there are tangible benefits to develop a free-standing carbon anode that has both high lithium ion capacity and sufficient electronic transport for the next-generation of lithium ion batteries.
3.4 Single wall carbon nanotubes
The initial evaluation of free-standing SWCNT electrodes showed that the lithium ion capacity is generally between 400–460 mAh g−1 for purified materials.45,88–90 Attempts to shorten and introduce sidewall defects in the SWCNTs have resulted in reported capacity values approaching 1000 mAhr g−1.91–94 In all cases to date, there is a large first cycle insertion loss attributed to SEI formation at around 0.9 V (exact value dependent on electrolyte and constant current) that leads to significant irreversible capacity for SWCNTs. This effect has been attributed to the high mesoporous volume of SWCNTs which affects the extent of solvent decomposition leading to the SEI formation.45 However, due to the varying roles of additives and co-solvents on this process,95 a more thorough examination is warranted for SWCNTs in differing electrolytes (co-solvent mixtures with EC have strictly been used to date45,88–93). As an example, our work recently showed that the lithium ion capacity of purified SWCNT papers was actually improved with the addition of propylene carbonate (PC) to have a first cycle reversible capacity of 520 mAh g−1.96 PC is an attractive solvent for low temperature applications due to its melting point of −49 °C (instead of requiring mixed carbonates when using EC, which is a solid at room temperature). However, it is well documented that the use of PC leads to exfoliation of graphene layers in graphitic carbons resulting from solvent co-intercalation, reduction, and release of propylene gas which ruptures the carbon matrix.3,19 Thus, further studies to understand the SEI formation process with CNTs are expected to show important differences from conventional graphitic anodes.Another important consideration when evaluating the early measurements on SWCNTs is that they were performed for only a few cycles using materials without a standard of purity. Given the recent developments on purity standards for SWCNTs,28,38 it is now possible to investigate whether a purity dependence exists for the lithium ion capacity in SWCNT electrodes. Raw SWCNTs of sufficient quality can also be fabricated into free-standing papers and would be an attractive material since the purification costs would be eliminated. Fig. 8 depicts the typical charge–discharge curve for both raw and purified SWCNT free-standing electrodes against a lithium metal anode in a conventional 1M LiPF6EC:DMC electrolyte. The effect of purity is seen to be very pronounced in terms of both the voltage profile and reversible capacity. The raw SWCNT electrode shows less than 50 mAh g−1 reversible capacity whereas the equivalent measurement using a purified SWCNT electrode shows a capacity of 450 mAh g−1. As emphasized earlier, the quality of the material being utilized is a critical parameter when describing any device performance, particularly for the electrochemical properties. The data shows that raw SWCNT soot, directly extracted from a reactor, is insufficient as a lithium storage material. The implication from this result is that the purification process is critical to the success of any lithium ion capacity measurement, but consideration to use the raw soot as a conductive additive is expected to be less problematic.
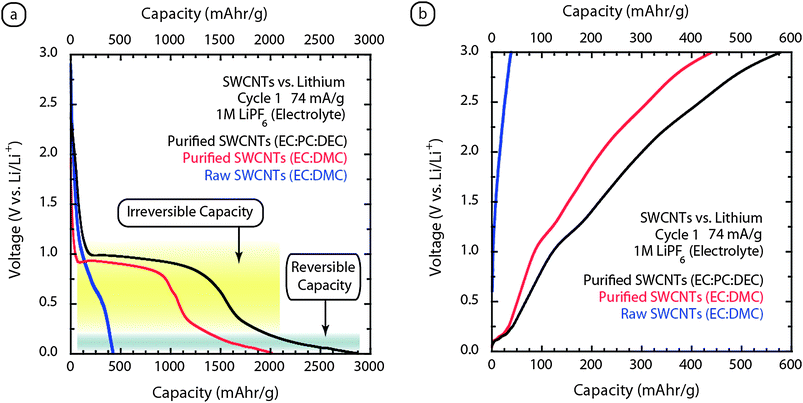 | ||
| Fig. 8 Galvanostatic (74 mA g−1) cycling of SWCNT paper electrodesvs.lithium metal for (a) cycle 1 insertion and (b) cycle 1 extraction. A comparison of raw SWCNTs (blue curve) and purified SWCNTs (red curve) using EC:DMC (1:2 v/v) illustrates the significantly higher reversible capacity for purified. The modification of electrolyte for purified SWCNTs using EC:PC:DEC (1:1:2 v/v) enhances the reversible capacity as evident by the black curve. The regions of the electrochemical cycling data that are attributed to reversible and irreversible capacity are indicated by gray and yellow shaded regions, respectively. | ||
The purified sample in Fig. 8a has the well known SEI formation around 0.9 V that is designated by the yellow shaded region as the “irreversible capacity”. The majority of the reversible capacity originates from the insertion reaction at potentials less than ∼0.25 V vs. Li/Li+ (gray shaded region). This relationship has been determined from half-cell measurements which sequentially cycled to lower potentials and showed that potentials above 0.25 V are not able to reversibly store lithium, but rather promote reduction of the electrolyte. The effects of solvent on the reversible capacity of SWCNT electrodes is also critical and additional work using diethyl carbonate (DEC) has shown the reversible capacity can be improved to over 575 mAh g−1 (see Fig. 8b). The insertion/extraction curves are similar for the EC:PC:DEC (1:1:2 v/v) measurements compared to EC:DMC, but with higher capacity. Recent work has also investigated the use of vinylene carbonate (VC) as an additive in the electrolyte (5% by volume).97 It was shown that there is an increase in reversible capacity to 625 mAh g−1 for the first cycle and this was attributed to changes in the SEI from the VC interactions on the nanotube surface.97
Thus, the lithium ion capacity measurements for SWCNT paper anodes show dramatic effects from the electrolyte components, particularly with the selection of co-solvents.96 However, all measurements to date have been obtained at room temperature and so the relationship between temperature and capacity is also of potential interest. Recent work using a 1M LiPF6 in EC:PC:dipropyl carbonate (DPC):VC (1:1:2:0.05 v/v) electrolyte demonstrated first cycle capacities approaching 1000 mAh g−1 at 100 °C for high purity SWCNT anodes.97DPC was selected as the co-solvent due to its higher boiling point compared to DEC and DMC. It is interesting to note that the proposed trend in higher lithium ion capacity for SWCNT anodes with longer alkyl-chained carbonate co-solvents is consistent with all measurements to date.
At this stage of development, the physical properties of the SWCNT electrodes show stability to the cyclic lithiation process. It has also been measured that the lithium ion capacity is insensitive to the thickness of the free-standing SWCNT electrodes. This can be an important consideration in terms of matching the capacity of these electrodes to the cathode in a full battery. Lastly, post-mortem characterization has suggested that the structural integrity of the nanotubes is preserved after cycling, although modification of the SWCNT bundle properties is evident from x-ray diffraction studies.88,96
3.5 Multi-walled carbon nanotubes
Similar to the SWCNT electrodes, multi-walled carbon nanotubes (MWCNTs) are able to be fabricated into free-standing electrodes, albeit with slightly reduced mechanical properties. MWCNTs can be synthesized using a more cost effective injection chemical vapor deposition (CVD) process that produces high quality material with minimal post-synthesis processing to improve the purity.27 Additionally, synthesis conditions can be optimized using calibrated purity assessment protocols viaRaman spectroscopy to establish control over sample quality.98 These high quality MWCNTs have been fabricated into free-standing electrodes and have been evaluated in terms of their lithium ion capacity.99 Similar to the SWCNT results, the longer alkyl-chained co-solvents improve the reversible capacity. In the case of a 1M LiPF6EC:PC:DMC (1:1:2 v/v) electrolyte, the capacity was measured to be 150 mAh g−1. However, a change in solvent composition to EC:PC:DEC (1:1:2 v/v), increased the reversible capacity to 210 mAh g−1 with excellent coulombic efficiency (greater than 97% after a few cycles). Fig. 9 depicts the typical charge–discharge curve for a MWCNT electrode using the 1M LiPF6EC:PC:DEC electrolyte at a constant current of 74 mA g−1. The MWCNT electrodes exhibit irreversible capacity losses at ∼0.8 V, on the order of 50%, which is a reduced amount compared to the SWCNTs.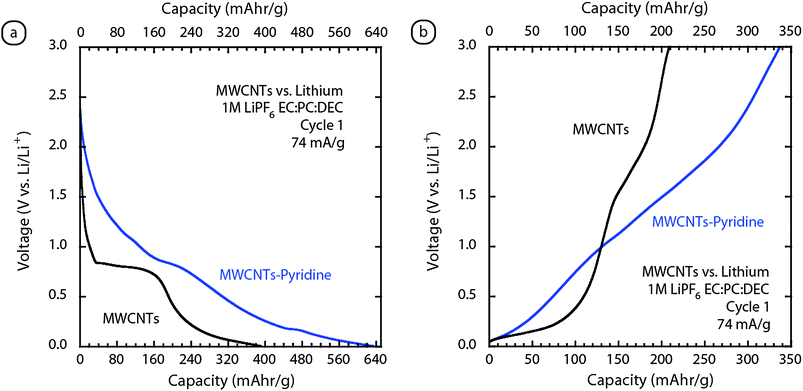 | ||
| Fig. 9 Galvanostatic (74 mA g−1) cycling of MWCNT paper electrodesvs.lithium metal for (a) cycle 1 insertion and (b) cycle 1 extraction. The overlay shows the comparison between the standard high quality MWCNTs (black curve) and the pyridine modified sample (blue curve). Each of the measurements utilized a 1M LiPF6EC:PC:DEC (1:1:2 v/v) electrolyte. | ||
Elemental doping of carbon nanotubes has been a recent pursuit to improve electrochemical performance,3,51 and recently we showed that replacement of xylenes as the catalyst solvent with pyridine during synthesis could modify the structure of the MWCNTs during growth.99 The electrochemical cycling data for the MWCNT–pyridine sample is highlighted in Fig. 9. The results show an increase in reversible capacity to 340 mAh g−1, and similar cycle one coulombic efficiency compared to the normal MWCNT electrode. The Raman data for MWCNT–pyridine electrodes showed higher defect content based upon D-band analysis, but the extent of nitrogen doping during synthesis may also influence the electrochemical results.99 Although the exact structural changes are still being studied, the effect of pyridine incorporation during synthesis has produced MWCNT–pyridine electrodes with reversible capacities of 340 mAh g−1 and stable cycling behavior.99
3.6 Carbon anode comparison
The electrochemical testing of free-standing CNT electrodes has shown promise to date, but a comparison with conventional MCMB data can provide a context for the CNT results with the state of the field. Fig. 10 shows an overlay of the half-cell testing for the 2nd cycle of conventional MCMBs, MWCNTs, and SWCNT electrodes. Fig. 10a shows the characteristic voltage profile for lithium ion intercalation (i.e. staging) into MCMB (black curve) at voltages between 0.1–0.2 V (V vs. Li/Li+), whereas the CNT electrodes have a smoothly varying voltage profiles, with less defined staging. During the extraction phase (Fig. 10b), the MCMBs maintain a well-defined de-intercalation of lithium at ∼0.2V. The MWCNT electrode exhibits a similar feature for the initial part and then becomes smoothly varying with higher potential at higher capacity. The extraction of lithium from the SWCNT electrode is similar to amorphous carbonaceous materials,14 although there is a small feature reminiscent of staging in graphite at ∼0.1 V which is attributed to lithium ion insertion within the nanotube bundles. The smoothly varying voltage curve in an amorphous electrode suggests that multiple sites for lithium stability are present. Although the total lithium ion capacity of high purity SWCNT electrodes is higher than the total capacity of MCMBs (i.e. 520 mAh g−1vs. 330 mAh g−1), the insertion/extraction voltage profiles are uniquely different. The presence of lithium staging can significantly benefit the overall voltage profile in a full battery when using conventional cathode materials. Thus, there exists a need to improve the crystallinity of the CNT papers to exploit the low potential insertion/extraction profile.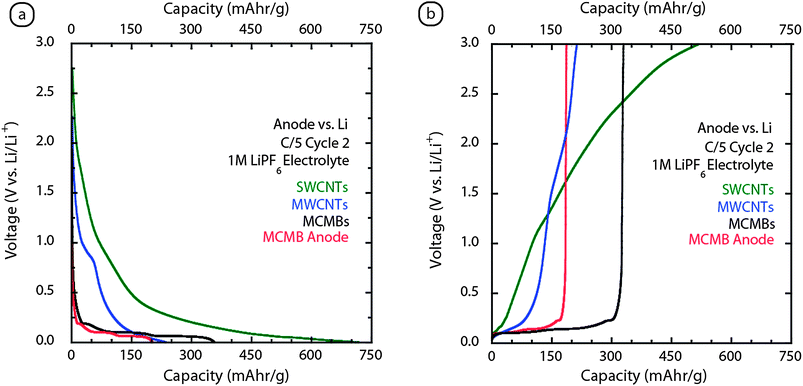 | ||
| Fig. 10 Comparison of the galvanostatic (equivalent C/5) cycling of SWCNT (green curve) and MWCNT (blue curve) paper electrodes with conventional MCMB composites vs.lithium metal for (a) cycle 2 insertion and (b) cycle 2 extraction. The MCMB data for the black curve is the active material whereas the red curve is the effective capacity of the anode which factors in the inactive composite and substrate components. Each of the measurements utilized a 1M LiPF6 electrolyte with the CNT electrodes using a solvent combination of EC:PC:DEC (1:1:2 v/v) and the MCMBs using EC:DMC (1:2 v/v). | ||
The main advantage of CNT electrodes though, is their free-standing nature, which means that the electrode mass is the active mass. As a point of comparison, Fig. 10 also displays the effective MCMB anode capacity (red curve) as a function of half-cell voltage and shows the reduction in usable capacity from conventional anode designs based upon composite electrodes deposited on metal foils. Although the specific capacity of the MCMBs is inherently 330 mAh g−1 (black curve in Fig. 10), the effect of using 100 µm thick anode composites on 20 µm copper foil (similar electrode conditions to Fig. 2) reduces the effective capacity to 175 mAh g−1. These effects on usable capacity significantly shift the point of parity with the MWCNT and SWCNT electrodes, and will be a point of further consideration when evaluating full battery results in regards to capacity and depth of discharge.
3.7 Silicon–SWCNT supported structures
Another attractive property of the free-standing electrodes is that they offer a lightweight, stable structure for ultra-high capacity active materials to be supported. This type of strategy capitalizes on electrical transport from a nanotube percolation network, and the opportunity to interface or deposit higher capacity crystalline materials directly onto the nanotube surface for an improved voltage profile. Recent efforts to incorporate inorganic compounds and semiconductors with CNT materials for improved anodes have included reports on silicon,100–102 SnO2,103,104SnSb,43,105 and Li4Ti5O12.82When exploring this strategy, there are three prevalent approaches to incorporate other materials: chemical bonding to CNTs, physical mixing, and direction deposition. Chemical bonding can be achieved either through covalent bonding (which is less attractive because it disrupts the carbon–carbon bonding and inherent electrical transport) or through noncovalent bonding that relies upon sidewall interaction via π–π stacking to adhere desired nanoparticles.106,107 Physical mixing is a convenient way to achieve viability, but sample preparation and heterogeneity will assuredly influence the efficacy and cyclability. A third option is direct deposition which can be accomplished using electroplating, evaporation, and/or sputtering. Each approach to material incorporation will balance concentrations (weight loading) and uniformity of nanotube surface interactions to maximize electrochemical performance.
Fig. 11 provides an example whereby nano-silicon particles (average diameter of 50 nm) were incorporated within the freestanding SWCNT electrode in a 50 : 50 ratio during filtration steps to have a highly dispersed and interactive electrode. The electrochemical cycling results for silicon–SWCNT electrodes show high initial reversible capacities around 1400 mAh g−1. The data also illustrates the irreversible loss from the SEI formation with the SWCNTs, resulting in a net coulombic efficiency around 50% for the silicon-supported electrode. On the 2nd cycle, the SWCNT SEI effects are minimized, but the reversible capacity also decreases by 15%. Such an effect is expected for silicon based anodes due to the aforementioned volumetric expansion and contraction of the silicon lattice structure leading to some irreversibility. However, the results of Fig. 11 demonstrate the notion of using the SWCNTs as a support for higher capacity materials, like silicon, to increase the anode capacity. Efforts directed towards optimizing the size, stability, and method of deposition using semiconductors like silicon can improve anode performance. However, other designs may find utility in germanium-based electrodes which have a higher lithium diffusivity at room temperature and are not prone to facile oxidation like silicon.15
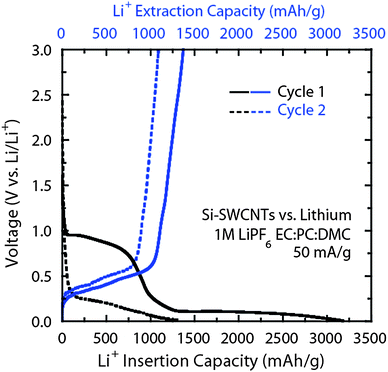 | ||
| Fig. 11 Galvanostatic (50 mA g−1) cycling of silicon–SWCNT paper electrodesvs.lithium metal for cycle 1 (solid lines) and cycle 2 (dashed lines). The overlay shows a comparison between the insertion (black curve) and extraction (blue curve) curves. The characteristic SEI formation is evident on cycle 1 for the SWCNTs as well as the crystalline intercalation of lithium in silicon at potentials less than 0.25 V. The measurement utilized a 1M LiPF6EC:PC:DMC (1:1:2 v/v) electrolyte. | ||
3.8 Modeling of capacity improvement
The major motivation for implementing free-standing electrodes is the corresponding increase in usable anode capacity that can augment the overall battery capacity. The percent improvement in battery performance with free-standing anodes is not a direct computation due to capacity matching with the cathode and optimizing the number of active layers for a given geometry. An empirical model has been developed which calculates the impact of free-standing electrode properties (density and reversible capacity) on the percent improvement in battery capacity. The model assumes bilayer coated electrodes opposite a carbon separator (25 µm thick) for a flat plate prismatic design. The active layers are assumed to be deposited on 20 µm metal foil with LiCoO2 as the active cathode (composite contains 90% active with an active capacity = 150 mAh g−1 and density = 2.7 g cm−3) deposited on aluminum and MCMBs as the anode control material (composite contains 90% active with an active capacity = 300 mAh g−1 and density = 1.33 g cm−3) deposited on copper. The thickness of the composite is a critical parameter in such a model and will significantly alter the usable capacity of an electrode. In the present case, composite layers of 100 µm were selected to represent a high energy density design.Fig. 12 illustrates the results from the model for both the specific capacity and volumetric capacity improvements. If the measured free-standing electrode properties are located in the black region with gray lines, then a bilayer electrode using MCMB with PVDF on copper will be superior. Based upon this model, the goal for a free standing electrode is to increase the physical density (g cm−3) as well as achieve a threshold reversible capacity of ∼200 mAh g−1 to exceed state-of-the-art. As a point of comparison, if the active layer thickness was reduced for high power applications (e.g. 25–40 µm), the corresponding threshold capacity would only be ∼150 mAh g−1; representing an even greater potential improvement for free-standing electrodes in the specific capacity for high power designs.
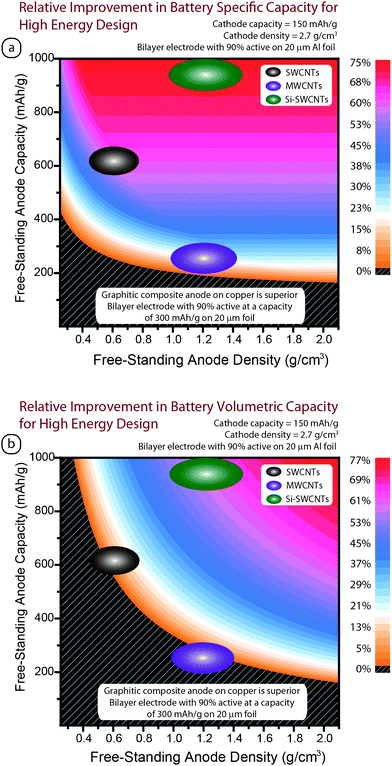 | ||
| Fig. 12 Model of the relative improvement in lithium ion capacity for a battery using a free-standing anode in a flat plate prismatic high energy density design (i.e. composite coatings of 100 μm) with a LiCoO2 cathode for (a) battery specific capacity and (b) battery volumetric capacity. The percent improvement for a given free-standing electrode’s capacity and density is indicated by the color shading except for the black region with gray lines, where a state-of-the-art bilayer electrode using a MCMB composite on copper will be superior. The results for SWCNTs (brown), MWCNTs (purple), and silicon–SWCNTs (green) are indicated by the color-filled ovals. | ||
Application of the results for CNT free-standing electrodes to the model is highlighted in Fig. 12. The MWCNTs provide about 10 to 30% improvement in regards to a high specific energy design. In regards to the SWCNTs, there is about 50 to 60% improvement based on the physical densities of the present electrodes at room temperature. In the case of the silicon–SWCNT anodes, the higher reversible capacity (>1000 mAh g−1) translates into an improvement in the overall specific capacity of the battery by more than 75%. The pure carbon nanotube designs do not provide the same improvement in volumetric capacity (see Fig. 12b) due to the lower densities at present, but the silicon–SWCNT electrodes show at least a 50% improvement. In any case, a dramatic improvement in the specific capacity of present day batteries can be achieved with carbon nanotube electrodes. It is important to note that the current model is evaluating the change in total capacity of the battery with the various electrodes. The real improvement in battery energy density is the product of capacity and average voltage. Thus, the actual battery improvement with free-standing electrodes will be affected by the corresponding voltage profiles for each material type (both anode and cathode) which can modify the discharge curve in a full battery. A series of models using the prevalent cathode chemistries with CNT anodes is currently being developed and will provide a more complete analysis of the potential improvements in lithium ion batteries using free-standing anodes.
3.9 CNT–LiCoO2 batteries
The primary investigation of battery development using carbon nanotubes to date has focused on half-cell testing to determine the lithium ion capacity. Full battery development using CNT free-standing anodes is something that was most recently reported by our group using LiCoO2 and LiNiCoO2 cathodes.97 The most important factor in fabricating full batteries using free-standing CNT electrodes is the first cycle charge loss which complicates capacity matching with cathodes. As observed in the half-cell results for CNTs (Fig. 8 and Fig. 9), there is irreversible capacity due to the SEI formation on the nanotubes that needs to be overcome during the battery charge phase for practical consideration. One approach to overcome the present limitation is to include excess lithium into the cell prior to testing to compensate for charge loss. Such lithiation steps can be accomplished by using excess cathode active material, incorporation of lithium metal within the anode, or through electrochemical lithiation of the anode prior to battery assembly. Recent work has demonstrated the validity of each of these approaches. The excess cathode approach works well at the cell level to assess the fundamental properties of free-standing anode composition or electrolyte effects, but does not lend itself to active area matching for large form factor testing. In comparison, electrochemical pre-lithiation of the CNT anodes to 5 mV (vs. Li/Li+) prior to assembly or introduction of lithium metal within the anode shows more promise to simultaneously address the first cycle loss while advancing CNT-battery development. It is important to note that no major changes in capacity, cyclability, or voltage discharge profile has been observed with any of the lithiation approaches.Fig. 13 highlights the discharge profile for LiCoO2 batteries using free-standing SWCNT and MWCNT electrodes compared to conventional MCMB composite anodes. As a point of comparison, Fig. 13 also displays the effective MCMB anode capacity (red curve) as a function of battery voltage and shows the reduction in usable capacity from conventional anode designs based upon composite electrodes deposited on metal foils. Similar to the half cell discussions, the usable capacity of the MCMB anode is reduced to a maximum of 175 mAh g−1. Such an effect on usable capacity significantly shifts the point of parity with the MWCNT and SWCNT electrodes, and actually shows a crossover with the MWCNT electrode at 2.75 V. The full battery voltage profiles are similar to the half-cell results in that the MCMBs have a relatively constant discharge voltage at 3.7 V for the majority of the capacity compared to the SWCNT electrodes which show a varying profile with discharge capacity. In general, this translates into a higher energy density for the MCMB electrodes since the average voltage is higher. However, the comparison between the MWCNT free-standing electrodes and the usable MCMB anode profiles are quite similar. One of the advantages for CNT electrodes is the ability to be discharged well below conventional limits of 2.5 V. The MCMB/graphite-based batteries are prohibited from cycling to a level like 0.5 V consistently due to oxidation of the copper foil substrate.87 Therefore, the CNT based batteries offer an increased depth of discharge and potential for significant enhancement in usable capacity with improvements to the discharge voltage profile compared to conventional MCMB materials.
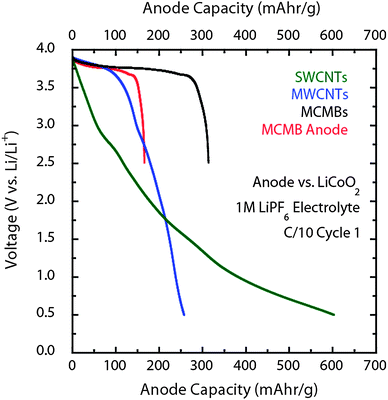 | ||
| Fig. 13 Comparison of the galvanostatic (equivalent C/10) discharge of SWCNT (green curve) and MWCNT (blue curve) paper electrodes with conventional MCMB composites after charging with excess LiCoO2 cathode. The MCMB data for the black curve is the active material whereas the red curve is the effective capacity of the anode which factors in the inactive composite and substrate components. Each of the measurements utilized a 1 M LiPF6 electrolyte with the CNT electrodes using a solvent combination of EC:PC:DEC (1:1:2 v/v) and the MCMBs using EC:DMC (1:2 v/v). | ||
4 Research opportunities
In today's marketplace, the transfer of CNTs from the research laboratories to commercial products is occurring in products ranging from sporting goods to electronic displays. Efforts to scale up CNT manufacturing will assuredly lead to cost reduction, but standards surrounding material quality will be paramount for widespread adoption as a commodity. The ability to fabricate large area (i.e. m2) free-standing SWCNT papers is quickly becoming a commercial reality.108 The prospect of CNTs becoming integral to lithium ion battery technology is expected to occur in the near future as the few technical challenges are overcome to realize the potential of these extraordinary nanomaterials. The use of CNTs as a composite additive should emerge as the first commercial adoption, provided cost metrics can be justified. For example, the current costs for SWCNTs are hundreds of dollars per gram, however, to become cost effective the price will need to approach hundreds of dollars per kilogram. Application of free-standing electrodes to improve the energy density of future batteries will occur when the two largest issues are addressed,109 namely the first cycle charge loss and electrode crystallinity. Both of these material properties may be overcome by increasing the SWCNT bundle diameter which should decrease the mesopore volume as well as increase the electrode crystallinity provided the sidewall interaction is pristine. Other efforts to address the irreversible capacity may include novel electrolyte agents (i.e. modified lithium salts, solvents like ionic liquids, and/or stabilizing additives) that reduce the SEI thickness and charge loss. Introduction of lithium into the electrode prior to battery assembly shows promise to mitigate the first cycle loss and with a minimal cost to the net increase in specific capacity, since lithium has a high intrinsic capacity and low density. Other advancements with CNTs are expected to come from cross-fertilization by research activity on opening the nanotube ends (i.e. “cutting”) and with phase-pure chirality fractions.4.1 Cut CNT batteries
Lithium ion insertion through a CNT sidewall is energetically forbidden,110 but the notion of removing the endcaps or opening up sidewall vacancies to allow for insertion inside the nanotubes has been a consideration for both theoretical and experimental work.49 Based upon density-functional calculations, the inside of a nanotube has local energy minima capable of lithium storage, as well the potential for rapid diffusion along the length of the nanostructure.110 In practice, the ability to access the inside of nanotubes relies upon “cutting” them through selective oxidation conditions, most often in the presence of an oxidizing acid solution and ultrasonication.111 Such an approach has been applied to SWCNTs by Shimoda et al. who claimed to have accessed the lithium ion capacity from interior sites through opened ends and sidewall defects using shortened structures that were 300–500 nm in length.93 The cut SWCNTs exhibited a reversible capacity in excess of 700 mAh g−1, which was a factor of two higher than the purified sample. In addition, their data showed a more favorable voltage profile for the cut SWCNTs during lithium extraction that could potentially increase the energy density in a full battery.Fig. 14 represents a typical microscopy analysis comparing purified SWCNTs to open-ended “cut nanotubes” after using an ultrasonication step in the presence of a 4 : 1 mixture by volume of concentrated H2SO4 : H2O2 for 16 h. The SEM images for purified SWCNTs and cut species are uniquely different after exposure to such conditions. The dramatic abundance of SWCNT ends in Fig. 14b is verification to the efficacy of this procedure. The extent of SWCNT cutting and quantitative distributions on length are typically ascribed from analysis of atomic force micrographs (Fig. 14c and d). In the present example, the purified SWCNTs and cut species show a reduction in length from ∼5 µm to ∼500 nm, respectively. As one may imagine, exposure to harsh acid conditions can lead to modification of the nanotube surface to produce functional groups and defect sites which will affect the electron transport. Such unintended functionalization by the cutting procedure can be monitored using FT-IR spectroscopy,106 but will undoubtedly need to be removed through high temperature annealing or chemical modification to restore a more pristine structure for lithium ion batteries. The anticipated result from concerted activities to study the chemical processing of cut CNTs could lead to internal sites that are extremely stable to lithium ion intercalation and with a more favorable discharge potential.
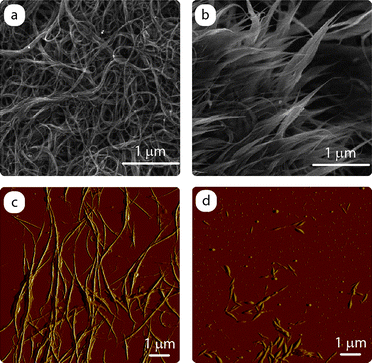 | ||
| Fig. 14 Microscopy analysis comparing purified SWCNTs to open-ended “cut nanotubes”. The SEM images for (a) purified SWCNTs and (b) cut species demonstrate the presence of nanotube tips that are exposed after oxidative ultrasonication conditions. The corresponding atomic force micrographs for the (c) purified SWCNTs and (d) cut species show the reduction in lengths that is kinetically controlled from ∼5 µm to ∼500 nm, respectively. | ||
4.2 SWCNT chirality separations
The effects of purity and chirality distributions are paramount to applications taking full advantage of the remarkable electronic properties of SWCNTs. Previous attempts to separate SWCNT chiralities by electronic type have utilized techniques like electrophoresis and chromatography, but with limited success.112 Recent application of density gradient ultracentrifugation to separate SWCNTs113 by electronic type and chirality has been much more successful and offers an opportunity to expand basic and applied research with individual chiralities. As an example, Fig. 15 provides representative optical absorption spectra for semiconducting and metallic enriched fractions from SWCNTs produced by laser vaporization. The relative change in peak intensity corresponding to the optical transitions unique to semiconducting and metallic chiralities compared to the starting purified material is evidence of the enrichment.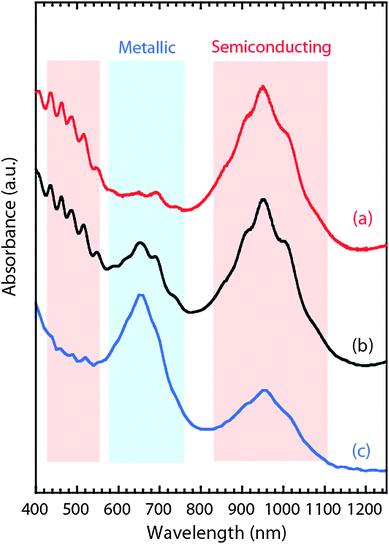 | ||
| Fig. 15 Representative optical absorption overlay for a density gradient separation for the (a) semiconducting enriched fraction, (b) starting purified SWCNTs, and (c) metallic enriched fraction. The relative change in peak intensity corresponding to the optical transitions unique to semiconducting and metallic chiralities compared to the starting purified material is evidence of the enrichment. | ||
In addition to the fundamental characterization benefits of having a well-separated phase-pure SWCNT material, there are potential advantages to lithium ion batteries if sufficient quantities of these materials can be produced. The most obvious impact is expected with regard to the electronic transport of phase pure material when CNTs are used as an additive in the electrode composite. The electrical conduction mechanism has been theoretically predicted to be quite different between metallic and semiconducting SWCNT chiralities.71 Since current SWCNT samples comprise ∼2/3 semiconducting chiralities by concentration, the changes in electrode conductivity for phase pure metallic CNT additives should presumably increase the conductivity at the lowest percolation level.
Phase-pure SWCNT chirality fractions can also provide experimental support to the open question regarding whether there is a fundamental lithium ion capacity dependence from SWCNT properties like diameter, chiral angle, and handedness.114 There have been multiple experimental cases that report selectivity for metallic and semiconducting chiralities using diazonium salts, bile salts, and surfactants.113,115 The expectation that lithium ions will have a preferential interaction with SWCNT chiralities is consistent with the theoretical work published on this idea.116,117 It may also be suggested that variations in the electrochemical stability of the SEI for differing chiralities will parallel any reversible capacity dependence. Thus, advancements in SWCNT separations are highly anticipated to be beneficial for use in lithium ion battery development.
5 Conclusions
The progression of society to rely upon electrical storage for daily communication and sustainable transportation motivates the urgent need to have advanced battery technology. Lithium ion batteries have emerged as a viable candidate due to their higher energy density and cycling performance compared to other rechargeable technologies. At the same time, engineering developments warrant the pursuit of novel nanostructures like CNTs to improve upon the performance of conventional materials. At present, there is a clear advantage for using CNTs in lithium ion batteries as an additive within composite electrodes to increase the reversible capacity, enhance the rate capability, and improve cyclability. In addition, the ability to fabricate free-standing electrodes using CNTs (without binder or metal substrate) represents a novel approach to store lithium intrinsically or as a support for ultra high capacity materials. Innovations to overcome the current challenges of first cycle charge loss and discharge voltage profile with CNT electrodes will result in specific energy density improvements of more than 50% in full battery capacities. Other advancements in battery capacity and rate capability are expected from opening the nanotube ends and separating chiral fractions. Overall, the need to develop advanced batteries will fuel the research on nanoscale materials like CNTs to capitalize on their unique size-dependent properties for significant improvements over state-of-the-art.Acknowledgments
The authors appreciate discussions and experimental assistance from Chris Schauerman and Jack Alvarenga. The authors acknowledge financial support from the US Government, Lockheed Martin, and Greatbatch, Inc.References
- M. Endo, C. Kim, K. Nishimura, T. Fujino and K. Miyashita, Carbon, 2000, 38, 183–197 CrossRef CAS
.
- E. Stura and C. Nicolini, Anal. Chim. Acta, 2006, 568, 57–64 CrossRef CAS
.
- S. Flandrois and B. Simon, Carbon, 1999, 37, 165–180 CrossRef CAS
.
-
A. J. Salkind; A. G. Cannone; F. A. Trumbure, Lead-Acid Batteries, in Handbook of Batteries, ed. Linden, D.; Reddy, T. B., 2002; 3rd edn, pp. 23.1–23.88 Search PubMed
.
- T. Nagaura and K. Tozawa, Prog. Batteries Sol. Cells, 1990, 9, 209 Search PubMed
.
-
G. M. Ehrlich, Lithium-Ion Batteries, in Handbook of Batteries, ed. Linden, D.; Reddy, T. B., 2002; 3rd edn, pp. 35.1–35.94 Search PubMed
.
- J. Yan, B.-J. Xia, Y. C. Su, X.-Z. Zhou, J. Zhang and X.-G. Zhang, Electrochim. Acta, 2008, 53, 7069–7078 CrossRef CAS
.
- D. Aurbach, B. Markovsky, G. Salitra, E. Markevich, Y. Talyossef, M. Koltypin, L. Nazar, B. Ellis and D. Kovacheva, J. Power Sources, 2007, 165, 491–499 CrossRef CAS
.
- D. Aurbach, Y. Talyosef, B. Markovsky, E. Markevich, E. Zinigrad, L. Asraf, J. S. Gnanaraj and H. J. Kim, Electrochim. Acta, 2004, 50, 247–254 CrossRef CAS
.
- J. R. Dahn, Phys. Rev. B, 1991, 44, 9170 CrossRef CAS
.
- A. Satoh, N. Takami and T. Ohsaki, Solid State Ionics, 1995, 80, 291–298 CrossRef CAS
.
- W. F. Howard and R. M. Spotnitz, J. Power Sources, 2007, 165, 887–891 CrossRef CAS
.
- M. S. Whittingham, Chem. Rev., 2004, 104, 4271–4301 CrossRef CAS
.
-
T. B. Reddy; S. Hossain, Rechargeable Lithium Batteries (Ambient Temperature), in Handbook of Batteries, ed. Linden, D.; Reddy, T. B., 2002, 3rd edn, pp. 34.1–34.62 Search PubMed
.
- C. K. Chan, X. F. Zhang and Y. Cui, Nano Lett., 2008, 8, 307–309 CrossRef CAS
.
- P. Meduri, C. Pendyala, V. Kumar, G. U. Sumanasekera and M. K. Sunkara, Nano Lett., 2009, 9, 612–616 CrossRef CAS
.
- C. K. Chan, H. Peng, G. Liu, K. McIlwrath, X. F. Zhang, R. A. Huggins and Y. Cui, Nat. Nanotechnol., 2008, 3, 31–35 Search PubMed
.
- Y. Wang, J. Wang, J. Yang and Y. Nuli, Adv. Funct. Mater., 2006, 16, 2135–2140 CrossRef CAS
.
- Y. P. Wu, E. Rahm and R. Holze, J. Power Sources, 2003, 114, 228–236 CrossRef CAS
.
- S. Hossain, Y. K. Kim, Y. Saleh and R. Loutfy, J. Power Sources, 2003, 114, 264–276 CrossRef CAS
.
- R. P. Raffaelle, B. J. Landi, J. D. Harris, S. G. Bailey and A. F. Hepp, Mater. Sci. Eng., B, 2005, 116, 233–243 CrossRef
.
- H. Dai, Surf. Sci., 2002, 500, 218–241 CrossRef CAS
.
- H. Kataura, Y. Kumazawa, Y. Maniwa, I. Umezu, S. Suzuki, Y. Ohtsuka and Y. Achiba, Synth. Met., 1999, 103, 2555 CrossRef CAS
.
- H. Dai, Surf. Sci., 2002, 500, 218 CrossRef CAS
.
- B. J. Landi, R. P. Raffaelle, M. J. Heben, J. L. Alleman, W. VanDerveer and T. Gennett, Nano Lett., 2002, 2, 1329–1332 CrossRef CAS
.
- D. Chattopadhyay, I. Galeska and F. Papadimitrakopoulos, J. Am. Chem. Soc., 2003, 125, 3370 CrossRef CAS
.
- J. D. Harris, R. P. Raffaelle, T. Gennett, B. J. Landi and A. F. Hepp, Mat. Sci. Eng., B, 2005, 116, 369–374 CrossRef
.
- B. J. Landi, H. J. Ruf, C. M. Evans, C. D. Cress and R. P. Raffaelle, J. Phys. Chem. B, 2005, 109, 9952–9965 CrossRef CAS
.
- B. J. Landi and R. P. Raffaelle, J. Nanosci. Nanotechnol., 2007, 7, 883–890 CrossRef
.
- J. A. Fagan, J. R. Simpson, B. J. Landi, L. J. Richter, I. Mandelbaum, V. Bajpai, D. L. Ho, R. Raffaelle, A. R. Hight Walker, B. J. Bauer and E. K. Hobbie, Phys. Rev. Lett., 2007, 98, 147402 CrossRef CAS
.
- P. Nikolaev, M. J. Bronikowski, R. K. Bradley, F. Rohmund, D. T. Colbert, K. A. Smith and R. E. Smalley, Chem. Phys. Lett., 1999, 313, 91–97 CrossRef CAS
.
- B. Kitiyanan, W. E. Alvarez, J. H. Harwell and D. E. Resasco, Chem. Phys. Lett., 2000, 317, 497–503 CrossRef CAS
.
- J. A. Fagan, M. L. Becker, J. Chun and E. K. Hobbie, Adv. Mater., 2008, 20, 1609–1613 CrossRef CAS
.
- M. J. O'Connell, S. M. Bachilo, C. B. Huffman, V. C. Moore, M. S. Strano, E. H. Haroz, K. L. Rialon, P. J. Boul, W. H. Noon, C. Kittrell, J. Ma, R. H. Hauge, R. B. Weisman and R. E. Smalley, Science, 2002, 297, 593 CrossRef CAS
.
- H.-L. Zhang, C.-H. Sun, F. Li, C. Liu, J. Tan and H.-M. Cheng, J. Phys. Chem. C, 2007, 111, 4740–4748 CrossRef CAS
.
- S. M. Bachilo, M. S. Strano, C. Kittrell, R. H. Hauge, R. E. Smalley and R. B. Weisman, Science, 2002, 298, 2361–2366 CrossRef CAS
.
- J. Giles, Nature, 2004, 432, 791 CrossRef CAS
.
- B. J. Landi, C. D. Cress, C. M. Evans and R. P. Raffaelle, Chem. Mater., 2005, 17, 6819–6834 CrossRef CAS
.
- S. Iijima, Nature, 1991, 354, 56 CrossRef CAS
.
- V. A. Nalimova, D. E. Sklovsky, G. N. Bondarenko, H. Alvergnat-Gaucher, S. Bonnamy and F. Beguin, Synth. Met., 1997, 88, 89–93 CrossRef CAS
.
- G. Che, B. B. Lakshmi, E. R. Fisher and C. R. Martin, Nature, 1998, 393, 346–349 CrossRef CAS
.
- E. Frackowiak, S. Gaurier, H. Gaucher, S. Bonnamy and F. Beguin, Carbon, 1999, 37, 61–69 CrossRef
.
- W. X. Chen, J. Y. Lee and Z. Liu, Carbon, 2003, 41, 959–966 CrossRef CAS
.
- J. Y. Eom, H. S. Kwon, J. Liu and O. Zhou, Carbon, 2004, 42, 2589–2596 CrossRef CAS
.
- E. Frackowiak and F. Beguin, Carbon, 2002, 40, 1775–1787 CrossRef CAS
.
- Z. P. Guo, Z. W. Zhao, H. K. Liu and S. X. Dou, Carbon, 2005, 43, 1392–1399 CrossRef CAS
.
- K. Lin, Y. Xu, G. He and X. Wang, Mater. Chem. Phys., 2006, 99, 190–196 CrossRef CAS
.
- G. Maurin, C. Bousquet, F. Henn, P. Bernier, R. Almairac and B. Simon, Chem. Phys. Lett., 1999, 312, 14–18 CrossRef CAS
.
- G. Maurin and F. Henn, Encycl. Nanosci. Nanotechnol., 2004, 2, 773–792 Search PubMed
.
- G. Maurin, F. Henn, B. Simon, J. F. Colomer and J. B. Nagy, Nano Lett., 2000, 1, 75–79
.
- I. Mukhopadhyay, N. Hoshino, S. Kawasaki, F. Okino, W. K. Hsu and H. Touhara, J. Electrochem. Soc., 2002, 149, A39–A44 CrossRef CAS
.
- H. C. Shin, M. Liu, B. Sadanadan and A. M. Rao, J. Power Sources, 2002, 112, 216–221 CrossRef CAS
.
- S. Yang, H. Song, X. Chen, A. V. Okotrub and L. G. Bulusheva, Electrochim. Acta, 2007, 52, 5286–5293 CrossRef CAS
.
- Z. Yang and H. Wu, Solid State Ionics, 2001, 143, 173–180 CrossRef CAS
.
- Z. H. Yang, Y. H. Zhou, S. B. Sang, Y. Feng and H. Q. Wu, Mater. Chem. Phys., 2005, 89, 295–299 CrossRef CAS
.
- J. Zhao, Q. Y. Gao, C. Gu and Y. Yang, Chem. Phys. Lett., 2002, 358, 77–82 CrossRef CAS
.
- A. Thess, R. Lee, P. Nikolaev, H. Dai, P. Petit, J. Robert, C. Xu, Y. H. Lee, S. G. Kim, A. Rinzler, D. T. Colbert, G. Scuseria, D. Tomanek, J. E. Fischer and R. Smalley, Science, 1996, 273, 483487
.
- P. Dubot and P. Cenedese, Phys. Rev. B, 2001, 63, 241402 CrossRef
.
- C. Garau, A. Frontera, D. Quinonero, A. Costa, P. Ballester and P. M. Deya, Chem. Phys. Lett., 2003, 374, 548–555 CrossRef CAS
.
- C. Garau, A. Frontera, D. Quinonero, A. Costa, P. Ballester and P. M. Deya, Chem. Phys., 2004, 297, 85–91 CrossRef CAS
.
- T. Kar, J. Pattanayak and S. Scheiner, J. Phys. Chem. A, 2001, 105, 10397–10403 CrossRef CAS
.
- Y. Liu, H. Yukawa and M. Morinaga, Commun. Mater. Sci., 2004, 30, 50–56 Search PubMed
.
- V. Meunier, J. Kephart, C. Roland and J. Bernholc, Phys. Rev. Lett., 2002, 88, 075506 CrossRef
.
- K. Nishidate and M. Hasegawa, Phys. Rev. B, 2005, 71, 245418 CrossRef
.
- K. Nishidate, K. Sasaki, Y. Oikawa, M. Baba and M. Hasegawa, J. Surf. Sci. Nanotechnol., 2005, 3, 358–361 Search PubMed
.
- A. Udomvech, T. Kerdcharoen and T. Osotchan, Chem. Phys. Lett., 2005, 406, 161–166 CrossRef CAS
.
- J. Yang, H. J. Liu and C. T. Chan, Phys. Rev. B, 2001, 64, 085420 CrossRef
.
- J. Zhao, A. Buldum, J. Han and J. P. Lu, Phys. Rev. Lett., 2000, 85, 1706 CrossRef CAS
.
- M. Zhao, Y. Xia, X. Liu, T.Z., B. Huang, F. Li, Y. Ji and C. Song, Phys. Lett. A, 2005, 340, 434–439 CrossRef CAS
.
- M. Zhao, Y. Xia and L. Mei, Phys. Rev. B, 2005, 71, 165413 CrossRef
.
- Z. Zhang, J. Peng and H. Zhang, Appl. Phys. Lett., 2001, 79, 3515–3517 CrossRef CAS
.
- B. J. Landi, R. P. Raffaelle, M. J. Heben, J. L. Alleman, W. VanDerveer and T. Gennett, Nano Lett., 2002, 2(11), 1329–1332 CrossRef CAS
.
- X. Li, F. Kang and W. Shen, Carbon, 2006, 44, 1334–1336 CrossRef CAS
.
- W. Guoping, Z. Qingtang, Y. Zuolong and Q. MeiZheng, Solid State Ionics, 2008, 179, 263–268 CrossRef
.
- E. M. Jin, B. Jin, K.-H. Park, H.-B. Gu, G.-C. Park and K.-W. Kim, J. Nanosci. Nanotechnol., 2008, 8, 5057–5061 CrossRef CAS
.
- D.-H. Lee, D.-W. Kim and J.-G. Park, Cryst. Growth Des., 2008, 8, 4506–4510 CrossRef CAS
.
- J.-H. Lee, G.-S. Kim, Y.-M. Choi, W. I. Park, J. A. Rogers and U. Paik, J. Power Sources, 2008, 184, 308–311 CrossRef CAS
.
- X. Li, F. Kang, X. Bai and W. Shen, Electrochem. Commun., 2007, 9, 663–666 CrossRef CAS
.
- X. Li, F. Kang and W. Shen, Electrochem. Solid-State Lett., 2006, 9, A126–A129 CrossRef CAS
.
- C. Sotowa, G. Origi, M. Takeuchi, Y. Nishimura, K. Takeuchi, Y. Jang, Y. J. Kim, T. Hayashi, Y. A. Kim, M. Endo and M. S. Dresselhaus, ChemSusChem, 2008, 1, 911–915 CrossRef CAS
.
- K. Sheem, Y. H. Lee and H. S. Lim, J. Power Sources, 2006, 158, 1425–1430 CrossRef CAS
.
- J. Huang and Z. Jiang, Electrochim. Acta, 2008, 53, 7756–7759 CrossRef CAS
.
- B. Jin, E. M. Jin, K.-H. Park and H.-B. Gu, Electrochem. Commun., 2008, 10, 1537–1540 CrossRef CAS
.
- S. Berber, Y.-K. Kwon and D. Tomanek, Phys. Rev. Lett., 2000, 84(20), 4613–4616 CrossRef CAS
.
- X. Zhang, T. V. Sreekumar, T. Liu and S. Kumar, J. Phys. Chem. B, 2004, 108, 16435–16440 CrossRef CAS
.
- A. B. Kaiser, V. Skakalova and S. Roth, Physica E, 2008, 40, 2311–2318 CrossRef CAS
.
- S. Hossain, Y. Saleh and R. Loutfy, J. Power Sources, 2001, 96, 5–13 CrossRef CAS
.
- A. S. Claye, J. E. Fischer, C. B. Huffman, A. G. Rinzler and R. E. Smalley, J. Electrochem. Soc., 2000, 147, 2845–2852 CrossRef CAS
.
- I. Mukhopadhyay, S. Kawasaki, F. Okino, A. Govindaraj, C. N. R. Rao and H. Touhara, Physica B, 2002, 323, 130–132 CrossRef CAS
.
- S. H. Ng, J. Wang, Z. P. Guo, J. Chen, G. X. Wang and H. K. Liu, Electrochim. Acta, 2005, 51, 23–28 CrossRef CAS
.
- B. Gao, A. Kleinhammes, X. P. Tang, C. Bower, L. Fleming, Y. Wu and O. Zhou, Chem. Phys. Lett., 1999, 307, 153–157 CrossRef CAS
.
- B. Gao, H. Shimoda, X. P. Tang, A. Kleinhammes, L. Fleming, Y. Wu and O. Zhou, AIP Conf. Proc., 2001, 590, 95–99 Search PubMed
.
- H. Shimoda, B. Gao, X. P. Tang, A. Kleinhammes, L. Fleming, Y. Wu and O. Zhou, Phys. Rev. Lett., 2002, 88, 015502 CAS
.
- J. Y. Eom and H. S. Kwon, J. Mater. Res., 2008, 23, 2458–2466 CrossRef CAS
.
- S.-K. Jeong, M. Inaba, R. Mogi, Y. Iriyama, T. Abe and Z. Ogumi, Langmuir, 2001, 17, 8281–8286 CrossRef CAS
.
- B. J. Landi, M. J. Ganter, C. M. Schauerman, C. D. Cress and R. P. Raffaelle, J. Phys. Chem. C, 2008, 112, 7509 CrossRef CAS
.
-
B. J. Landi; M. J. Ganter; C. M. Schauerman; R. A. DiLeo; C. D. Cress; R. P. Raffaelle, Single Wall Carbon Nanotube-LiCoO2 Lithium Ion Batteries, in Mobile Energy, Amaratunga, G.; Nathan, A.; Nookala, M.; Smart, M. C., Eds. Mater. Res. Soc. Symp. Proc., 2009, vol. 1127E, pp. 1127-T03-06 Search PubMed
.
- R. A. DiLeo, B. J. Landi and R. P. Raffaelle, J. Appl. Phys., 2007, 101, 0643071–0643075
.
- B. J. Landi, R. A. DiLeo, C. M. Schauerman, C. D. Cress, M. J. Ganter and R. P. Raffaelle, J. Nanosci. Nanotechnol., 2009, 9, 3406–3410
.
- J. Y. Eom, J.-W. Park, H. S. Kwon and S. Rajendran, J. Electrochem. Soc., 2006, 153, A1678–A1684 CrossRef CAS
.
- T. Kim, Y. H. Mo, K. S. Nahm and S. M. Oh, J. Power Sources, 2006, 162, 1275–1281 CrossRef CAS
.
- Y. Zhang, X. G. Zhang, H. L. Zhang, Z. G. Zhao, F. Li, C. Liu and H.-M. Cheng, Electrochim. Acta, 2006, 51, 4994–5000 CrossRef CAS
.
- Y.-J. Chen, C.-L. Zhu, X.-Y. Xue, X.-L. Shi and M.-S. Cao, Appl. Phys. Lett., 2008, 92, 223101 CrossRef
.
- G. Chen, Z. Wang and D. Xia, Chem. Mater., 2008, 20, 6951–6956 CrossRef CAS
.
- M.-S. Park, S. A. Needham, G. X. Wang, Y.-M. Kang, J.-S. Park, S. X. Dou and H.-K. Liu, Chem. Mater., 2007, 19, 2406–2410 CrossRef CAS
.
- B. J. Landi, S. L. Castro, H. J. Ruf, C. M. Evans, S. G. Bailey and R. P. Raffaelle, Sol. Energy. Mater. Sol. Cells, 2005, 87, 733–746 CrossRef CAS
.
- B. J. Landi, C. M. Evans, J. J. Worman, S. L. Castro, S. G. Bailey and R. P. Raffaelle, Mater. Lett., 2006, 60, 3502–3506 CrossRef CAS
.
-
Nanocomp Technologies Manufactures First Ready-to-Use Carbon Nanotube Textile, Sets Stage for Commerical Production, in Business Wire, May 14, 2007 Search PubMed
.
-
A. M. Skundin, The problem of carbon nanotubes using in lithium-ion batteries, in Carbon Nanomaterials in Clean Energy Hydrogen Systems, ed. Baranowski, B., 2008, pp. 285–290 Search PubMed
.
- M. Kantha, N. A. Cordero, J. A. Alonso, M. Cawkwell and L. A. Girifalco, Phys. Rev. B, 2008, 78, 115430 CrossRef
.
- J. Liu, A. G. Rinzler, H. Dai, J. H. Hafner, R. K. Bradley, P. J. Boul, L.A., T. Iverson, K. Shelimov, C. B. Huffman, F. Rodriguez-Macias, Y. S. Shon, T. R. Lee, D. T. Colbert and R. E. Smalley, Science, 1998, 280, 1253–1256 CrossRef CAS
.
- R. Krupke, F. Hennrich, H. V. Lohneysen and M. M. Kappes, Science, 2003, 301, 344–347 CrossRef CAS
.
- M. S. Arnold, A. A. Green, J. F. Hulvat, S. I. Stupp and M. C. Hersam, Nat. Nanotechnol., 2006, 1, 60–65 Search PubMed
.
- A. Green, M. Duch and M. Hersam, Nano Res., 2009, 2, 69–77 Search PubMed
.
- M. S. Strano, C. A. Dyke, M. L. Usrey, P. W. Barone, M. J. Allen, H. Shan, C. Kittrell, R. H. Hauge, J. M. Tour and R. E. Smalley, Science, 2003, 301, 1519–1522 CrossRef CAS
.
- A. Udomvech and T. Kerdcharoen, J. Korean Phys. Soc., 2008, 52, 1350–1354 Search PubMed
.
- J. Li, H. Li, X. Liang, S. Zhang, T. Zhao, D. Xia and Z. Wu, J. Phys. Chem. A, 2009, 113, 791–796 CrossRef CAS
.
Footnote |
| † Present address: U.S. Naval Research Laboratory, Washington, D.C. 20375, USA. |
| This journal is © The Royal Society of Chemistry 2009 |
