Electronic transitions in the IR: Matrix isolation spectroscopy and electronic structure theory calculations on polyacenes and dibenzopolyacenes
Jennifer L.
Weisman†
a,
Andrew
Mattioda
bc,
Timothy J.
Lee‡
b,
Doug M.
Hudgins
b,
Lou J.
Allamandola
b,
Charles W.
Bauschlicher Jr.§
b and
Martin
Head-Gordon
*a
aDepartment of Chemistry, University of California and Chemical Sciences Division, Lawrence Berkeley National Laboratory Berkeley, Berkeley, CA 94720, USA. E-mail: mhg@cchem.berkeley.edu; Fax: +1 510 643 1255
bNASA Ames Research Center, Mail Stop 245-6, Moffett Field, CA 94035, USA
cSETI Institute, 515 N. Whisman, Mountain View, CA 94043, USA
First published on 3rd December 2004
Abstract
We present the argon matrix isolated and theoretical spectra of the dibenzo[fg,op]tetracene, dibenzo[hi,uv]hexacene and dibenzo[jk,a1b1]octacene ions. Low-lying electronic absorptions are observed experimentally with significant intensity in the radical anion species. These electronic features in the IR region are confirmed with time dependent density functional theory calculations. We investigate the origin of these IR electronic transitions with orbital mixing considerations.
1. Introduction
Throughout the galaxy, ultraviolet (UV)-rich regions associated with dust and gas show a strong infrared spectrum dominated by bands near 3050, 1600, 1300 and 900 cm−1 (0.3, 0.6, 0.8, 1.1 μm, respectively) (for example, see ref. 1). Over a decade of experimental and theoretical work designed to mimic the salient interstellar conditions showed that these ‘unidentified infrared bands’ (UIRs) likely originate in mixtures of highly vibrationally excited polycyclic aromatic hydrocarbons (PAHs) and related materials (see refs. 2–4). Most of this vibrational excitation is driven by the absorption of significantly higher energy photons which promote the PAH to a higher electronic state followed by rapid intramolecular vibrational relaxation (IVR) to the ground state. Due to the UV-rich radiation environment of most regions studied to date, the emission is dominated by ionized PAHs. Thanks to the ubiquity of these interstellar features and their source to source variations, PAHs are now being used as probes of many different interstellar objects and environments.5,6Given their widespread distribution and high abundance, it is now apparent that interstellar PAHs play important roles in many processes. For example, they are crucial to the conversion of higher energy optical photons into infrared photons. The observation that approximately 30% of the total IR radiation from these objects is emitted in these features implies that PAHs play a critical role in determining the radiation balance in these objects. However, there are observational uncertainties associated with the wavelength regions which pump the IR emission7–9 and a full understanding of the radiation balance in these objects requires detailed knowledge of PAH ion electronic absorption properties. In addition, these electronic transitions are expected to imprint their spectroscopic signatures in low-density, translucent regions.
To gain the deeper understanding of PAH electronic properties needed to address these issues, we have investigated various classes of PAHs, including oligorylenes, pericondensed PAHs and closed shell PAH cations.10–12 Additionally, the near infrared electronic spectra of about 27 PAH ions have been measured to address the questions associated with pumping the interstellar emission as well as to predict the type of structure these transitions could impart onto the unexplored portions of the interstellar extinction curve.13 Not unexpectedly, we have found that the electronic transitions span the entire near-IR region, shifting to lower and lower energies with increasing size. In the course of these studies, we have found an interesting class of PAHs which have electronic transitions that fall in the mid-IR region. For these molecules, the electronic absorptions are far more intense than those transitions associated with the vibrational bands, completely changing the character of the PAH mid-IR spectrum.
We consider a subset of these molecules here. The argon matrix isolated and theoretical spectra of dibenzo[fg,op]tetracene, dibenzo[hi,uv]hexacene and dibenzo[jk,a1b1]octacene (referred to here for simplicity as dibenzotetracene, dibenzohexacene and dibenzooctacene, respectively) are presented. Theoretical calculations using time-dependent density functional theory (TDDFT)14–16 support the attribution of these absorptions to low lying electronic transitions which fall in the mid-IR region. We also investigate the spectra of smaller analogs of these species and identify the origin of these low lying transitions.
2. Experimental methods
The matrix isolation IR spectroscopy techniques employed in these studies have been described in detail elsewhere17,18 and will be summarized only briefly here. Matrix isolated polyacene samples were prepared by vapor co-deposition of the species of interest with an overabundance of argon onto a 14K CsI window suspended in a high-vacuum chamber (p < 10−7 Torr). The samples were vaporized from heated Pyrex tubes while argon was admitted through an adjacent length of N2(l)-trapped copper tubing. The conditions were optimized to produce an Ar/polyacene ratio in excess of 1000 : 1. Once an appropriate amount of material was accumlated, an IR spectrum of the sample was recorded.Cation and anion molecular species were generated in situ. Vacuum UV photolysis of the PAH/Ar matrix was accomplished with the combined 120 nm Lyman α/160 nm very broad molecular hydrogen emission bands (10.1 and 7.77 eV, respectively) from a microwave-powered flowing H2 discharge lamp at a dynamic pressure of 150 mTorr. Assuming that all neutral PAHs which disappear are converted into ions, an upper limit to the ionization efficiency can be obtained by measuring the percent decrease in the neutral band integrated areas which accompany photolysis. In the Argon matrix experiments, ionization results in the formation of both cations and anions. Thus for every two neutral PAHs lost, we assume one cation and one anion are produced. Once the Argon matrix data has been collected, a second matrix isolation experiment, using an Ar/NO2 matrix gas, is conducted. The presence of NO2, an electron acceptor, in the matrix (at a concentration of approximately 1 part in 1000) in a typical experiment ensures that the newly formed PAH bands all originate from the cation. By subtracting the Ar/NO2 spectrum from the Ar spectrum, the anion bands are revealed. In a typical experiment approximately 10% of the PAH molecules are ionized upon photolysis.
Experimental samples were obtained from the Institute for PAH Research, Greifenberg, Germany. All samples were of 99% or greater purity.
Spectra were recorded on a Bio-Rad/Digilab Excalibur FTS-4000 IR spectrometer. Each spectrum represents a co-addition of 500 scans at a resolution of 0.5 cm−1. Reported spectra have been baseline corrected with several bands resulting from impurities (such as water, NO2 and accompanying photo-products) either subtracted or truncated using the Win-IR Pro 3.4 Software package. All numerical values cited in this paper are based on the band integrations of unaltered data.
Integrated intensities (∫τdν) for the bands were determined using the Win-IR Pro 3.4 (DigiLab) software package. Absolute intensities (A ≡ (1/N)∫ τ dν) where N is the column density of absorbers in molecules cm−2) for the experimentally measured neutral PAHs were determined using the theoretical values as follows. The integrated intensities for all bands between 1600 and 500 cm−1 (0.6 and 2.0 μm, respectively) were summed to obtain the total absorption intensity over this region. This range was chosen to exclude the contributions of the far-IR bands (ν < 500 cm−1) that were not measured in the experiments and those of the CH stretching bands which blend with overtone/combination bands in the experimental data and whose intensities are substantially overestimated by quantum calculations.3,18 These areas were put on an absolute footing using theoretically calculated absolute band intensities as described by Hudgins and Sandford.18 As with the experimental data, the intensities of all theoretically determined bands were summed between 1600 and 500 cm−1. The total theoretically calculated intensity was then distributed over experimental bands on the basis of the fractional contribution of each to the total 1600 and 500 cm−1 absorption in the experimental spectrum.
 | (1) |
3. Electronic structure methods
Unless indicated otherwise, all calculations were performed with the Q-Chem quantum chemistry program package19 on IBM RS/6000 workstations. The following species were investigated: octacene (C34H20), hexacene (C26H16), tetracene (C18H12) and naphthalene (C10H8), and their so-called ‘dibenzo’-counterparts dibenzooctacene (C40H22), dibenzohexacene (C32H18), dibenzotetracene (C24H14) and dibenzonaphthalene (C16H10, more commonly known as pyrene). Fig. 1 shows the structures and orientations of these eight species. The structures are oriented in the xy-plane with molecular backbone growth occurring along the x-axis. All of the species have D2h molecular symmetry. All ground state geometries were optimized using density functional theory with Becke exchange20 and LYP correlation,21 and the 6-31G* basis set. The geometries were confirmed to be minima by calculation of the Hessian matrix. | ||
| Fig. 1 Oriented structures of the polyacenes and dibenzopolyacenes: (a) naphthalene, (b) dibenzonaphthalene, (c) tetracene, (d) dibenzotetracene, (e) hexacene, (f) dibenzohexacene, (g) octacene and (h) dibenzooctacene. | ||
The vertical excitation energies and oscillator strengths were determined using time dependent density functional theory (TDDFT) at the BLYP/6-31G* level. Previous studies have established the relatively small basis-set dependence of TDDFT excitation energies for PAHs, even PAH anions (for example, see ref. 10). The vibrational frequencies were determined at the BLYP/6-31G//BLYP/6-31G level.
4. Results and discussion
The argon matrix isolated IR spectra of dibenzotetracene, C24H14, dibenzohexacene, C32H18 and dibenzooctacene, C40H22 are shown in Figs. 2–4. The reported spectra correspond to an identical number of molecular species (molecules, cations, anions) to permit direct comparison of band strengths. A comparison of the band intensities of the current spectra with the intensities of previously studied PAH compounds (both theoretical and neutral) is presented in Table 1. In general, neutral PAH molecules exhibit their most intense vibrational modes in the C–H out-of-plane (CHoop) bending region (500–1000 cm−1) when compared with the C–C and C–H in-plane modes (1000–1600 cm−1). Upon ionization this trend is reversed, with the in-plane C–C and C–H modes exhibiting 10 times the intensity of the CHoop region. Several comments should be made regarding the values listed in Table 1. The values listed in the top three rows were obtained by averaging results (both theoretical and experimental) of 33 previously studied PAHs ranging in size from C16H10 to C50H22. While this represents a considerable sample, given the enormity of possible PAH structures these results should be considered only as a starting point for PAH species, which can individually deviate somewhat from this “average” behavior. | ||
| Fig. 2 Argon matrix isolated mid-IR spectra of the neutral, cation and anion dibenzotetracene molecular species. Bands resulting from CO2, H2O, CO, and NO2 impurities are denoted by an *. Spectra have been normalized to the same number of species and are offset to allow comparison. The scale bar represents 0.01 absorbance units. Theoretical spectra for the anion and cation are the result of BP86 calculations, whereas the theoretical spectrum for the neutral molecule is based on B3LYP calculations. See text for details. | ||
 | ||
| Fig. 3 Argon matrix isolated mid-IR spectra of the neutral, cation and anion dibenzohexacene molecular species. Bands resulting from CO2, H2O, CO and NO2 impurities are denoted by an *. Spectra have been normalized to the same number of species and are offset to allow comparison. The scale bar represents 0.1 absorbance units. Theoretical spectra for the anion and cation are the result of BP86 calculations, whereas the theoretical spectrum for the neutral molecule is based on B3LYP calculations. See text for details. | ||
 | ||
| Fig. 4 Argon matrix isolated mid-IR spectra of the neutral, cation and anion dibenzooctacene molecular species. Bands resulting from CO2, H2O, CO and NO2 impurities are denoted by an *. Spectra have been normalized to the same number of species and are offset to allow comparison. The scale bar represents 0.1 absorbance units. Theoretical spectra for the anion and cation are the result of BP86 calculations, whereas the theoretical spectrum for the neutral molecule is based on B3LYP calculations. See text for details. | ||
| Molecule | I(500–1000 cm−1)/km mol−1 | I(1000–1600 cm−1)/km mol−1 | I(1000–1600 cm−1)/I(500–1000 cm−1) |
|---|---|---|---|
| a PAHs (average), PAH cations (average), and PAH anions (average) values were obtained by averaging data from 33 PAH molecules. Data were obtained from both experimental and theoretical sources. | |||
| PAHs (average) | 262 | 180 | 0.69 |
| PAH cations (average) | 232 | 2298 | 9.90 |
| PAH anions (average) | 494 | 5157 | 10.44 |
| Dibenzotetracene | 173 | 185 | 1.07 |
| Dibenzotetracene cation | 426 | 1793 | 4.21 |
| Dibenzotetracene anion | 740 | 2299 | 3.11 |
| Dibenzohexacene | 249 | 268 | 1.08 |
| Dibenzohexacene cation | 35 439 | 9863 | 0.28 |
| Dibenzohexacene anion | 100 542 | 23 080 | 0.23 |
| Dibenzooctacene | 342 | 321 | 0.94 |
| Dibenzooctacene cation | 3282 | 966 | 0.29 |
| Dibenzooctacene anion | 134 368 | 24 843 | 0.18 |
In going through the series, dibenzotetracene, dibenzohexacene to dibenzooctacene, the mid-IR spectra transform from that of a “normal” PAH to one having a very unusual mid-IR spectrum. This can be seen in Figs. 2–4, where the argon matrix isolated IR spectra of dibenzotetracene, dibenzohexacene and dibenzooctacene are contrasted against theoretical IR spectra of these species. A substantial body of work has been published on the theoretical calculation of PAH IR spectra (for example, see ref. 3). The theoretical spectra presented in Figs. 2–4 have been calculated in accordance with previously established levels of theory using the Gaussian98 program package.22 The spectra for the neutral PAH molecules were determined at the B3LYP/4-31G level of theory23 with a 0.958 scale factor. Due to symmetry breaking encountered with the B3LYP functional, the anion and cation computed harmonic frequencies were determined at the BP86/4-31G level of theory20,24 with a 0.986 scale factor.
As revealed in Fig. 2 and Table 1, neutral dibenzotetracene displays behavior consistent with the previously investigated PAHs. Although the C–C,C–H/CHoop ratio (1.07) is slightly higher than the PAH average (0.687), it is consistent with that experimentally observed in dibenzoheptacene (1.07) and dibenzooctacene (0.94) (see Table 1). Likewise, as the spectra in Fig. 2 reveal, the experimental results are in reasonably good agreement with theoretical values in both frequencies and relative intensities. However, agreement is not uniformly good across the board. There is significant discrepancy between theoretical and experimental band intensities around 1500 cm−1 (0.7 μm) for the cation and 1500 and 900 cm−1 for the anion.
The difference between the calculated vibrational spectrum of the ions and experimental spectra are much greater for dibenzohexacene. The neutral spectra of dibenzohexacene in Fig. 3, as well as the C–C, C–H/CHoop ratio in Table 1, shows that this neutral PAH displays behavior similar to that of other PAHs. However, the similarities end upon ionization. Fig. 3 shows that the experimental spectra of both the anion and cation do not resemble the theoretically determined vibrational spectra. The anion spectrum of dibenzohexacene is dominated by a large complex of bands centered around 880 cm−1 (1.1 μm). The presence of the most intense ion feature in the CHoop bending region is unusual in and of itself. However, the exceptionally strong intensity of this feature for a mid-IR band, an astounding 160 times that of the most intense anion band in dibenzotetracene, makes this feature all the more remarkable. This unusual behavior is also revealed by the 1000–1600 cm−1/500–1000 cm−1 ratio given in Table 1. Whereas most PAHs tend to show a tenfold intensity increase in the overall intensity of the 1000–1600 cm−1 region over that of the 500–1000 cm−1 region upon ionization, dibenzohexacene exhibits a ratio five times lower than that observed in the neutral molecule (50 times lower than the average ionized PAH)! Furthermore, one can easily discern band structure with significant integrated absorbance areas extending out to 4500 cm−1 (0.2 μm), in the anion spectrum of dibenzohexacene. This is inconsistent with the features typically observed in the mid-IR vibrational spectrum of an ionized PAH, whose ion features, with the possible exception of weak C–H stretches, do not extend past 2000 cm−1 (0.5 μm). The experimental results for the cation are just as unusual, although the intensities are somewhat lower than those observed in the anion. Although the vibrational calculations indicate the most intense features for the cation should be in the C–C, C–H in-plane region (1000–1600 cm−1), the cation spectrum in Fig. 3 and the C–C, C–H/CHoop ratio in Table 1 shows the strongest absorbance falls below 1000 cm−1 (1.0 μm). Lastly, as was evident in the anion spectrum, the cation spectrum displays band structure past the typical 2000 cm−1 mark, although it does not extend out as far as the structure in the anion spectrum.
Fig. 4 and Table 1 display the results for dibenzooctacene. As witnessed in the previous two molecules, the experimental spectrum for neutral dibenzooctacene is in good agreement with both theory and previous PAH investigations. However, the ionization results, especially those of the anion, are more in line with those of dibenzohexacene. Although the overall integrated intensity of the most prominent anion band structure (96 680 km mol−1) in dibenzooctacene is extremely close to that exhibited by the 880 cm−1 (1.1 μm) anion band in dibenzohexacene (93 771 km mol−1), the center has shifted down to 720 cm−1 (1.4 μm). This band is more than 41 times that of the most intense theoretical anion vibrational band, predicted to be centered around 1364 cm−1 (0.7 μm). As with the dibenzohexacene anion (Fig. 3), the dibenzooctacene anion exhibits similar extended band structure, but only out to 3100 cm−1 (0.3 μm). Although the spectrum of dibenzooctacene cation contains bands at positions similar to those observed in the cation spectrum of dibenzohexacene (Fig. 3), the dibenzooctacene cation bands are markedly weaker. However, just as with the dibenzohexacene cation spectrum, the most intense bands in the IR spectrum of the dibenzooctacene cation are in the CHoop bending region (500–1000 cm−1). Although the IR spectra of ionized dibenzohexacene and dibenzooctacene are extremely different from that of an average PAH, the spectra of both molecules exhibit very similar behavior upon ionization. The 1000–1600 cm−1/500–1000 cm−1 ratios for these two molecules are almost identical, for both the cation and anion species, but extremely different than those of the average PAH.
The exceptional mid-IR spectral behavior of dibenzohexacene and dibenzooctacene in both band positions and intrinsic intensities upon in situ photolysis (see Figs. 3 and 4) do not correspond to the behavior of PAH fundamental vibrational modes. Given that the lowest energy electronic transition in many ionized PAHs studied to-date fall in the near IR (NIR)13 and that the greater the number of conjugated multiple bonds in a compound (length of fused rings), the longer the wavelength of the light that the compound will absorb, we attribute the unusual features present in the mid-IR spectra of these long conjugated systems to electronic transitions.
In order to investigate the possibility of electronic excitations in the IR for these species, we have performed time-dependent density functional theory calculations on the neutral, cation and anion species of dibenzooctacene, dibenzohexacene and dibenzotetracene. In addition, we have investigated dibenzonaphthalene (pyrene), and the polyacene analogs of each of these molecules.
Tables 2–5 show several of the lowest lying calculated dipole-allowed electronic transitions for octacene and dibenzooctacene, hexacene and dibenzohexacene, tetracene and dibenzotetracene and naphthalene and dibenzonaphthalene, respectively.
| Octacene | Dibenzooctacene | ||||
|---|---|---|---|---|---|
| Transitiona | Symb | Exc. energyc | Transitiona | Symb | Exc. energyc |
| a States involved in the electronic transition. b Transition symmetry. c Excitation energies of BLYP/6-31G*//BLYP/6-31G* dipole-allowed transitions are shown in eV, oscillator strengths shown in parentheses. | |||||
| Neutral | |||||
| 1Ag → 1B2u | B2u | 0.6812 (0.0078) | 1Ag → 1B2u | B2u | 1.8951 (0.0024) |
| 1Ag → 1B2u | B2u | 1.9290 (0.0007) | 1Ag → 1B2u | B2u | 2.3280 (0.0322) |
| 1Ag → 1B2u | B2u | 2.1478 (0.0249) | 1Ag → 1B3u | B3u | 2.5321 (0.0192) |
| 1Ag → 1B2u | B2u | 2.4410 (0.0077) | 1Ag → 1B3u | B3u | 2.7811 (0.5961) |
| Radical anion | |||||
| 2B2g → 2Au | B2u | 0.3465 (0.0026) | 2B2g → 2B1u | B3u | 0.2827 (0.0479) |
| 2B2g → 2B1u | B3u | 1.0933 (0.4133) | 2B2g → 2Au | B2u | 0.8681 (0.0079) |
| 2B2g → 2Au | B2u | 1.6140 (0.0000) | 2B2g → 2B1u | B3u | 1.3306 (0.1756) |
| 2B2g → 2Au | B2u | 1.7096 (0.0001) | 2B2g → 2Au | B2u | 1.5274 (0.0000) |
| Radical cation | |||||
| 2Au → 2B2g | B2u | 0.3832 (0.0026) | 2B3g → 2Au | B3u | 0.1542 (0.0151) |
| 2Au → 2B3g | B3u | 1.0162 (0.3643) | 2B3g → 2Au | B3u | 1.4500 (0.0100) |
| 2Au → 2B2g | B2u | 1.5020 (0.0000) | 2B3g → 2Au | B3u | 1.4532 (0.1839) |
| 2Au → 2B2g | B2u | 1.6846 (0.0000) | 2B3g → 2B1u | B2u | 1.5264 (0.0009) |
| Hexacene | Dibenzohexacene | ||||
|---|---|---|---|---|---|
| Transitiona | Symb | Exc. energyc | Transitiona | Symb | Exc. energyc |
| a States involved in the electronic transition. b Transition symmetry. c Excitation energies of BLYP/6-31G*//BLYP/6-31G* dipole-allowed transitions are shown in eV, oscillator strengths shown in parentheses. | |||||
| Neutral | |||||
| 1Ag → 1B2u | B2u | 1.2205 (0.0170) | 1Ag → 1B2u | B2u | 2.6644 (0.0034) |
| 1Ag → 1B3u | B3u | 2.7178 (0.0176) | 1Ag → 1B3u | B3u | 2.8731 (0.0013) |
| 1Ag → 1B2u | B2u | 2.7421 (0.0007) | 1Ag → 1B2u | B2u | 3.0537 (0.0237) |
| 1Ag → 1B2u | B2u | 3.0571 (0.0291) | 1Ag → 1B3u | B3u | 3.1622 (0.4044) |
| Radical anion | |||||
| 2B2g → 2Au | B2u | 0.7788 (0.0060) | 2B2g → 2B1u | B3u | 0.3407 (0.0302) |
| 2B2g → 2B1u | B3u | 1.3577 (0.2608) | 2B2g → 2Au | B2u | 0.4890 (0.0049) |
| 2B2g → 2Au | B2u | 2.4087 (0.0001) | 2B2g → 2B1u | B3u | 1.2690 (0.1460) |
| 2B2g → 2B1u | B3u | 2.5319 (0.0322) | 2B2g → 2Au | B2u | 2.1654 (0.0078) |
| Radical cation | |||||
| 2Au → 2B2g | B2u | 0.8286 (0.0058) | 2B3g → 2Au | B3u | 0.2609 (0.0288) |
| 2Au → 2B3g | B3u | 1.2487 (0.2295) | 2B3g → 2B1u | B2u | 1.1761 (0.0000) |
| 2Au → 2B2g | B2u | 2.2535 (0.0003) | 2B3g → 2Au | B3u | 1.6973 (0.1188) |
| 2Au → 2B3g | B3u | 2.3886 (0.0423) | 2B3g → 2B1u | B2u | 2.1979 (0.0003) |
| Tetracene | Dibenzotetracene | ||||
|---|---|---|---|---|---|
| Transitiona | Symb | Exc. energyc | Transitiona | Symb | Exc. energyc |
| a States involved in the electronic transition. b Transition symmetry. c Excitation energies of BLYP/6-31G*//BLYP/6-31G* dipole-allowed transitions are shown in eV, oscillator strengths shown in parentheses. | |||||
| Neutral | |||||
| 1Ag → 1B2u | B2u | 2.1427 (0.0340) | 1Ag → 1B3u | B3u | 3.2496 (0.0013) |
| 1Ag → 1B3u | B3u | 3.1808 (0.0043) | 1Ag → 1B2u | B2u | 3.3234 (0.0548) |
| 1Ag → 1B2u | B2u | 3.9989 (0.0003) | 1Ag → 1B3u | B3u | 3.6823 (0.2611) |
| 1Ag → 1B3u | B3u | 4.3862 (2.2429) | 1Ag → 1B2u | B2u | 3.9809 (0.1431) |
| Radical anion | |||||
| 2B2g → 2Au | B2u | 1.5319 (0.0106) | 2Au → 2B2g | B2u | 0.4689 (0.0060) |
| 2B2g → 2B1u | B3u | 1.7449 (0.1407) | 2Au → 2B3g | B3u | 1.1838 (0.0800) |
| 2B2g → 2B1u | B3u | 2.9238 (0.0180) | 2Au → 2B3g | B3u | 2.5584 (0.0166) |
| 2B2g → 2Au | B2u | 3.0213 (0.0264) | 2Au → 2B2g | B2u | 2.5826 (0.0001) |
| Radical cation | |||||
| 2Au → 2B2g | B2u | 1.5915 (0.0082) | 2B2g → 2Au | B2u | 0.6595 (0.0072) |
| 2Au → 2B3g | B3u | 1.5951 (0.1314) | 2B2g → 2B1u | B3u | 1.2701 (0.0898) |
| 2Au → 2B2g | B2u | 2.6825 (0.0300) | 2B2g → 2B1u | B3u | 2.2573 (0.0178) |
| 2Au → 2B3g | B3u | 2.8169 (0.0236) | 2B2g → 2Au | B2u | 2.3319 (0.0086) |
| Naphthalene | Dibenzonaphthalene | ||||
|---|---|---|---|---|---|
| Transitiona | Symb | Exc. energyc | Transitiona | Symb | Exc. energyc |
| a States involved in the electronic transition. b Transition symmetry. c Excitation energies of BLYP/6-31G*//BLYP/6-31G* dipole-allowed transitions are shown in eV, oscillator strengths shown in parentheses. | |||||
| Neutral | |||||
| 1Ag → 1B2u | B2u | 4.0722 (0.0453) | 1Ag → 1B2u | B2u | 3.3637 (0.2063) |
| 1Ag → 1B3u | B3u | 4.1986 (0.0002) | 1Ag → 1B3u | B3u | 3.4441 (0.0000) |
| 1Ag → 1B2u | B2u | 5.8014 (1.1159) | 1Ag → 1B3u | B3u | 4.1870 (0.1819) |
| 1Ag → 1B3u | B3u | 5.8954 (0.1403) | 1Ag → 1B2u | B2u | 5.0574 (0.0001) |
| Radical anion | |||||
| 2B2g → 2B1u | B3u | 2.1990 (0.0464) | 2Au → 2B3g | B3u | 1.5008 (0.0154) |
| 2B2g → 2Au | B2u | 2.9967 (0.1631) | 2Au → 2B2g | B2u | 2.0439 (0.0033) |
| 2B2g → 2B3u | B1u | 3.3264 (0.0000) | 2Au → 2B3g | B3u | 2.7559 (0.0063) |
| 2B2g → 2Au | B2u | 3.6483 (0.0536) | 2Au → 2B2g | B2u | 2.8639 (0.2356) |
| Radical cation | |||||
| 2Au → 2B3g | B3u | 2.1161 (0.0427) | 2B2g → 2B1u | B3u | 1.5943 (0.0166) |
| 2Au → 2B2g | B2u | 2.7329 (0.0059) | 2B2g → 2Au | B2u | 1.9929 (0.0057) |
| 2Au → 2B1g | B1u | 3.0079 (0.0001) | 2B2g → 2B1u | B3u | 2.4421 (0.0128) |
| 2Au → 2B2g | B2u | 3.4749 (0.0516) | 2B2g → 2Au | B2u | 2.9226 (0.2101) |
The neutral, radical anion and radical cation transitions are shown for each molecule. In all cases, the lowest lying electronic transition is significantly higher in energy for the neutral as compared to the radical derivatives for each molecule, although this energy difference is much greater in the dibenzopolyacenes. The radical anion and radical cation derivatives of the same backbone also have very similar absorption spectra. We have seen this behavior before in a different set of PAHs10 and noted that this is in qualitative agreement with the pairing theorem of Huckel theory.
It is interesting to note that there is a very low lying absorption that lies in the IR region for certain radical anion and radical cation species, specifically dibenzooctacene, dibenzohexacene, dibenzotetracene, octacene and hexacene. This low-lying electronic transition is present in all of the species, however it decreases in energy with increasing size for both the polyacenes and the dibenzopolyacene derivatives, so that the transition is in the IR region for only two of the polyacenes (hexacene and octacene) and all of the dibenzopolyacene derivatives except for dibenzonaphthalene (dibenzotetracene, dibenzohexacene and dibenzooctacene).
The low-lying transitions of the octacene and hexacene radical ions are characterized by transition moments along the short axis of the molecules (B2u transition symmetry), as are those of the radical ions of dibenzotetracene. In contrast, the transitions of the dibenzooctacene and dibenzohexacene radical ions form transition moments along the long axis of the molecules (B3u transition symmetry). We know this from the symmetries of the ground and excited states and group theory, which identifies the dipole-allowed transitions. This then explains the origin of the larger oscillator strengths in the dibenzooctacene and dibenzohexacene versus polyacene and dibenzotetracene lowest lying transitions.
The oscillator strengths of the lowest electronic transitions for the radical species are not particularly large for optical absorptions, especially in comparison to other nearby absorptions. As a reference, the oscillator strengths divided by the number of carbon atoms (OS C−1) for the lowest electronic transitions of the radical species are shown in Table 6. This is a quantity we have considered in previous papers10,11 to gauge the strength of very intense electronic absorptions. In systems such as the oligorylenes, which exhibit very intense electronic absorptions, the oscillator strength per carbon was in the range of 20–25 (×10−3). The low lying transitions considered here have oscillator strength per carbon values that are roughly twenty times smaller. However, these excitations distinguish themselves by absorbing in the infrared. The question then arises as to whether or not the electronic transitions may be distinguishable in an IR spectrum. This may be possible in two ways. The first possibility is if the wavelength of the absorption lies in a region of the spectrum where vibrational transitions typically do not occur for hydrocarbon species, for example in the window of roughly 1700–3000 cm−1. Alternately, it may be possible to distinguish the electronic transition if the intensity of the absorption is significantly greater than any typical vibrational feature.
| Radical anion | Radical cation | |||
|---|---|---|---|---|
| Molecule | Exc. E/eV | 103OS C−1 | Exc. E/eV | 103OS C−1 |
| Octacene (C34H20) | 0.3465 | 0.08 | 0.3832 | 0.08 |
| Hexacene (C26H16) | 0.7788 | 0.23 | 0.8286 | 0.22 |
| Tetracene (C18H12) | 1.5319 | 0.59 | 1.5915 | 0.45 |
| Naphthalene (C10H8) | 2.1990 | 4.64 | 2.1161 | 4.72 |
| D-Octacene (C40H22) | 0.2827 | 1.20 | 0.1542 | 0.38 |
| D-Hexacene (C32H18) | 0.3407 | 0.94 | 0.2609 | 0.90 |
| D-Tetracene (C24H14) | 0.4689 | 0.25 | 0.6595 | 0.30 |
| D-Naphthalene (C16H10) | 1.5008 | 0.96 | 1.5943 | 1.04 |
The TDDFT transition energy of an electronic absorption in the IR cannot be reliably distinguished from vibrational features, due to the limited accuracy of the method. The accuracy of TDDFT for low lying electronic absorptions is roughly 0.3 eV, or 2400 cm−1. This is reasonable for visible or UV region absorptions, however for IR absorptions this error range essentially covers the entire energetic region of interest. It is therefore impossible to identify any electronic transition that will absolutely absorb in a vibrationally quiet window. It is only possible to identify that an electronic absorption will be present in some region of the IR spectrum, which could very well be in a region of strong vibrational absorptions. If optical absorptions are potentially distinguishable, then the origin must be as a result of the relative intensities of the electronic versus vibrational transitions.
Oscillator strengths of electronic absorptions are not directly comparable to IR intensities. However, direct comparisons of intensity are possible by way of transition moments. Fig. 5 compares intensities (squared transition moments) of the strongest calculated DFT vibrational absorption to the TDDFT electronic absorption in the spectral window below 4500 cm−1. These comparisons are shown for the radical anion and radical cation polyacenes and dibenzopolyacene derivatives. The intensity comparisons of naphthalene/dibenzonaphthalene and the tetracene/dibenzotetracene radical cation are not shown since there are no electronic features in this region for these species. The relative intensities of the strongest absorptions are significantly different for dibenzooctacene and dibenzohexacene. Whereas the strongest vibrational feature is stronger than, or similar to, the low energy electronic absorption in the polyacenes and dibenzotetracene radical anion, the dibenzooctacene and dibenzohexacene electronic features are substantially more intense than the largest vibrational features, and hence clearly distinguishable. This phenomenon is extremely unusual and merits further investigation into the source of the low-lying electronic transitions.
 | ||
| Fig. 5 Comparison of calculated vibrational and electronic absorption intensities that lie below 4500 cm−1. The vibrational intensity shown is that of the largest feature in the spectral window. | ||
4.1. Orbital origin of the electronic transitions in the IR
We briefly mentioned earlier that the larger oscillator strength in the lowest absorptions of the larger dibenzopolyacenes is due to the transition dipole moment alignment along the long axis of the molecule, instead of the short axis, as with the polyacenes. This change in the direction of the transition dipole may be attributed to a change in the relative spacing of the molecular orbitals involved in the first excited state. Figs. 6 and 7 show the frontier orbitals for octacene and tetracene with the corresponding polyacene and dibenzopolyacene derivative in the same figure for comparison. The orbital energy levels shown are those of the neutral parent for each species, however the orderings and relative spacings of the orbitals remain the same for the radical derivatives. These orbitals are meant to approximate the frontier orbitals for neutral, radical anion and radical cation simultaneously, and are distinguished as follows. The horizontal lines in the orbital level diagrams indicate the separation of occupied and unoccupied orbitals in the neutral parent for each molecule. Occupied orbitals are indicated by alpha and beta spin electrons (up and down arrows, respectively). The red alpha electron indicates the orbital that is occupied for the radical anion, and the blue beta electron indicates the orbital that is unoccupied for the radical cation. The red and blue direction arrows show the change in orbital occupations for the radical anion and radical cation transitions.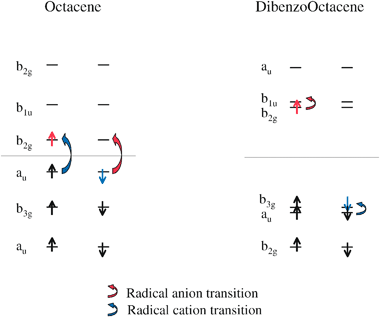 | ||
| Fig. 6 Frontier orbitals of octacene and dibenzooctacene. The horizontal line indicates the separation between occupied and unoccupied orbitals in the neutral systems. The orbitals that are occupied for the radical anions are indicated in red, and the corresponding radical anion transitions are shown with red arrows. The orbitals that are unoccupied for the radical cations are shown in blue, with the corresponding radical cation transitions shown with blue arrows. | ||
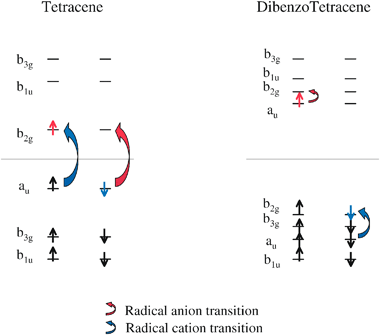 | ||
| Fig. 7 Frontier orbitals of tetracene and dibenzotetracene. See the caption in Fig. 6 for further details. | ||
Octacene/dibenzooctacene and tetracene/dibenzotetracene will be detailed in the following discussion, hexacene/dibenzohexacene and naphthalene/dibenzonahpthalene follow qualitatively. The first thing to notice in the orbital level diagram in Fig. 6 is that the relative spacings of the neutral HOMO and LUMO levels are quite different between octacene and dibenzooctacene. In the following discussion, HOMO and LUMO will always refer to the orbitals designated as HOMO and LUMO in the neutral species.
In Fig. 6, we can see that the octacene HOMO to LUMO gap is significantly smaller than the gap in dibenzooctacene. In fact, the HOMO to LUMO gap in octacene is actually smaller than the HOMO − 1 to HOMO and LUMO to LUMO + 1 gaps, whereas the reverse is true for dibenzooctacene. The implication of this for the octacene radical anion is that the lowest excited state will result from a beta electron transition involving the highest doubly occupied and singly occupied orbitals. The octacene radical cation lowest lying transition involves corresponding levels in the alpha space, however in this case the orbitals involved are the singly occupied and lowest unoccupied orbitals. It is interesting to note that the octacene radical lowest lying transitions involve the same change in orbital occupation as occurs in the lowest transition in the neutral. Table 2 confirms that while the excitation energy itself is different, the transition symmetry is indeed the same for the lowest lying excitation in all three charge states.
The orbitals involved in the dibenzooctacene radical transitions are not homologous to the octacene radical transitions. Whereas the octacene radical anion involved a beta electron transition, the dibenzooctacene radical anion transition occurs in the alpha space. Likewise, the dibenzooctacene radical cation absorption is a beta electron transition, as opposed to the octacene radical cation alpha transition. This is true for the hexacene and dibenzohexacene pair as well. The origin of the change in transition character is due to the relative spacings of the HOMO and LUMO. The LUMO in polyacene (octacene or hexacene) is shifted up in energy for the dibenzopolyacene LUMO, and the HOMO is shifted down in energy for the dibenzopolyacene HOMO. The HOMO − 1 and LUMO + 1 energies remain relatively unchanged in going from polyacene to dibenzopolyacene derivative. The orbitals involved in the tetracene/dibenzotetracene and nahpthalene/dibenzonahpthalene pairs are somewhat different, and should be illustrative in understanding the different behavior in these smaller species.
The observation and theoretical prediction of low energy electronic features is quite remarkable in PAHs of this size. We have just established that orbital energy levels may be responsible for this interesting phenomenon, but this still does not give us a full understanding of how these species are set apart from “common” PAH behavior. We aim to determine the origin of these orbital level differences by directly comparing the frontier orbitals of polyacene and dibenzopolyacene. The obvious difference between each related pair of species is the dibenzo substituent. We approach this issue by treating the dibenzopolyacene orbitals as the product of orbital mixing between the polyacene orbitals and the orbitals of two allyl radicals (C3H5), specifically focusing on dibenzooctacene in great detail. Figs. 8 and 9 show the b1u and b2g frontier orbitals of dibenzooctacene, all of the octacene and allyl radical orbitals that contribute to the character of dibenzooctacene orbitals, and all other orbitals of octacene and dibenzooctacene within this energetic region required to conserve the number of orbitals of a given symmetry. The molecular orbital pictures for dibenzooctacene are shown only for the frontier orbitals b1u and b2g. These orbital pictures are qualitatively representative of the mixing pictures of au and b3g. The only octacene and allyl radical orbital pictures shown are those with the largest contribution to the character of the dibenzooctacene frontier orbitals.
 | ||
| Fig. 8 Orbital mixing picture of dibenzooctacene b1u frontier orbitals. | ||
 | ||
| Fig. 9 Orbital mixing picture of dibenzooctacene b2g frontier orbitals. | ||
We emphasize “largest contribution” because all orbitals of the same symmetry do interact to various extents dependent on the energetic gap between them. It is not correct to assume, for example, that the dibenzooctacene b1u frontier orbital derives its character solely from a single b1u octacene orbital. In fact, it is possible to see that there is a very small amount of orbital amplitude located on the dibenzo substituent. However, it is a reasonable approximation to say that the predominant source of the dibenzooctacene b1u frontier orbital is derived from octacene. The same is true for the b3g frontier orbital of dibenzooctacene. The b2g (and au) (HOMO and LUMO) orbitals are more complicated, due to the fact that the allyl radical orbitals lie energetically close to the octacene orbitals of the same symmetry.
The dashed lines in Figs. 8 and 9 are shown only for the dibenzooctacene frontier orbitals as a guide to the eye for the largest octacene and allyl radical contributors. The dibenzooctacene b2g frontier orbital is the product of orbital mixing from two octacene orbitals and one allyl radical orbital. This is also the case for the dibenzooctacene au frontier orbital. The proximity of the allyl radical orbitals to the octacene orbitals of matching symmetry induce mixing not only between allyl radical and octacene orbitals, but also significant mixing between octacene orbitals. This then explains the shift in energy for the HOMO and LUMO of dibenzooctacene compared to octacene, while the neutral HOMO − 1 and LUMO + 1 are relatively unchanged between the two species.
This orbital mixing picture for dibenzooctacene is qualitatively similar for dibenzohexacene. However, the same is not true for dibenzotetracene (or dibenzonaphthalene) (Fig. 7). The tetracene frontier orbital ordering is identical to that of octacene. And yet the dibenzotetracene frontier orbital ordering is not identical to that of dibenzooctacene. The HOMO, HOMO − 1 and HOMO − 2 for dibenzooctacene are b3g, au and b2g, respectively. In dibenzotetracene, the b2g orbital has shifted up to the HOMO, and the b3g and au orbitals are the HOMO − 1 and HOMO − 2, respectively. There is a similar shifting of orbital ordering in the unoccupied frontier orbitals, so that the au orbital, which was the LUMO + 2 for dibenzooctacene, is the HOMO for dibenzotetracene.
Fig. 10 shows the source of the difference in dibenzotetracene frontier orbitals as compared to dibenzooctacene (and dibenzohexacene). The au and b2g (HOMO and LUMO) orbitals of octacene are both higher in energy than the allyl radical degenerate au and b2g orbitals, as can be seen in either of Figs. 8 and 9. Fig. 10 shows that the au and b2g (HOMO and LUMO) orbitals of tetracene are shifted lower in energy in contrast to octacene, so that the HOMO of tetracene is slightly energetically lower than the degenerate allyl radical orbitals. This results in the change in ordering of the frontier orbitals of dibenzotetracene.
 | ||
| Fig. 10 Orbital mixing picture of dibenzotetracene frontier orbitals. | ||
This difference in orbital ordering may seem very minor, however the implications are quite substantial. Since the dibenzotetracene LUMO and LUMO + 1 are au and b2g symmetry orbitals, respectively, the lowest lying electronic transition for the dibenzotetracene anion is a B2u symmetry (short axis) transition. Likewise, the dibenzotetracene cation lowest-lying electronic transition is a B2u symmetry (short axis) transition. The dibenzotetracene HOMO and HOMO-1 are b2g and b3g symmetry orbitals, therefore the lowest-lying dipole-allowed electronic transition for the cation actually involves the au (HOMO − 2) and b2g (HOMO) symmetry orbitals. The fact that the cation transition is not a change in orbital occupation between neighboring orbitals explains why the excitation energy is larger for the dibenzotetracene cation than for the anion (see Table 4). More importantly, we now know the source of the difference in the character of the lowest electronic transition in the dibenzotetracene (and dibenzonaphathalene) ions, as compared to the dibenzooctacene (and dibenzohexacene) ions.
5. Conclusions
We have identified an electronic transition that occurs in the IR region in certain dibenzopolyacene radical ions with time dependent density functional theory calculations. Specifically, the radical anions and radical cations of dibenzooctacene, dibenzohexacene, and the radical anion of dibenzotetracene all exhibit low lying electronic absorptions that are distinguishable from their vibrational spectra. The electronic transitions are significantly stronger than the most intense vibrational transitions in the IR.These low lying electronic features are absent from the polyacene counterparts to the dibenzopolyacenes. Low-lying electronic transitions do exist in the larger polyacene ions, however the absorptions are no stronger than the vibrational absorptions in the same energetic region. The source of this difference between the polyacene and dibenzopolyacene ion lowest-lying absorptions is that the transition moments are oriented along different axes.
The polyacene transitions are oriented along the short axis of the molecules whereas the dibenzopolyacene transitions are oriented along the long axis of the molecules. We have found that the change in transition character may be explained by orbital mixing between the frontier orbitals of the polyacenes and two allyl radical substituents. We have additionally found that the orbital mixing picture shows that this long axis transition will only occur in the larger species when the substituent orbitals mix to provide dibenzopolyacene frontier orbitals with the appropriate ordering to allow transitions of long axis symmetry.
Experimentally, the main observations we have made are the presence of unusually intense spectral features in the IR for the radical ions of dibenzooctacene and dibenzohexacene. Our theoretical calculations predict that the anion absorption features are blue-shifted relative to the cation and the features shift to the red with increasing backbone length. This is consistent with the matrix isolation spectra presented here. Positive identification based on direct correspondence of theory with experiment is unlikely to be possible in more detail than this due firstly to the large uncertainty in the calculation. A second problem in comparison with experiment is the presence of significant vibrational structure in the electronic transition as well as possible vibronic interactions. It is in principle feasible to investigate these latter effects via electronic structure calculations also. While beyond our present scope, this is an interesting problem for future investigation.
Our findings add a potentially very interesting new dimension to the PAH model first put forward some two decades ago. There is already abundant evidence that PAHs and PAH ions have strong transitions in regions of the visible and ultraviolet associated with the diffuse interstellar bands (DIBs). Vibrational transitions associated with PAHs (such as CH and CC stretches) make up the unidentified infrared (UIR) bands which fall in the mid-IR. This work is the first report to our knowledge that establishes that electronic transitions in PAH ions can also be responsible for features in the mid-IR. It is very likely that extraterrestrial PAH ions can also exhibit such features, if they have orbital interactions similar to those we have identified as critical in the dibenzopolyacenes. Thus absorption features in the mid-IR that are not associated with the usual vibrational spectroscopy of PAHs can still be consistent with the PAH model.
Acknowledgements
This work was supported by the National Aeronautics and Space Administration under Grant No. NNGO4GB94G issued through the NASA/Goddard Space Flight Center, NASA’s Long Term Space Astrophysics Program, and a Laboratory Astrophysics grant (188-44-57-01 and 188-02-04-02). AM acknowledges the support of the National Research Council. We gratefully acknowledge the expert technical and experimental support of Robert Walker.References
- P. Cox and M. Kessler, The Universe as seen by ISO, ESA Publications, ESTEC, Noordwijk, 1999 Search PubMed.
- D. Hudgins, C. Bauschlicher, L. Allamandola and J. Fetzer, J. Phys. Chem. A, 2000, 104, 3655 CrossRef CAS.
- C. Bauschlicher and S. Langhoff, Spectrochim. Acta A, 1997, 53, 1225 CrossRef.
- L. Allamandola, D. Hudgins and S. Sandford, Astrophys. J. Lett., 1999, 511, L115 CrossRef CAS.
- E. Peeters, S. Hony, C. V. Kerkhoven, A. Tielens, L. Allamandola, D. Hudgins and C. Bauschlicher, Astron. Astrophys., 2002, 390, 1089 CrossRef CAS.
- S. Hony, C. V. Kerkhoven, E. Peeters, A. Tielens, D. Hudgins and L. Allamandola, Astron. Astrophys., 2001, 370, 1030 CrossRef.
- D. Aitken and P. Roche, Mon. Not. R. Astr. Soc., 1983, 202, 1233 Search PubMed.
- K. Uchida, K. Sellgren and M. Werner, Astrophys. J. Lett., 1998, 493, L109 CrossRef.
- K. Uchida, K. Sellgren, M. Werner and M. Houdashelt, Astrophys. J., 2000, 530, 817 CAS.
- T. M. Halasinski, J. L. Weisman, R. Ruiterkamp, T. J. Lee, F. Salama and M. Head-Gordon, J. Phys. Chem. A, 2003, 107, 3660 CrossRef CAS.
- J. L. Weisman, T. J. Lee, F. Salama and M. Head-Gordon, Astrophys. J., 2003, 587, 256 CAS.
- J. L. Weisman, T. J. Lee and M. Head-Gordon, Spectrochim. Acta A, 2001, 57, 931 CrossRef CAS.
- A. Mattioda, D. Hudgins, C. Bauschlicher and L. Allamandola, Astrophys. J. Search PubMed , unpublished work.
- E. Runge and E. Gross, Phys. Rev. Lett., 1984, 52, 997 CrossRef CAS.
- M. Petersilka, U. Gossmann and E. Gross, Phys. Rev. Lett., 1996, 76, 1212 CrossRef CAS.
- R. Bauernschmitt and R. Ahlrichs, Chem. Phys. Lett., 1996, 256, 454 CrossRef CAS.
- D. Hudgins and L. Allamandola, Astrophys. J. Lett., 1999, 513, L69 CrossRef CAS.
- D. Hudgins and S. Sandford, J. Phys. Chem. A, 1998, 102, 329 CrossRef.
- J. Kong, et al., J. Comput. Chem., 2000, 21, 1532 CrossRef CAS.
- A. D. Becke, Phys. Rev. A, 1988, 38, 3098 CrossRef CAS.
- C. Lee, W. Yang and R. G. Parr, Phys. Rev. B, 1988, 37, 785 CrossRef CAS.
- M. Frisch, et al., GAUSSIAN 98, (Revision A.7), Gaussian, Inc., Pittsburgh, PA, 1998 Search PubMed.
- A. D. Becke, J. Chem. Phys., 1993, 98, 5648 CrossRef CAS.
- J. P. Perdew, Phys. Rev. B, 1986, 33, 8822 CrossRef.
Footnotes |
| † Current address: Department of Cellular and Molecular Pharmacology, University of California, San Francisco CA, USA. |
| ‡ Mail Stop T27B-1. |
| § Mail Stop 230-3. |
| This journal is © the Owner Societies 2005 |