Raman spectroscopic study of mixed valence neodymium and cerium chloride solutions in eutectic LiCl–KCl melts
Veronica M.
Rodriguez-Betancourtt
and
Detlef
Nattland
*
Institute of Physical Chemistry, Physical Chemistry of Condensed Matter, University of Karlsruhe, D-76128, Karlsruhe, Germany. E-mail: nattland@ipc.uka.de; Fax: +49-721-608-4856; Tel: +49-721-608-2105
First published on 9th November 2004
Abstract
We have studied the Raman spectra of (NdCl2)–(NdCl3) and Ce–(CeCl3) mixtures in eutectic (LiCl)0.58(KCl)0.42 as solvent in the temperature range up to 600 °C. For the highly corrosive samples a windowless cell in connection with a Raman microscope was utilised. To our knowledge the Raman spectra of the solutions of NdCl2, CeCl3 and (most likely) CeCl2 in eut.–LiCl–KCl are shown here for the first time. In accordance with other rare earth halides described in the literature the Raman spectra of the pure trivalent systems are dominated by octahedral LnCl63− species which show a typical broad polarized band centred at 245 cm−1 for NdCl3 and 240 cm−1 for CeCl3, respectively. NdCl2 in (LiCl–KCl)eu shows a complex Raman spectrum consisting of depolarized bands. In mixtures of divalent and trivalent neodymium chlorides both spectra can be observed in parallel and no additional Raman bands appear. Solutions of cerium in CeCl3–(eut.–LiCl–KCl) show temporarily new Raman bands which are presumably due to divalent cerium chloride. These bands disappear in our samples after about 1 h since CeCl2 is not stable under the experimental conditions. Our findings are discussed in the light of the strongly different electronic transport properties in the neodymium and cerium systems.
Introduction
Solutions of rare earth metals in their respective rare earth trihalides represent a particular interesting class of metal-molten salt melts. In the sequence from La–LaCl3, Ce–CeCl3, Pr–PrCl3 to Nd–NdCl3 the concentration dependence of the electrical conductivity of the homogeneous melts is strongly different, as can be seen from Fig. 1.1 The lanthanum and cerium systems show a rapid rise of the DC conductivity with the metal concentration, whereas it remains almost constant in the neodymium system (Pr is intermediate). In the former cases mobile Drude electron states are assumed to dominate the electronic transport. This is in analogy to that what has been proposed previously for the alkali metal–alkali halide systems.2–4 In the latter case the divalent oxidation state is stable. Thus, the metal excess electrons can be effectively trapped and localized. Starting from the [Xe]4fn5d06s0 (n = 1 for Ce and n = 3 for Nd) electron configuration of the trivalent rare earth cations an important reason for these differences is the tendency to preferentially fill d states in the case of Ce and f states in the case of Nd. In contrast to the strongly localized and well shielded f states the d states overlap and may form extended bands. The population of these bands with excess electrons may lead to a continuously growing DC conductivity with metal concentration. On the other hand, transport in the neodymium systems occurs via an intervalence charge transfer mechanism between adjacent oxidation states, as was already suggested by Bredig and coworkers.1,5 Recent investigations employing electronic conductivity, optical absorption and ESR experiments support this opinion.6–8 Within such a simple one-electron-two-site model the highest probability for electron transport, i.e. a maximum in the electronic conductivity, is expected at a composition of (NdCl2)0.5–(NdCl3)0.5 or, equivalently, Nd0.167–(NdCl3)0.833. This is shown in the upper panel of Fig. 1. | ||
| Fig. 1 Lower panel: total DC conductivity σ(0) of various metal–molten salt systems versus the metal mole fraction xM, as adopted from ref. 1. Upper panel: electronic conductivity σe of Nd–NdCl3, calculated by subtracting the average ionic conductivity σi(x) = xσi(NdCl3) + (1 − x)σi(NdCl2) from σ(0). The maximum in the middle between NdCl3 and NdCl2 is typical for an intervalence charge transfer mechanism. Lines serve to guide the eye. | ||
Beside this first insight into the electronic structure much less is known about the microscopic structure as function of the metal content in the solutions. The main reason for this gap in our knowledge is the strong corrodibility of the melts. However, for further understanding of the different behaviour of, e.g., the cerium and the neodymium systems it is necessary to apply probes sensitive to structural changes like Raman spectroscopy to identify those ionic species or complexes governing the reduction process. One can easily imagine that this knowledge is not only important for the interdependence between electronic and microscopic structures but also for applied aspects like the electrodeposition of rare earth metals from molten salts.
The change of the microscopic structure of metal–molten salt solutions with increasing metal concentration can be very different. In the alkali metal–alkali halide solutions the structure is dominated by the closed shell properties of the ions and by their dynamics. Thus, the structure is described by average values of the interionic distances and the numbers of next neighbours rather than by the identification of long living molecular or ionic complexes.9–11 A second example are cadmium–cadmium chloride solutions. Here, the formation of the solvated dimer cation Cd22+ was suggested recently on account of Raman spectroscopy.12
In contrast to rare earth metal–rare earth halide solutions the structures of the pure trivalent rare earth halides and their solutions in alkali halides have been extensively studied and carefully characterized by Papatheodorou and coworkers using Raman spectroscopy.13–18 In the liquid state the pure LnX3 systems form a loose network with edge bridged distorted octahedra with a sixfold coordination of the central rare earth ion. On dissolving LnX3 in alkali halides this network breaks open and with progressive dissolution the octahedra become more and more isolated and regular. These experiments and conclusions serve as valuable starting points for our investigations of the metal–molten salt solutions. In this paper we describe the development of a Raman cell suitable for dealing with the corrosive melts. We present our first results on the neodymium chloride and cerium chloride systems.
Experimental
General considerations
From experimental point of view, rare earth metal–rare earth halide solutions are especially challenging since only a few materials like tantalum or glassy carbon can be used as high temperature containers, none of which being optically transparent in the interesting energy range. Therefore we constructed a new cell consisting of a glassy carbon crucible mounted inside a protecting quartz tube. In this way a direct contact between the liquid sample and the window is avoided. In the literature this is sometimes referred to as “windowless”. For such an approach the Raman spectrometer has to work in the back scattering geometry. We used a Jobin-Yvon Labram microscope and replaced the standard objective by an achromatic lens of 40 mm or 50 mm focal length to gain the necessary distance to the hot sample. This instrument is equipped with a notch filter to suppress the Rayleigh scattering and a CCD camera as detector which allows measuring the Raman spectra in a single shot. Accumulating the spectra in an adequate time interval improves the signal to noise ratio. However, this technique has the following disadvantage: on account of the notch filter the accessible spectral range is restricted down to ca. 100 to 120 cm−1 depending on the notch filter angle set in the experiment. Thus, low lying modes are not visible with the available instrument. And secondly, the Raman light has to compete with the thermal emission of the sample. To what extent this limits the reachable temperature range depends on the Raman cross section of the vibrational mode studied, on the emissivity of the sample and on the focussing conditions. Here, we present experimental results up to 700 °C.Experimental setup
The windowless cell, the heating system and the focussing conditions are shown schematically in the upper Part A of Fig. 2 approximately in scale. A glassy carbon crucible (3 mm id) containing the sample is mounted inside a quartz tube, equipped with a flange. For sealing an optically polished quartz plate and a graphite ring is pressed against this flange. This sealing technique has been well proven vacuum tight in previous experiments.6 The exciting laser beam is focussed with an achromatic lens of 50 mm focal length into the sample. The Raman spectrum in the backscattered light enters the spectrometer through the same objective. The quartz tube could be heated by an external heating element and a NiCr-Ni thermocouple was used to measure the temperature. It has to be emphasized that there is no direct contact between the liquid sample and the quartz container. Depending on the vapour pressure of the sample a contamination of the optical window can possibly occur. Thus, a fast spectrum acquisition is necessary. In the lower part B of Fig. 2 we present the sample cell for the pure rare earth trihalides in eutectic alkali halide melts. Quartz is resistant against these liquids. The sample was filled in a thin quartz capillary (1 mm id) which was subsequently sealed under vacuum using a glassblower’s torch. The quartz tube is mounted inside a heating element and a quartz carrier. An achromatic lens of 40 mm focal length serves as objective. Both cell versions could be aligned in the laser focus with a xyz-positioner. | ||
| Fig. 2 (A) windowless cell type A for the rare earth metal–rare earth trihalide mixtures in alkali halides. 1 achromatic lens of the objective, focal length 50 or 60 mm, 2 heat shields, 3 sealing quartz plate, optically polished, 4 quartz container for the crucible, 5 sample in a glassy carbon crucible, 6 steel frame, 7 graphite seal, squeezed by the steel frame, 8 Kanthal heating element, 9 holder and thermal insulation, 10 type K thermocouple. (B) Cell type B for rare earth trihalides–alkali halides solutions. The sample is hermetically sealed in a quartz tube (2 mm od, 30 mm in length). Focal length of the Raman microscope objective: 40 mm. | ||
Sample and cell preparation
All chemicals have been handled in an Ar-glove box with an O2 and H2O content of less than 2 ppm. LiCl and KCl (Alfa, 99.999%) were first dried under vacuum at 150 °C for several hours and then recrystallized from the melt in Ar atmosphere. Rare earth metals (Alfa, 99.9%) were cleaned shortly in HNO3 to remove residual surface oxides, and then rinsed with water and acetone. LnCl3 was synthesized from Ln2O3 at the Technical University of Warsaw (Poland) using a procedure described by Gaune-Escard and coworkers.19 Salts were further purified by distillation in a quartz tube at ca. 780 °C. Instead of Nd metal the divalent NdCl2 was employed in the experiments. This was synthesized from stoichiometric amounts of Nd and NdCl3 in a Ta crucible. The X-ray powder diffractogram of the NdCl2 sample employed in our experiments showed the lines expected for NdCl220 and to an extent of ca. 25% those lines of the neighbouring phase Nd3Cl721 which has been carefully studied by Lumpp and Bärnighausen.22,23 No Bragg peaks of oxides or oxichlorides have been detected. The mixtures of NdCl2–NdCl3 and CeCl3, respectively, with LiCl–KCl eutectic were pre-melted at ca. 500 °C, i.e. when the eutectic is liquid. The homogenized, polycrystalline mixtures were grinded in a mortar and filled in the glassy carbon crucible. For the Ce system a weighed piece of Ce metal was added. The crucible was then put into the quartz tube which was sealed with the help of a steel frame and finally mounted into the Raman spectrometer. In the case of the pure trivalent mixtures the grinded samples were filled in a thin quartz tube of cell B. These were connected to a vacuum system and then melt sealed.Recording of the spectra
Raman spectra are excited using laser radiation with a wavelength of 632.8 nm. The laser power at the sample is ca. 5 mW. Focussing of the laser light onto the sample and collecting the scattered light is achieved by the same objective. After sufficient depletion of the Rayleigh line with the aid of the notch filter the Raman light optionally passes a polarizer and enters the 300 mm spectrograph through an adjustable slit which was set in our experiments to 100 μm. Together with the 1200 grooves mm−1 grating a spectral resolution of 3 cm−1 was obtained in the Raman shift range from 100 to 500 cm−1, which is of interest here. The CCD detector has a pixel-to-pixel resolution of 1.7 cm−1. If not otherwise stated, we integrated the spectra at 120 s. Wavelength calibration was obtained intrinsically by measuring the depleted notch filter breakthrough of the Rayleigh line and by comparing Stokes and anti-Stokes spectra. This comparison was also useful to identify possible fluorescence bands in the spectrum. At the measuring temperature the spectra were recorded first without polarizer and then in the VV and HV configurations.Results and discussion
(LnCl3)x(eut.–LiCl–KCl)1 − x
Fig. 3 shows the Raman spectra of NdCl3 and CeCl3 dissolved in eutectic LiCl–KCl. They have been recorded in quartz capillaries displayed in Fig. 2B. The main spectroscopic feature in both systems is a strong polarized band centred around 240 to 250 cm−1 which was attributed previously to the symmetric A1g mode of an octahedral species.15 It superimposes a base line which consists probably of three contributions: the Rayleigh band foot and Raman scattering of the quartz tube. The third contribution is due to the depolarized F2g mode of an octahedral species, which was found in liquid (NdCl3)0.08(KCl)0.92 at 121 cm−1. Our spectra show depolarized scattering intensity in this Raman shift range, but due to the notch filter edge we are not able to unambiguously locate this depolarized band. Therefore, we concentrate in this paper on the polarized band.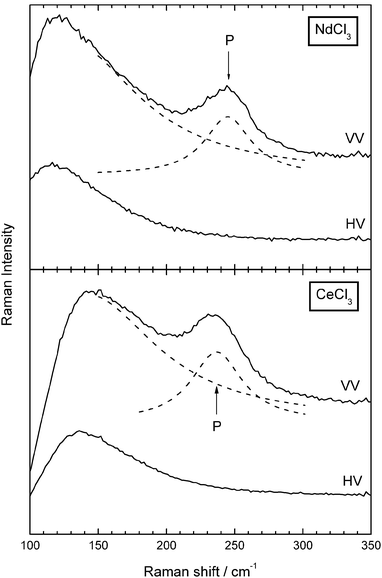 | ||
| Fig. 3 Polarized (VV) and depolarized (HV) spectra of (NdCl3)0.1(eut.–LiCl–KCl)0.9 at 500 °C and of (CeCl3)0.05(eut.–LiCl–KCl)0.95 at 485 °C. The dashed lines show fits to the spectra comprising a lorentzian tail as base line and a lorentzian oscillator for the polarized band. The quality of the fit is within the scattering of the spectra. The drop of the intensity below 120 cm−1 shows the edge of the notch filter. | ||
We have fitted the spectra in the following way: the base line was phenomenologically described by a lorentzian band tail. The polarized band was fitted using a lorentzian oscillator. The fits described our spectra within the scattering of the data points, which was examined by eye. Table 1 shows the band position ν1 and half width Δν1 of liquid (NdCl3)0.1(eut.–LiCl–KCl)0.9 measured at 500 °C. The agreement with the results on (NdCl3)x(KCl)1 − x published previously by Photiadis et al.15 is good. Table 2 summarizes our results on (CeCl3)x(eut.–LiCl–KCl)1 − x. For a convenient comparison of the measurements at different compositions x we have extrapolated ν1 and Δν1 to the same temperatures T = 485 and 690 °C. Included in Table 2 are the temperature dependences of ν1 and Δν1. The following observations are worth of being noted:
| System | x | T/°C | ν 1/cm−1 | Δν1/cm−1 | Ref. |
|---|---|---|---|---|---|
| (NdCl3)x(eut.–LiCl–KCl)1 − x | 0.1 | 500 | 245 ± 2 | 42 ± 3 | This work |
| 0.08 | 247 | 44 | |||
| (NdCl3)x(KCl)1 − x | 0.16 | 730–780 | 248 | 46 | 15 |
| 0.25 | 250 | 48 |
| x | T/°C | ν 1/cm−1 | Δν1/cm−1 | (dν1/dT)/cm−1 K−1 | [d(Δν1)/dT]/cm−1 K−1 | Temperature range/°C |
|---|---|---|---|---|---|---|
| 0.05 | 485 | 238 ± 2 | 42 ± 3 | (0.01) | (0.06) | 485, 690 |
| 690 | 240 ± 2 | 55 ± 5 | ||||
| 0.25 | 485 | 243 ± 2 | 57 ± 6 | 0.029 ± 0.003 | 0.04 ± 0.01 | 450–600 |
| 690 | 249 ± 2 | 65 ± 7 | ||||
| 0.25 | 485 | 240 ± 2 | 53 ± 5 | 0.024 ± 0.002 | 0.03 ± 0.01 | 550–700 |
| 690 | 245 ± 2 | 59 ± 5 |
(i) ν1 grows slightly but significantly by 5 to 7 cm−1, going from cerium to neodymium. On account of the lanthanide contraction the ionic radii decrease from Ce3+ (101 pm) to Nd3+ (98.3 pm). This may strengthen the bond between the central ion and its ligands, which in turn leads to a higher vibration frequency.
(ii) The band frequency shows only a weak trend to higher wavenumbers with increasing mole fraction x. This tendency can also be observed in (NdCl3)x(KCl)1 − x in the concentration range up to x = 0.25. Stoichiometrically this is the highest mole fraction for the existence of isolated octahedral species (to sustain the octahedral environment for Nd3+ beyond that composition chloride ligands have to be shared). With increasing concentration x up to 0.25 one has to consider a reduction of the average nearest neighbour distance between the octahedral complexes. Secondly, the halogen anion concentration in the alkali halide solvent is reduced leading at x = 0.25 to pure K+ as “solvent”. However, as can be seen from the spectra both effects cause only a small shift of the band frequency.
(iii) In contrast to ν1 the concentration dependence of the half width Δν1 is much more pronounced. Inhomogeneous broadening, lifetime broadening as well as interactions between the complexes are possible mechanisms. Pavlatou, Madden and Wilson have studied the microscopic structure and the vibrational dynamics of liquid LaCl3 and (LaCl3)0.2(KCl)0.8 using the Car–Parrinello simulation method.24 From their results they extract a time correlation function as a measure for the lifetime of the octahedral units. They suggest a strong decrease of this lifetime in connection with an inhomogeneous broadening as one changes the concentration x from 0.2 to 1. It is probable that this mechanism also accounts for the broadening in the composition range studied here.
(iv) As can be seen from Table 2 the band frequency ν1 of (CeCl3)0.25(eut.–LiCl–KCl)0.75 increases weakly but significantly with temperature. For two different samples this result was obtained from eight spectra in the temperature range between 450 and 600 °C and from eight spectra in the temperature range between 550 and 700 °C, respectively. It is interesting to note that such a temperature shift was not observed for (NdBr3)0.25(KBr)0.75.16
(v) With increasing temperature the half width of the main polarized band in the CeCl3 system grows considerably. As the ligand exchange dynamics will be accelerated with temperature, the most likely mechanism at constant composition for the spectral broadening is the reduction of the average lifetime of the octahedral species.
(NdCl2)x(NdCl3)y(eut.–LiCl–KCl)1 − x − y
In Fig. 4 the unpolarized Raman spectra of NdCl2 and NdCl3 in eutectic mixtures of LiCl and KCl are presented. Note that in this system we have denoted the NdCl2 mole fraction as x and that of NdCl3 as y, respectively. Spectrum (a) shows only the ν1 band at 245 cm−1 of pure NdCl3 equivalent to that what is shown in the upper part of Fig. 3. The weighed amount of NdCl3 in this spectrum as well as in the spectra (b) to (f) was close to y = 0.05. In the spectra (b) to (f) the weighed amount of NdCl2, x, grows from 0.009 to 0.044. Spectrum (g) shows a sample with x = 0.044 of NdCl2 and no NdCl3 added (however, applying formal stoichiometry the small amount of Nd3Cl7 impurity accounts for an effective NdCl3 content of y = 0.005). | ||
| Fig. 4 Raman spectra of (NdCl2)x(NdCl3)y(eut.–LiCl–KCl)1 − x − y. The spectra have been recorded without polarizer at the indicated temperatures. The composition of the samples is given as (x/y/1 − x − y): (a) (0/0.05/0.95) 450 °C, (b) (0.009/0.051/0.940) 500 °C, (c) (0.018/0.052/0.930) 500 °C, (d) (0.027/0.053/0.920) 530 °C, (e) (0.035/0.054/0.911) 600 °C, (f) (0.044/0.055/0.901) 600 °C, (g) (0.044/0.005/0.951) 600 °C, (h) anti-Stokes branch of spectrum (g). | ||
With the addition of NdCl2, in the accessible spectral range four new and relatively narrow bands are visible. They are located at ν2 = 115 cm−1, ν3 = 175 cm−1, ν4 = 340 cm−1 and ν5 = 450 cm−1. ν2 to ν4 have half widths between 15 cm and 20 cm−1. ν5 is broader by a factor of two and asymmetric, indicating that this band contains more than one spectral component. The spectral features ν2 to ν5 are depolarized. Spectrum (h) shows the anti-Stokes Raman branch of spectrum (g). This clearly demonstrates that ν3, ν4 and ν5 are true Raman bands (the anti-Stokes ν2-band is not visible since the notch filter covers the spectral range of the excitation line asymmetrically). In addition, fitting ν3, ν4 and ν5 of the Stokes- and the anti-Stokes-spectrum with Lorentzians the band areas are in full accord with the Boltzmann distribution function.
To our knowledge, the vibration spectra of liquid NdCl2 as well as those of NdCl2 dissolved in alkali halides have not yet been published. From our Raman spectra alone it is difficult to tell which particular NdCl2 species is responsible for this complex Raman band structure. It is known that NdCl2 in the solid state has the PbCl2 structure.25,26 There, Nd2+ has a ninefold coordination in the centre of a tricapped and distorted trigonal prism. Probably parts of this complicated geometrical structure of NdCl2 are preserved as NdCl2 is dissolved in the eutectic solvent. It is in particularly noteworthy that the NdCl2 bands have a higher Raman cross section than the main polarized band of NdCl3. This can be seen, e.g., from spectrum (c) in Fig. 4 for (NdCl2)0.018(NdCl3)0.052(eut.–LiCl–KCl)0.93: the bands ν3 to ν5 of NdCl2 have approximately the same band integral as ν1 of NdCl3.
At first sight, the development of the band intensities is quite surprising: even though the weighed concentration of NdCl3 is approximately constant in samples (a) to (f), the octahedral band intensity drops clearly. On the other hand, the intensities of the spectral features of NdCl2 increase as expected, however become approximately constant at ca. x = 0.03. However, this behaviour is in agreement with recent measurements of the optical absorption coefficient of these solutions.6 Consider, e.g., the absorption constant K, defined as log10(I0/I) ln(10) = dK with an optical path length d and the absorbance log10(I0/I). At the wavelength of the exciting laser, K increases with the addition of NdCl2 to NdCl3 (y ≈ 0.05 ≈ const.) in eutectic LiCl–KCl from K ≈ 10 cm−1 at x = 0 to K ≈ 103 cm−1 at x = 0.05. This attenuates strongly the exciting laser beam and reduces the intensities of the Raman bands. Even if all other experimental conditions like focussing and alignment or the laser intensity could be held constant, it seems difficult to evaluate the band intensities quantitatively.
In spectrum (g), i.e. with no NdCl3 added, we find a small intensity of the octahedral band of NdCl63− octahedra at 245 cm−1. However, this surprising observation is in accordance with solubility measurements of neodymium in NdCl3–LiCl–KCl solutions by Kvam, Bratland and Øye.27 They found that the equilibrium Nd + 2NdCl3 = 3NdCl2 shifts to the right with decreasing KCl content. At the composition of the eutectic LiCl–KCl a solution (NdCl2)0.05(eut.–LiCl–KCl)0.95 has to be more suitably written in the form: (Nd)0.007(NdCl2)0.030(NdCl3)0.013(eut.–LiCl–KCl)0.95, i.e. it contains undissolved neodymium metal and dissolved NdCl3.
It has to be pointed out that the Raman spectral features of our samples are most likely not due to a contamination with oxides. On one hand, neither Nd2O3 nor NdOCl was found in the XRD patterns. On the other hand, if Nd2O3 is added to liquid NdCl3, NdOCl is formed.28 The Raman spectra of liquid (NdCl3)0.67(KCl)0.33 and (NdOCl)0.099(NdCl3)0.628(KCl)0.273 have been studied and compared by Mediaas et al.29 On addition of NdOCl only one new band is observed at 175 cm−1 which is weak and polarized.
A last aspect of this paragraph concerns the implications of our Raman spectroscopic findings for the electron localization and for the electronic transport properties. From electrical conductivity measurements, optical absorption spectroscopy and electron spin resonance investigations an intervalence charge transfer mechanism was suggested for the electron transport in (NdCl2)x(NdCl3)y(eut.–LiCl–KCl)1 − x − y solutions.6,8,30 Within such a one-electron-two-site model, electron transport occurs via jumps from Nd(+II) sites to Nd(+III) sites. For the microscopic structure the electronic jump rate in relation to typical vibration frequencies is important. If the jump rate is slow, the ionic complexes involved in the intervalence charge transfer have time to restore their equilibrium structure of the Nd(+III) and the Nd(+II) complexes. A fast jump rate may result in distorted structures which might exhibit new Raman bands or it leads to a significant alteration of the band shapes and Raman shifts. In our spectra of (NdCl2)x(NdCl3)y(eut.–LiCl–KCl)1 − x − y we do not see any other bands than those of the pure systems, i.e. for x = 0 or y = 0 in our terminology. There is also no significant change of the positions and the half widths of the bands. From these results one can conclude that the neodymium complexes should have enough time to restore their structure after an electron jump. It is interesting to see if this is in accord with recent investigations of the electronic transport properties. From the spectroscopic signature of the polaron band in (NdI2)x(NdI3)1 − x solutions Terakado estimated at 800 °C an electronic mobility of μe ≈ 0.02 cm2 V−1 s−1.30 If the neodymium complexes are statistically distributed in the solution, the average distance de between them can be estimated between 8 and 12 Å. Combining Einstein’s and Einstein–Smoluchovski’s equations to νe = 2μeRT/(ede2) we obtain a hopping rate νe of 1011 to 4 × 10¹¹ s−1 (e is the electronic charge). This is close to the value of the electronic correlation time τe ≈ 10−12 s which presumably defines an upper limit of the hopping frequency in these systems.8 The values for νe between 1011 to 1012 s−1 are a factor of 10 to 100 slower than the typical vibrational frequency of the rare earth halide species. Thus, the Raman spectra are in accord with the intervalence charge transfer model.
Cex(CeCl3)y(eut.–LiCl–KCl)1 − x − y
In Fig. 5 the unpolarized Raman spectra of Ce and CeCl3 in eutectic mixtures of LiCl and KCl are presented. Note, unlike the neodymium solutions, in this system we have denoted x as the Ce mole fraction and y that of CeCl3, respectively. Fig. 5A corresponds to a sample at 450 °C with x = 0.005 and y = 0.2. In Fig. 5B we have x = 0.02, y = 0.2 and T = 550 °C. Both series show spectra of the same sample at constant temperature at various time steps. Thus, the development towards equilibrium is recorded. | ||
| Fig. 5 (A) Unpolarized Raman spectra of Ce0.005(CeCl3)0.200(eut.–LiCl–KCl)0.795 at 450 °C observed during the dissolution process of Ce and CeCl3 in the liquid eutectic (accumulation time 60 s). (B) Unpolarized Raman spectra of Ce0.02(CeCl3)0.20(eut.–LiCl–KCl)0.78 at 550 °C observed during the dissolution process of Ce and CeCl3 in the liquid eutectic (accumulation time 240 s). | ||
In Fig. 5A and in the Raman shift range below 300 cm−1 we observe the dissolution/melting process of CeCl3–alkali halide mixed crystals which have been formed in a preceding heating and cooling cycle. As expected, the last spectrum of this series (here at 300 s) shows the CeCl63− octahedron band close to 240 cm−1 which was already presented in Fig. 3. The development of the spectra in this energy range was also observed with no cerium metal added. A striking difference of these spectra is the occurrence of a strong band at 456 cm−1. A comparison with the literature revealed that this band corresponds to the triply degenerated Raman active mode of solid CeO2.31,32 To study this surprising phenomenon we recorded Raman spectra at the surface of cerium metal used in our experiments. Even though the metal pieces did not show a visible oxide layer we observed an enormously strong signal at 466 cm−1 at 25 °C which shifts in the temperature range between room temperature and 800 °C to lower wavenumbers (0.024 cm−1 K−1). This band was also observed when small pieces of Ce metal were added to the LiCl–KCl eutectic. So far it is not clear if the CeO2 is dissolved or dispersed in the molten salt. It is possible that solid CeO2 traces float at the surface of the melt. The Raman spectra of the solution shown in Fig. 5A demonstrate that the Raman cross section of CeO2 is by far bigger than the one of CeCl3.
Coming back to the problem of electron localization in a cerium metal doped CeCl3–(eut.–LiCl–KCl) solution: if the Ce concentration is as low as in the sample discussed above (x = 0.005) we do not find any indications for the formation of reduced cerium species from the Raman spectrum. In addition, localized electronic defect states like F-centres or bipolarons like in alkali metal–alkali halide solutions are not observed either in cerium metal–molten salt solutions.30 Electrons stemming from the metal probably occupy extended conduction band states, which leads to increase of the conductivity1 (see Fig. 1).
If one increases the metal concentration in CeCl3–(eut.–LiCl–KCl) the development of the Raman spectra with time is markedly different. This is shown in Fig. 5B for Ce0.02(CeCl3)0.2(eut.–LiCl–KCl)0.78: At early stages of the dissolution process (360 s, 720 s) we observe at least three new bands beside the CeCl3–octahedron band. In independent experiments with a little different setting of the notch filter angle we clearly observed under similar conditions a fourth band close to the notch filter edge. In Fig. 5B this fourth band is only visible at later times as a small hump. The new bands are located at ν2 = 116 cm−1, ν3 = 175 cm−1, ν4 = 327 cm−1 and ν5 = 436 cm−1. It is interesting to compare these values with those found for NdCl2: ν2 = 115 cm−1, ν3 = 175 cm−1, ν4 = 340 cm−1 and ν5 = 450 cm−1. They are only a few wavenumbers different and the question arises if during the dissolution process of Ce in the molten salt a CeCl2 species forms of a similar structure as NdCl2. If one follows the dissolution process with time, one observes in the medium stages (at 1440–2160 s) approximate constant band intensities of ν3 to ν5 accompanied by a decreasing band intensity of the octahedron band. Probably the same explanation as for the neodymium case holds for this system: With the (possible) formation of CeCl2 the absorption coefficient rises and leads to a reduction of the Raman intensities. The Raman intensities of ν3 to ν5 are approximately compensated by the formation process. In the late stadium of the dissolution process (2520–3240 s) the new species disappear, accompanied by a decrease of the absorption constant and an increase of the CeCl3 octahedron intensity. CeCl2 is not a stable compound in the phase diagram of Ce–CeCl3.1 However, the formation of a CeCl2 species as intermediate might be possible. In particular, the considerably lower temperatures (550 °C in Fig. 5B) and the higher starting concentration of cerium metal may favour the formation of this intermediate state.
It has to be noted that the sample of Fig. 5B was also affected by the CeO2 band, but to a lower extent. The band develops in the medium stage of the reaction. It is interesting to see the interplay between the ν5 band at 436 cm−1 and the CeO2 band. It is known that CeO2 exhibits a size dependent phonon frequency33 and one could regard the band above 400 cm−1 as a single band shifting to higher frequencies. This would correspond to an increase of CeO2 particle size. However, the size dependent peak position at the temperature of interest accounts only for a shift of about four wavenumbers. In addition, from our data it seems that the intensity of the ν5 band scales with those of ν3 and ν4. Hence, we conclude that the bands ν2 to ν5 belong to the same species. If our hypothesis for the formation of CeCl2 is correct we have the interesting situation of the coexistence of three oxidation states of Ce in the solution. However, it is doubtful that CeO2 takes part in the equilibrium. For the occurrence of the strong band it is sufficient to have some slightly surface oxidized cerium metal particles in the laser excitation volume.
Conclusions
Utilizing a new windowless cell we have measured the Raman spectra of highly corrosive rare earth metal–rare earth halide systems dissolved in LiCl–KCl eutectic. The band positions and the half widths of the polarized octahedral band of the pure trivalent NdCl3 and CeCl3 have been characterized with respect to the composition and temperature. In the mixed system (NdCl2)x(NdCl3)y(eut.–LiCl–KCl)1 − x − y we found at least four new bands in the Raman spectrum which have to be attributed to a NdCl2 species whose structure could not be resolved in the present study. The polarized octahedron band and these four new bands are always visible with changing intensities in the spectra as the mole fractions x and y are varied. But neither the band positions nor the half width were changed. This behaviour is in agreement with the suggested intervalence charge transfer mechanism for the electron transport in this system. From optical absorption, ESR and electrical conductivity studies, the electron hopping rate was estimated to 10−11 to 10−12 s. For the Raman active species involved in the transport process this is slow enough to restore the equilibrium structures. It was highly surprising to find in Cex(CeCl3)y(eut.–LiCl–KCl)1 − x − y spectral patterns with the same characteristics as those of NdCl2. There was only a slight difference in the Raman shifts. We assume that during the dissolution process of Ce and CeCl3 in the alkali halide, eutectic CeCl2 was formed as an intermediate. In our samples these bands disappeared after ca. 45 min and only the octahedron band remained visible. Under equilibrium conditions the excess electrons do not form Raman identifiable species in the wavenumber range studied. This is in agreement with the concept that the excess electrons of the cerium system occupy extended band states.Acknowledgements
We thank L. Rycerz, Institute of Inorganic Chemistry, Technical University of Warsaw, Poland, for the preparation and supply of the rare earth halides. Recording and interpretation of the powder X-ray diffractogram by H. Henke and H. Bärnighausen, Institute of Inorganic Chemistry, University of Karlsruhe, is gratefully acknowledged. Thanks also to W. Freyland and O. Terakado for support and fruitful discussions. V. R.-B. gratefully acknowledges a scholarship through DAAD-CONACyT. This work was supported through DFG-SFB 195 (Electron localization in macroscopic and microscopic systems).References
-
M. A. Bredig, in Molten Salt Chemistry, ed. M. Blander, Wiley Interscience, New York, 1964, p. 367 Search PubMed
.
-
W. Freyland, in Metal Insulator Transitions Revisited, ed. P. P. Edwards and C. N. R. Rao, Taylor and Francis, London, 1995, p. 167 Search PubMed
- D. Nattland, B. v. Blanckenhagen, R. Juchem, E. Schellkes and W. Freyland, J. Phys.: Condens. Matter, 1996, 8, 9309 CrossRef CAS
- B. v. Blanckenhagen, D. Nattland, Kiran Bala and W. Freyland, J. Chem. Phys., 1999, 110, 2652 CrossRef
- A. S. Dworkin, H. R. Bronstein and M. A. Bredig, J. Phys. Chem., 1963, 67, 2715 CAS
- O. Terakado, S. Zein El Abedin, F. Endres, D. Nattland and W. Freyland, J. Non-Cryst. Solids, 2002, 312–314, 459 CrossRef CAS
- S. Zein El Abedin, O. Terakado, F. Endres, D. Nattland and W. Freyland, Phys. Chem. Chem. Phys., 2002, 4, 5335 RSC
- O. Terakado, P. D. Poh and W. Freyland, J. Phys,: Condens. Matter, 2003, 15, 1553 CrossRef CAS
- P. Chieux, J. F. Jal, L. Hily, J. Dupuy, F. Leclercq and P. Damay, J. Phys. IV, 1991, 1, C5–3
- S. A. Kirillov, E. A. Pavlatou and G. N. Papatheodorou, J. Chem. Phys., 2002, 116, 9341 CrossRef CAS
- R. Steininger and W. Freyland, Z. Phys. Chem., 2000, 214, 541 Search PubMed
- B. Børresen, G. A. Voyiatzis and G. N. Papatheodorou, Phys. Chem. Chem. Phys., 1999, 1, 3309 RSC
- G. N. Papatheodorou, Inorg. Nucl. Chem. Lett., 1975, 11, 483 CrossRef CAS
-
G. N. Papatheodorou, in Progress in molten salt Chemistry 1, ed. R. W. Berg and H. A. Hjuler, Elsevier, Paris, 2000, p. 65 Search PubMed
-
G. M. Photiadis, G. A Voyiatzis and G. N. Papatheodorou, Molten Salts Forum, Trans Tech Publications, Aedermannsdorf, Swizzerland, 1993, vol. 1–2, p. 183 Search PubMed
- G. M. Photiadis, B. Børresen and G. N. Papatheodorou, J. Chem. Soc., Farad. Trans., 1998, 94, 2605 RSC
-
B. Børresen, V. Dracopoulos, G. M. Photiadis, B. Gilbert and G. N. Papatheodorou, Proc. 10th Intl Symp. Molten Salts, Los Angeles, 1996, vol. 7, p. 11 Search PubMed
- V. Dracopoulos, B. Gilbert and G. N. Papatheodorou, J. Chem. Soc., Faraday Trans., 1998, 94, 2601 RSC
- M. Gaune-Escard, A. Bogacz, L. Rycerz and W. Szczepaniak, Thermochim. Acta, 1994, 236, 67 CrossRef CAS
-
J. M. Haschke, in Handbook of the Physics and Chemistry of Rare Earths, Non-Metallic Compounds II, ed. K. A. Gschneider and L. Eyring, North-Holland, Amsterdam, 1979, vol. 4, pp. 89–151, especially p. 119 Search PubMed
- L. F. Druding and J. D. Corbett, J. Am. Chem. Soc., 1961, 83, 2462 CrossRef CAS
- A. Lumpp and H. Bärnighausen, Z. Kristallogr., 1988, 182, 174
-
A. Lumpp, PhD Thesis, University of Karlsruhe, 1988, drei-ECK-Verlag U. Löchner, Düsseldorf, ISBN 3-923161-21-2
- E. Pavlatou, P. A. Madden and M. Wilson, J. Chem. Phys., 1997, 107, 10 446 CrossRef CAS
- L. F. Druding and J. D. Corbett, J. Am. Chem. Soc., 1959, 81, 5512 CrossRef CAS
- G. Meyer and T. Schleid, Z. Anorg. Allg. Chem., 1985, 528, 55 CAS
- K. R. Kvam, D. Bratland and H. A. Øye, J. Mol. Liq., 1999, 83, 111 CrossRef CAS
- F. N. T’en and I. S. Morozov, Russ. J. Inorg. Chem., 1969, 14, 1179
- H. Mediaas, G. Photiadis, G. N. Papatheodorou, J. E. Vindstad and T. Østvold, Acta Chem. Scand., 1997, 51, 8 CAS
-
O. Terakado, PhD Thesis, University of Karlsruhe, 2002, available on the net at http://www.ubka.uni-karlsruhe.de
- V. G. Keramidas and W. B. White, J. Chem. Phys., 1973, 59, 1561 CrossRef
- W. H. Weber, K. C. Hass and J. R. McBride, Phys. Rev. B, 1993, 48, 178 CrossRef CAS
- J. E. Spanier, R. D. Robinson, F. Zhang, S.-W. Chan and I. P. Herman, Phys. Rev. B, 2001, 64, 245407 Search PubMed
| This journal is © the Owner Societies 2005 |