Thiogermanate glasses—influence of the modifier cation—a combined XPS and theoretical study
D.
Foix
a,
H.
Martinez
a,
D.
Gonbeau
*a,
D.
Granier
b,
A.
Pradel
b and
M.
Ribes
b
aLaboratoire de Chimie Théorique et Physicochimie Moléculaire UMR 5624, 2 avenue du Président Angot, 64053, Pau Cedex 9, France. E-mail: danielle.gonbeau@univ-pau.fr; Fax: +33 5 59 40 76 22; Tel: +33 5 59 40 76 21
bLaboratoire de Physicochimie de la Matière Condensée UMR 5617, CC 3 Université Montpellier II, 34095, Montpellier Cedex 5, France
First published on 18th November 2004
Abstract
The structure and electronic structure of a series of thiogermanate glasses has been investigated by means of X-ray photoelectron spectroscopy (XPS) and ab initio calculations with optimisation of geometrical parameters. The study has been focused on the influence of the content and nature of the modifier. On the whole it was shown that the modifier cation induces important electronic redistribution in the glassy matrix which extends to all sulfide atoms, either bridging or non-bridging, the evolution being all the more important that the modifier content is high. The present results evidence an important influence of the nature of the modifier cation; for silver glasses more covalent M–S bonds, less negative sulfur atoms and a more homogeneous electronic distribution on sulfur atoms are observed as compared to sodium glasses.
1. Introduction
Several industrial applications find their origin in the existence of ion diffusion in glasses. One can cite the strengthening of glass surfaces and the fabrication of waveguides for (integrated) optical devices, both based on ion exchange processes, the fabrication of chemical (micro-)sensors (ion selective electrodes, for example), the realisation of solid state (micro-)batteries for energy storage based upon the use of a glassy electrolyte.Chalcogenide glasses have a choice place in the large family of glasses owing to two of their properties, i.e. a remarkable conductivity when silver, copper or alkaline ions are incorporated in the glassy network and exceptional optical properties (IR transparency, photosensitivity, giant photo-expansion, etc.). For example, the best Li+ conducting electrolytes with a room temperature conductivity of 10−3 Ω−1 cm−1 belong to this family.1 Takada et al.2 have shown recently that some chalcogenide and oxychalcogenide glasses or glassy ceramics with very high conductivity could also exhibit a high chemical stability against high potential electrode. Such glasses were used to build up an all solid-state battery with interesting electrochemical stability, in particular a good cyclability.
Even though one can assume that a relationship between the glass structure and its electrical properties exists by analogy with crystalline solids for example, there is not yet a direct answer to the question: how can one link together structure and electrical properties in glasses? Only partial answers have been proposed to date.3
Different approaches have been used to get a better insight in both the structural characteristics and the diffusion properties. Conductivity, diffusion and NMR spin relaxation measurements have been carried out to investigate the cation dynamics.4–10 Neutron diffraction, NMR, XPS, Raman and infrared spectroscopy have been used to probe the local (short range order) and intermediate (medium range order) orders that exist in chalcogenide glasses.11–17
X-ray photoelectron spectroscopy (XPS) is one of the methods able to yield information not only on the local structure but also on the electronic structure of materials. In previous papers.18–20 XPS has been successfully used to study different families of chalcogenide glasses (thioborate, thiosilicate, thiogermanate and thioarseniate glasses).
The aim of the present paper is to emphasise the role of the nature of the modifier (Ag,Na) in thiogermanate glasses. In order to support and precise the experimental data obtained by XPS, ab initio MO studies on the structural and electronic changes in sulfide glasses when changing the nature of the modifier have also been performed for the first time with optimisation of geometrical parameters.
2. Experimental details
2.1. Sample preparation
Glasses with adequate compositions were synthesised in evacuated silica tubes from previously prepared GeS2 and M2S (M = Na, Ag) following a procedure already described.4,12,21 X-ray diffraction measurements revealed no indication of crystalline impurities in the samples.2.2. XPS
The XPS analysis were performed with a Surface Science Instruments spectrometer (model 301) using focused (diameter of the irradiated area = 300 or 600 μm) monochromatised Al–Kα radiation (1486.6 eV). The residual pressure inside the analysis chamber was ca. 5 × 10⁻⁸ Pa. The spectrometer was calibrated by using the photoemission lines of Au (Au 4f7/2 = 83.9 eV, with reference to the Fermi level) and Cu (Cu2p3/2 = 932.5 eV); for the Au 4f7/2 line the FWHM (full width at half maximum) was 0.86 eV under the recording conditions. The peaks were recorded with a constant pass energy of 50 eV.To avoid any contamination, the fresh surfaces of the samples were analysed just after being fractured in an ultra high vacuum (5 × 10⁻⁸ Pa) or after a fine grinding in the glove box. Neutralisation of the surface charge was performed using a low energy flood gun. It is to be noted that all glasses have been analysed as fractured samples leading usually to more resolved spectra than grinded powders.
The reproducibility of the measurements was checked on different fractures or grinding on several samples and by further XPS analysis. The binding energy scale was calibrated using the C(1s) line (284.6 eV) from the carbon contamination (an atomic percentage of about 8% has always been determined); an oxygen atomic percentage of about 6% for the powders and 2% for each fractured sample was obtained.
The XPS signals were analysed by using a peak synthesis program in which a non-linear background is assumed22 and the fitting peaks of the experimental curve are defined by a combination of Gaussian (80%) and Lorentzian (20%) distributions.
In the case of doublets S(2p) the curve fits have been obtained using fixed amplitude ratios (2p3/2/2p1/2 = 2), spin splits (2p1/2 − 2p3/2 = 1.2 eV) and FWHM (2p3/2/2p1/2 = 1) ratios. It must be noted that a minimum number of doublets was always used in order to fit the experimental curves.
2.3. Theoretical calculations
Considering our objectives, aiming at improving the knowledge of electronic structure of chalcogenide glasses, we chose to work at a first atomic scale level of description, with studies on cluster models.The ab initio calculations were carried out with the GAUSSIAN-98 series of programs;23 they were performed in an ab initio Hartree–Fock formalism, by using the LANL2DZ basis set with a Los Alamos ECP.24,25 The geometrical parameters were optimised by a gradient method.
The first step was the construction of a cluster representative of each glass, as the starting point of the optimisation process.
From the crystalline structures of GeS226 and Na2GeS3,27 a representative cluster was defined for GeS2 glass and Na2GeS3 glass; details on the clusters are given hereafter.
Cluster modelling was more difficult in the case of Na2S–3GeS2 due to the lack of homologue crystalline phase. However for Na2S–3GeS2, according to the stoichiometry and respecting a reasonable chemical environment for the different atoms as well as the electroneutrality of the model, a cluster Na7Ge7S22H7 was built. In that initial geometry, each nbS atom has three sodium atoms in its first co-ordination sphere, each bS atom being close to one alkali atom. Cluster modelling Ag2GeS3 glass (Ag10Ge5S18H6) was built with a chainlike structure, on the basis of pieces of information provided by neutron diffraction measurements on Ag–Ge–S glasses16 by structural data on Ag8GeS628 and Ag2GeS329,30. Note that crystalline phase of Ag2GeS3 has been reported by Nagel and Range.29 and Moh.30 Both groups reported that the phase is a metastable one and never obtained pure but rather present in a mixture. The authors have determined the cell parameters from powder diffraction data but a complete and reliable resolution of this phase was not carried out. One would need to synthesize single crystals which are not easy to achieve.
Then, the “surface” sulfur atoms of these model clusters were terminated by hydrogen atoms to satisfy electroneutrality.
The last step was the optimisation of the geometrical parameters which was carried out for each cluster.
3. Results and discussion
3.1. XPS analysis
A preliminary study on reference compounds (cubic α-GeS2, Na2S, Ag2S) has been performed previously;20 in addition, crystalline Na2GeS3 was examined. The XPS data are reported in Table 1.• in GeS2α (orthorhombic lattice, space group Fdd226) every germanium atom is tetrahedrally linked to four sulfur atoms and the different tetrahedra are corner-sharing, leading to a three-dimensional network. The well resolved S2p doublet (162.8–164.0 eV) agrees with the existence of a single type of sulfur atoms (bridging sulfur bS) in this compound.
• Na2S 31,32 has an antifluorite type structure and Ag2S 33 has a monoclinic one (acanthite). For these two modifiers, the single doublet observed for the S2p peak is in agreement with the structural data.
The shifts relative to elemental sulfur (164.0–165.2 eV) are consistent with the more negative sulfurs of the modifiers compared to GeS2, especially in the case of Na2S. Indeed, it is well established that the binding energies determined by XPS for the core electrons of an atom depend on the chemical state of the atom; generally, an increase in the negative charge on the ionised atom leads to a lowering of its core binding energy.
• The structure of Na2GeS3 (monoclinic lattice, space group P21/c27) is formed by infinite chains of corner-sharing tetrahedra, centred on germanium atoms.
The local environments characteristics of Na2GeS3 crystal are:
• Ge atoms are 4-co-ordinated; they are the centre of tetrahedra, formed by four sulfur atoms which are of two kinds: bridging and non-bridging sulfur atoms.
• non-bridging sulfur atoms, taking part in only one Ge–S bond, and being 4- or 5-co-ordinated by sodium atoms.
• bridging sulfur atoms, taking part in two Ge–S bonds and being 2-co-ordinated by sodium atoms.
• the sodium are 5- or 6-co-ordinated with sulfur atoms.
For this compound, a decomposition of the large S2p peak (Fig. 1) needs at least two doublets in order to fit the experimental curve:
• the 160.5–161.7 eV doublet (1) is attributed to non-bridging sulfur atoms (nbS).
• the 161.3–162.5 eV doublet (2) corresponds to bridging sulfur atoms (bS).
It is of interest to note that the relative magnitudes of the two doublets (nbS:67%–bS:33%) are in very good agreement with the compound stoichiometry.
 | ||
| Fig. 1 S2p core peaks for α-GeS2, Na2S, Ag2S and Na2GeS3; doublet 1-1:nbS; doublet 2-2:bS. | ||
| Compounds | E b Ge3p3/2−1/2/eV | E b S2p3/2−1/2/eV | Relative atomic percentages |
|---|---|---|---|
| α-GeS2 | 124.2 (2.7)–128.4 (2.7) | 162.8 (1.0)–164.0 (1.0) | bS:100% [100%] |
| Na2S | 160.0 (1.0)–161.2 (1.0) | ||
| Ag2S | 161.1 (1.0)–162.3 (1.0) | ||
| 0.25 Na2S–0.75 GeS2 (Na2S–3GeS2) | 123.8 (2.7)–128.0 (2.7) | 161.5 (1.0)–162.7 (1.0) | nbS:32% [29%] |
| 162.5 (1.0)–163.7 (1.0) | bS:68% [71%] | ||
| 0.50 Na2S–0.50 GeS2 (Na2GeS3) | 123.0 (2.7)–127.2 (2.7) | 160.5 (1.2)–161.7 (1.2) | nbS:67% [67%] |
| 161.3 (1.2)–162.5 (1.2) | bS:33% [33%] | ||
| 0.25 Ag2S–0.75 GeS2 (Ag2S–3GeS2) | 123.6 (2.9)–127.7 (2.9) | 161.5 (1.3)–162.7 (1.3) | nbS:28% [29%] |
| 162.0 (1.3)–163.2 (1.3) | bS:72% [71%] | ||
| 0.50 Ag2S–0.50 GeS2 (Ag2GeS3) | 123.6 (2.8)–127.8 (2.8) | 161.5 (1.0)–162.7 (1.0) | nbS:66% [67%] |
| 162.0 (1.0)–163.2 (1.0) | bS:33% [33%] |
 | ||
| Fig. 2 S2p core peaks for xNa2S-(1 − x)GeS2 and xAg2S-(1 − x)GeS2 (x = 0.25, 0.5) glasses; doublet 1, 1:nbS; doublet 2, 2:bS. | ||
For the x = 0.25 composition, the S2p peak shape clearly shows the presence of two types of sulfur atoms. On the basis of the data obtained for GeS2 and Na2S, we can attribute the doublet (1) (161.5–162.7 eV) on the low binding energy (BE) side to nbS atoms, and the doublet (2) (162.5–163.7 eV) on the high BE side to bS atoms. To our knowledge, this result corresponds to the clearest discrimination of two types of bridging and non-bridging sulfur atoms in sulfide glasses.
For the x = 0.5 composition, the increase of alkali content in the glassy structure leads to a shift toward the lower BE side for the S2p and Ge3p peaks; no significant variation is observed for the Na1s core peak (1071.0 eV). A clear evolution of the S2p peak shape is observed when x increases. As previously, the doublets are attributed by comparison with reference materials. The doublet (1) (160.5–161.7 eV) corresponds to nbS atoms while the doublet (2) (161.3–162.5 eV) is attributed to bS atoms.
For both compositions, the proportion between bridging and non-bridging sulfur atoms is in good agreement with expected values; the increase of the modifier content results in an increase of nbS atoms.
It is also to be noted that very similar S2p peaks are observed for Na2GeS3 crystal and glass; this result suggests similar chemical environments for sulfur atoms in both compounds.
For both compositions x = 0.25 and 0.5, a decomposition of the S2p peak in at least two doublets is necessary in order to fit the experimental curve. By reference with the results obtained for GeS2 and Ag2S, the lower BE doublet is attributed to the nbS atoms and the higher BE doublet to the bS atoms. No variation of the BE of S2p, Ge3p and Ag3d5/2 (BE: 368 eV) core peaks is observed when x increases. The evolution of the S2p peak shape between the two compositions corresponds to a variation of the relative proportion of the different sulfur atoms; this result reveals an increase of the number of nbS atoms when x increases.
For both compositions, the proportion between bridging and non-bridging sulfur atoms is in good agreement with theoretical values.
• an increase of nbS atoms when increasing the amount of modifier content is observed for all the glasses
• the energy splitting between bS and nbS doublets is clearly smaller in the case of silver glasses (0.5 eV) compared to sodium glasses (0.8 eV). It suggests a more homogeneous electronic distribution on sulfur atoms in the silver glasses than in the sodium glasses.
• considering the BE values, more negative sulfur atoms (nbS and bS) are expected for sodium glasses than for silver glasses.
• the difference Δ[BE(S2p)–BE(Ge3p)] informs on the electronic redistribution along Ge–S bonds. Compared to GeS2, a clear decrease in this difference is observed in the case of nbS atoms for both sodium and silver glasses. Such a variation is more important in sodium glasses (∼1.1 eV) than in silver glasses (∼0.7 eV).
3.2. Theoretical calculations
In order to support the experimental results and assess their precision, ab initio calculations were performed on model clusters with optimisation of geometrical parameters.To validate the method, the first calculations were performed on cluster modelling compounds for which the crystalline structure was totally defined, α-GeS2 and Na2GeS3. It was then possible to compare the optimised parameters to the experimental ones and to test the coherence of the calculation results.
Then, the development of the structural characteristics of thiogermanate glasses was analysed throughout two important parameters as pointed out by the experimental results:
• the content of the modifier through the study of the Na2S–3GeS2 and Na2GeS3 glasses.
• the nature of the modifier through the study of the Na2GeS3 and Ag2GeS3 glasses.
In addition to the determination of structural characteristics, the ab initio calculations allowed us to examine the charge distribution on atoms through a Mulliken population analysis, a widely used approach for qualitative comparisons in series of compounds.
GeS2. Different sizes for a representative cluster of α-GeS2 can be chosen, and an important step in our approach was checking the influence of the cluster size on the obtained results.
On the basis of the crystal structure of GeS2 two clusters, i.e. Ge5S14H8 (shown in Fig. 3) and Ge13S34H16, were defined. A geometry optimisation was realised for both clusters, the whole geometrical parameters being optimised excepted the most external S–H bond lengths. Increasing the cluster size induced only small changes in bond lengths (∼0.02 Å) and in angles (∼1° to 2°); so, for a clearest presentation, only the optimised results obtained for the cluster Ge5S14H8 are compared to the data obtained for the crystalline compound (Table 2).
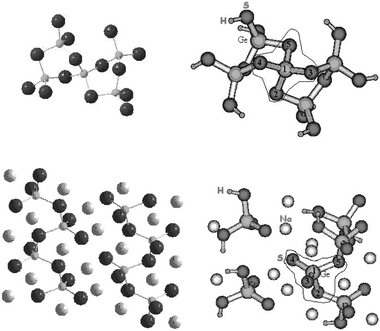 | ||
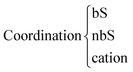
| Fig. 3 Representative clusters for GeS2 (Ge5S14H8 fragment) and Na2GeS3 (Na12Ge6S22H8) glasses; the representative part of the clusters is circled. | ||
The optimised geometry revealed a lengthening of the inter-atomic distances Ge–S and Ge–Ge in the cluster compared to the crystal. While the value range for the angles S–Ge–S was approximately the same in the optimised geometry and in the crystalline structure, an opening of the sulfur angle Ge–S–Ge was observed after optimisation. It is to be noted that due to calculation conditions (for example the quality of the basis set) one can expect some overestimation of the variations.
However, on the whole, the lengthening of bond lengths and the opening of angles are consistent with the idea of a more important free volume in a glassy phase.
Na2GeS3. A detailed analysis of the crystal structure of Na2GeS3 was done in order to build up a cluster modelling Na2GeS3 glass. The similarity of XPS data for the crystal and the glass allowed us to consider similar local environments for the different atoms. The cluster Na12Ge6S22H8 (shown in Fig. 3) was defined respecting, in its representative part, the co-ordination of the different atoms. To respect the electroneutrality of the cluster, appropriate numbers of charge compensating sodium atoms were introduced.
This initial geometry was optimised and the results are reported in Table 3, with the characteristics of the crystalline structure of Na2GeS3.
| Crystal Na2GeS3 | Representative cluster for Na2GeS3 glass | |
|---|---|---|

|
2Na + 2Ge | 1/2Na + 2Ge |
| 4/5Na + 1Ge | 3/4Na + 1Ge | |
| 4/5nbS + 1bS | 3nbS + 1bS | |
| Ge–bS/Å | 2.22–2.25 | 2.30–2.32 |
| Ge–nbS/Å | 2.15–2.18 | 2.25–2.26 |
| Ge–Ge/Å | 3.73 | 3.81–3.95 |
| Na–bS/Å | 2.76–3.07 | 3.00–3.21 |
| Na–nbS/Å | 2.80–3.09 | 2.71–3.12 |
| Ge–bS–Ge/° | 113.3 | 111.2–113.5 |
| S–Ge–S/° | 96.5–116.5 | 105.1–116.7 |
Several comments can be made about the optimised results:
• sodium atoms stay not only close to non-bridging sulfur atoms but also to bridging sulfur atoms.
• a decrease in the alkali atom co-ordination numbers is noted.
• a decrease in the sulfur atom co-ordination numbers is observed. The difference between the two types of sulfur atoms still exists (three or four sodium atoms close to non-bridging sulfur atoms while one or two are close to bridging sulfur atoms).
• a lengthening of both Ge–nbS and Ge–bS bonds occurs; the Ge–nbS distance being shorter (2.25 Å) than the Ge–bS one (2.31 Å).
• an average value for the Na–nbS distances similar (2.9 Å) in the cluster and the crystal while a lengthening of the Na–bS distances is observed (cluster: 3.1 Å; crystal: 2.9 Å).
• the value for sulfur angle Ge–bS–Ge is similar in the cluster and the crystal while the average value of the germanium angle S–Ge–S increases.
The lattice relaxation observed for the representative cluster of GeS2 as compared to the crystal structure is also observed for the representative cluster of Na2GeS3.
The observed differences between crystalline GeS2 and Na2GeS3 still exist when the representative clusters of the vitreous compounds are compared. The Ge–bS bonds are always longer in Na2GeS3 than in GeS2 whereas the Ge–nbS bonds are shorter. Previous works34 on silicate glasses had also pointed out a Si–O distance in SiO2 comprised between the Si–bO and Si–nbO distance values in sodium silicate glasses.
Ag2GeS3. On the whole, the same comments could be done if we compare the crystalline phase using Nagel and Range’s29 data and the optimised results in cluster model for Ag2GeS3 (Table 4):
• Silver atoms stay not only close to nbS atoms but also to bS in crystalline structure as in the cluster.
• Some decrease in the silver atoms co-ordination is noted for the cluster (cluster: 2 nbS + 1bS / crystal: 3nbS + 1bS); similar co-ordinations are observed for sulfur atoms for crystalline phase and cluster.
• The Ge–bS and Ge–nbS bonds are always shorter in the crystalline phase than in the cluster (Ge–bS: crystal 2.14–2.35 Å, cluster: 2.38–2.46 Å/Ge nbS:crystal 2.15–2.26 Å, cluster 2.36, 2.43 Å).
• A value for the shorter Ag–nbS distance rather similar in the cluster (2.70 Å) and the crystal (2.69–2.74 Å) while a lengthening of Ag–bS distances is observed (crystal: 2.37 Å, cluster: 2.85 Å (mean value)).
• The angle average value for Ge–bS–Ge increases (by about 5°) in the cluster compared to the crystal, while the average value of germanium angle S–Ge–S is still similar.
| Optimised results in cluster model | ||||
|---|---|---|---|---|
| GeS2 | Na2S–3GeS2 | Na2GeS3 | Ag2GeS3 | |
|
1Na + 2Ge | 1/2Na + 2Ge | 1/2Ag + 2Ge | |
| 2Na + 1Ge | 3/4Na + 1Ge | 3/4Ag + 1Ge | ||
| 2/3nbS + 1bS | 3nbS + 1bS | 2nbS + 1bS | ||
| Ge–bS/Å | 2.26–2.29 | 2.28–2.34 | 2.30–2.32 | 2.38–2.46 |
| Ge–nbS/Å | 2.22 | 2.25–2.26 | 2.36–2.43 | |
| Ge–Ge/Å | 3.68–3.81 | 3.76–3.91 | 3.81–3.95 | |
| Cation–bS/Å | 3.02–3.22 | 3.00–3.21 | 2.69–3.00 | |
| Cation–nbS/Å | 2.82–2.85 | 2.71–3.12 | 2.73–3.30 | |
| Ge–bS–Ge/° | 109.3–110.4 | 108.1–115.5 | 111.2–113.5 | 103.3–109 |
| S–Ge–S/° | 105.7–111.9 | 103.5–117.5 | 105.1–116.7 | 103.5–113.7 |
It is interesting to note that, even for the low modifier content (x = 0.25), the optimisation process maintains the sodium atoms near nbS atoms (2/3 sodium atoms) but also near bS ones (1 sodium atom).
Moreover, a progressive lengthening of the Ge–bS bonds is observed when changing from GeS2 to Na2S–3GeS2 and to Na2GeS3. Such a lengthening is also perceptible for the Ge–nbS bond when changing from Na2S–3GeS2 to Na2GeS3; the same observation is done concerning the Ge–Ge distances.
The net charges on both bS and nbS atoms are more negative in Na2S–3GeS2 (qnbS = −0.72, qbS = −0.52) than in GeS2 (qbS = −0.43) (Fig. 4), the charge on nbS atoms being higher than on bS ones; the negative character increases with the sodium content (Na2GeS3: qnbS = −0.87, qbS = −0.67). However, the difference between the net charges of the two kinds of atoms does not change with x.
 | ||
| Fig. 4 Ab initio calculations (LANL2DZ) on GeS2, Na2S–3GeS2, Na2GeS3 and Ag2GeS3 clusters. Mulliken population analysis: total net charges (only the charges on the most representative part of the clusters are reported). | ||
Only a weak evolution of the germanium net charge is observed when changing from GeS2 and the two sodium glasses.
The important positive net charges on sodium agree with the well known positive character of this atom.
It is interesting to compare these results with the XPS data obtained for the S2p and Ge3p core peaks.
A clear distinction of two doublets was observed for the S2p peak for the Na2S–3GeS2 glass, allowing us to consider different chemical environments and different charges for the two kinds of sulfur atoms. The geometry optimisation results and the Mulliken population analysis confirm the experimental conclusion.
For Na2GeS3, two doublets are also distinguished, at lower binding energy than for Na2S–3GeS2. The Mulliken population analysis is consistent with these experimental results, the net charges on sulfur atoms being more negative for Na2GeS3 than for Na2S–3GeS2.
The important chemical shift observed for the Ge3p core peak when x increases, cannot be understood on the basis of the small charge evolution calculated by the Mulliken population analysis. Actually, that shift can be interpreted as follow: a photoelectron coming from a germanium atom will feel, during its ejection out of the solid, the influence of the increased negative charge on the sulfur atoms, its first neighbours. This phenomenon induces a chemical shift higher than what could result of a correlation with the charge of the ionised germanium atom.
This whole analysis evidenced that increasing modifier content will tend to enhance the cation-anion interactions, for non-bridging sulfur atoms as for bridging ones. Moreover, no homogenisation of electronic structure is observed, a constant difference existing between the charges of bridging and non-bridging sulfur atoms in Na2S–3GeS2 and Na2GeS3.
The comparison between the optimised geometry for the glasses Na2GeS3 and Ag2GeS3 (Table 4) highlight different points:
• bond lengths are longer in Ag2GeS3 than in Na2GeS3; it is interesting to note that the value ranges for the distances Ge–bS and Ge–nbS are not distinct anymore in Ag2GeS3.
• the angles, particularly Ge–bS–Ge, have lower values in Ag2GeS3 than in Na2GeS3.
• the sulfur atom co-ordination is similar in both glasses. However, the silver atoms have a lower co-ordination than the sodium ones.
It is interesting to compare the obtained results for Ag2GeS3 to the results deduced from neutron diffraction measurements on Ag2GeS3 glass.16 The distances Ge–S and Ag–S are slightly longer for the cluster (Ge–S mean value: 2.4 Å; Ag–S mean value: 2.8 Å) than the ones determined by neutron diffraction (Ge–S: 2.2 Å; Ag–S: 2.5 Å). In both cases, an average co-ordination of 3 is observed for silver atoms. However, even if we can note a distortion of the tetrahedra in Ag2GeS3 compared to Na2GeS3, the S–Ge–S angle values remain higher than the average value obtained by neutron diffraction (76°).
The most interesting results concern the charges on sulfur atoms (Fig. 4):
• sulfur atoms, particularly non-bridging ones, are more negative in Na2GeS3 (qnbS ∼ −0.87) than in Ag2GeS3(qnbS ∼ −0.73), each one being clearly more negative than in GeS2 (qbS ∼ −0.43); the observed evolution for the S2p binding energy suggests the same trend.
• for both clusters, a difference appears between bridging and non-bridging sulfur atoms; the difference is clearly smaller for Ag2GeS3 (qbS Na2GeS3 ∼ −0.67 , qbS Ag2GeS3 ∼ −0.64). These results are consistent with the XPS conclusions of a more homogeneous electronic distribution in the case of Ag2GeS3 than for Na2GeS3, and more negative sulfur atoms in the last compound.
The net charge of the metal atom reflect the strong electropositive character of sodium atoms compared to silver ones. However, no significant variation is observed concerning the germanium atoms, clearly showing the limit of the correlation ΔEb ↔ q (binding energy variation ↔ charge of ionised atom).
4. Discussion
The theoretical analysis, on the basis of representative clusters of glasses Na2GeS3 and Ag2GeS3 has allowed us to show the importance of the nature of the modifier cation on the structural and electronic characteristics of these systems.Concerning the structural characteristics, the peculiarity of the Ag+ cation and more generally of d10 cations, compared to alkali cations is well known; the d10 cations can find their stability in environments of lower co-ordination than the alkali cations.
The origin of that difference has been the subject of great controversy. For some authors, the low degree of co-ordination is tightly linked to what is described as hybridisation or mixing between full d orbitals and empty s ones of metal. This phenomenon is related to a weak energetic separation between d and s orbitals. This interpretation, based on a d/s hybridisation, has been evoked for a long time35 and classical works36 refer to it. The importance of that factor is also reported in more recent works.37,38
For others,39 the determining factor for the Ag+ cation stability in low co-ordination environments is the energetic separation between metal d orbitals and ligand p orbitals and the resulting Md–Lp interactions.
Besides these structural characteristics relative to cations, a more specific aspect of our study concerns the anions and the evolution of the electronic distributions on these anions according to the nature of the modifier cation. The results obtained through the Mulliken population analysis appeared consistent with the conclusions deduced from the XPS study. They can be interpreted with a qualitative scheme of orbital interactions deduced from the theoretical calculations, which takes into account the d/s mixing and Md–Lp energetic differences. These qualitative schemes are presented in Fig. 5 for Na2GeS3 and Ag2GeS3. In these systems, the main interaction responsible for the electronic transfer takes place between the s metal orbital and the 3p orbital of sulfur atoms. This interaction is responsible for the M+–L− polarity.
 | ||
| Fig. 5 Schematic view of the (qualitative) M–S interactions in Na2GeS3 and Ag2GeS3 glasses. | ||
Two elements contribute to enhance the M–L interaction in Ag2GeS3 compared to Na2GeS3:
• on the one hand, a lower energetic position for 5s orbitals of silver atoms than for 3s orbitals of sodium atoms.
• on the other hand, the existence of full d orbitals with a strong directional character in the silver compounds.
The increase in the interaction induces a stronger covalent character to the M–S bond and less negative sulfur atoms in the case of silver glasses compared to sodium glasses. The spatial distribution of d orbitals, through the 4d/5s mixing, favours not only the Ag–nbS interactions but also the Ag–bS ones, contributing then to the homogenisation of the electronic distribution on sulfur atoms.
5. Conclusion
The aim of the paper was to investigate the structure and electronic structure of thiogermanate glasses by both X-ray photoelectron spectroscopy and ab initio calculations. The influence of the modifier cation (either sodium or silver) was more particularly examined. A clear discrimination between bridging (bS) and non-bridging (nbS) sulfur atoms was observed by XPS. The comparison of the XPS spectra for sodium and silver thiogermanate glasses indicates a smaller splitting between bS and nbS doublets in the case of silver glasses suggesting a more homogeneous electronic distribution on sulfur atoms in these glasses. The values of binding energies suggest more negative sulfur atoms, either bS or nbS, for sodium glasses. Ab initio calculations on cluster models with optimisation of geometrical parameters were performed to support the experimental results. The analysis of the optimised geometrical parameters for the cluster modelling Na2GeS3 glass indicates an increase of the Ge–S and Ge–Ge bond lengths and a decrease in the co-ordination number of the sulfur atoms as compared to those existing in crystalline Na2GeS3. According to a Mulliken population analysis the introduction of the modifier in the glassy network leads to an increase of the negative charge on both bS and nbS atoms, the evolution being all the more important that the modifier content is high. In the cluster modelling Ag2GeS3, the distinction bS/nbS is clearly less pronounced than in the cluster modelling the sodium glass. Moreover, the calculations helped in showing that the major M–S interaction driving the electronic transfer occurs between Ms and S3p orbitals. In the case of Ag2GeS3, the M d/s hybridisation increases the Ms–S3p interaction with the consequence of more covalent M–S bonds, less negative sulfur atoms and a more homogeneous electronic distribution on sulfur atoms than in the sodium glasses.Acknowledgements
The authors thank the IDRIS (Institut du Développement et des Ressources en Informatique Scientifique) for allowing computer time in order to perform these calculations.References
- A. Pradel and M. Ribes, Solid State Ionics, 1986, 351, 18.
- K. Takada, T. Inada, A. Kajiyama, H. Sasaki, S. Kondo, M. Watanabe, M. Murayama and R. Kanno, Solid State Ionics, 2003, 269, 158.
- M. Ribes, E. Bychkov and A. Pradel, J. Optoelectron. Adv. Mater., 2001, 3(3), 665 Search PubMed.
- J. L. Souquet, E. Robinel, B. Barrau and M. Ribes, Solid State Ionics, 1981, 317, 3.
- K. H. Kim, D. R. Torgeson, F. Borsa, J. Cho, S. W. Martin and I. Svare, Solid State Ionics, 1996, 7, 91.
- A. Pradel and M. Ribes, J. Non Cryst. Solids, 1991, 1063, 131.
- R. Belin, G. Taillades, A. Pradel and M. Ribes, Solid State Ionics, 2000, 1025, 136.
- E. Bychkov, A. Bychkov, A. Pradel and M. Ribes, Solid State Ionics, 1998, 691, 113.
- E. Bychkov, Solid State Ionics, 2000, 1111, 136.
- Yu. Drugov, V. Tsegelnik, A. Bolotov, Yu. Vlasov and E. Bychkov, Solid State Ionics, 2000, 1091, 136.
- B. Barrau, M. Ribes, M. Maurin, A. Kone and J. L. Souquet, J. Non-Cryst. Solids, 1980, 1, 37.
- E. I. Kamitsos, J. A. Kapoutsis, G. D. Chryssikos, G. Taillades, A. Pradel and M. Ribes, J. Solid State Chem., 1994, 255, 112.
- P. Armand, E. Philippot, A. Ibanez, J. M. Tonnerre, D. Raoux and B. Bouchet-Fabre, J. Non-Cryst. Solids, 1995, 330, 192.
- H. Nasu, Z. H. Zhou, T. Hashimoto and K. Kamiya, J. Non-Cryst. Solids, 1997, 61, 215.
- J. H. Lee, A. P. Owens, A. Pradel, A. C. Hannon, M. Ribes and S. R. Elliott, Phys. Rev. B, 1996, 54, 3895 CrossRef CAS.
- E. Bychkov and D. L. Price, Solid State Ionics, 2000, 1041, 136.
- A. Pradel, G. Taillades, M. Ribes and H. Eckert, J. Non Cryst. Solids, 1995, 75, 188.
- D. Gonbeau, H. Bouih, L. Benoist, G. Pfister-Guillouzo, M. Ménétrier, P. Vinatier and A. Levasseur, Phys. Chem. Glasses, 1998, 39, 167 CAS.
- D. Foix, D. Gonbeau, G. Taillades, A. Pradel and M. Ribes, Solid State Sci., 2001, 235, 3.
- D. Foix, D. Gonbeau, D. Granier, A. Pradel and M. Ribes, Solid State Ionics, 2002, 161, 154.
- B. Barrau, M. Ribes, M. Maurin, A. Kone and J. L. Souquet, J. Non-Cryst. Solids, 1980, 1, 37.
- D. A. Shirley, Phys. Rev., 1972, 5, 4709 Search PubMed.
- M. J. Frisch, G. W. Trucks, H. B. Schlegel, P. M. W. Gill, B. G. Johnson, M. A. Robb, J. R. Cheeseman, T. Keith, G. A. Petersson, J. A. Montgomery, K. Raghavachari, M. A. Al-Laham, V. G. Zakrzewski, J. V. Ortiz, J. B. Foresman, J. Cioslowski, B. B. Stefanov, A. Nanayakkara, M. Challacombe, C. Y. Peng, P. Y. Ayala, W. Chen, M. W. Wong, J. L. Andres, E. S. Replogle, R. Gomperts, R. L. Martin, D. J. Fox, J. S. Binkley, D. J. Defrees, J. Baker, J. P. Stewart, M. Head-Gordon, C. Gonzalez and J. A. Pople, GAUSSIAN 94 (Revision E.3), Gaussian Inc., Pittsburgh PA, 1995 Search PubMed.
- T. H. Dunning, Jr. and P. J. Hay, in Modern Theoretical Chemistry, ed. H. F. Schaefer III, Plenum, New York, 1976, 1 Search PubMed.
- (a) P. J. Hay and W. R. Wadt, J. Chem. Phys., 1985, 82, 270 CrossRef CAS; (b) W. R. Wadt and P. J. Hay, J. Chem. Phys., 1985, 82, 284 CrossRef CAS; (c) P. J. Hay and W. R. Wadt, J. Chem. Phys., 1985, 82, 299 CrossRef CAS.
- W. H. Zachariasen, Z. Kristallogr., 1928, 67, 226 CAS.
- J. Olivier-Fourcade, E. Philippot, M. Ribes and M. Maurin, Rev. Chim. Miner., 1972, 9, 1.
- M. Evain, E. Gaudin, F. Boucher, V. Petricek and F. Taulelle, Acta Crystallogr., Sect. B, 1998, B54, 376 CrossRef CAS.
- A. Nagel and K. J. Range, Z. Naturforsch., B, 1978, 33, 1461.
- G. Moh, Neues Jahrb. Mineral., Abh., 1980, 139, 113 Search PubMed.
- C. T. Prewitt and H. S. Young, Science, 1965, 149, 535 CAS.
- A. Claassen, Recl. Trav. Chim. Pays-Bas, 1925, 44, 790.
- T. J. M. Smith, E. Venema, J. Wiersma and G. A. Wiegers, J. Solid State Chem., 1970, 2, 309 CrossRef.
- T. Uchino, M. Iwasaki, T. Sakka and Y. Ogata, J. Phys. Chem., 1991, 95, 5455 CrossRef CAS.
- L. E. Orgel, J. Chem. Soc., 1958, 4186 RSC.
- F. A. Cotton, G. Wilkinson, in Advanced Inorganic Chemistry, Wiley, Brisbane/New York, 5th edn., 1988, p. 941 Search PubMed.
- J. K. Burdett and O. Eisenstein, Inorg. Chem., 1992, 31, 1762 CrossRef CAS.
- E. Gaudin, F. Boucher and M. Evain, J. Solid State Chem., 2001, 160, 212 CrossRef CAS.
- J. A. Tossel and D. J. Vaughan, Inorg. Chem., 1981, 20, 3333 CrossRef.
| This journal is © the Owner Societies 2005 |