Electroactive layer-by-layer films of heme protein-coated polystyrene latex beads with poly(styrene sulfonate)†
Hong
Sun
ab and
Naifei
Hu
*a
aDepartment of Chemistry, Beijing Normal University, Beijing 100875, China
bSchool of Chemical Engineering, Qingdao University, Qingdao 266071, China. E-mail: hunaifei@bnu.edu.cn
First published on 4th November 2004
Abstract
In this work, a novel two-step construction strategy for protein layer-by-layer assembly films was proposed. In the first step, positively charged hemoglobin (Hb) or myoglobin (Mb) at pH 5.0 was adsorbed on the negatively charged surface of 500 nm diameter-sized polystyrene (PS) latex beads, forming core-shell structured PS–protein particles. In the next step, the PS–protein particles were further assembled layer by layer with oppositely charged poly(styrene sulfonate) (PSS) on various solid surfaces under suitable conditions. Cyclic voltammetry (CV), quartz crystal microbalance (QCM), and UV-vis spectroscopy were used to monitor the growth of {(PS–protein)/PSS}n films. The stable {(PS–protein)/PSS}n films modified on pyrolytic graphite (PG) electrodes demonstrated good electroactivity in protein-free buffer, which was originated from protein heme Fe(III)/Fe(II) redox couples, and the electroactivity extended to six (PS–protein)/PSS bilayers. UV-vis spectroscopy showed that Hb and Mb in the films retained their near-native structure in the medium pH range. {(PS–protein)/PSS}n films catalyzed electrochemical reduction of oxygen, hydrogen peroxide, trichloroacetic acid (TCA) and nitrite with a significant lowering of overpotential, and displayed better catalytic activity than corresponding cast PS–protein films.
Introduction
Nowadays, layer-by-layer self-assembly of oppositely charged species has become a general approach to fabricating ultrathin films because of its relative simplicity and versatility.1,2 Layer-by-layer films of proteins with polyions or nanoparticles are also successfully realized on an electrode surface which provides a favorable microenvironment for proteins to exchange electrons with underlying electrodes.3,4 Direct electron exchange between enzymes and electrodes can establish a foundation for fabricating the third generation biosensors without using mediators, and provide a model for the mechanistic study of electron transfer between enzymes in biological systems.5–7 In this respect, the protein layer-by-layer assembly demonstrates obvious advantages over the casting method in its precise control of film composition and thickness on the molecular level or nanometer scale, and thus is more suitable for the study of direct electrochemistry of proteins. For example, we used a layer-by-layer technique to assemble heme protein or enzyme films on pyrolytic graphite (PG) electrodes with different polyions or nanoparticles.8–15 The proteins immobilized on electrode surfaces by this method retained their native conformation and exhibited good electroactivity, stability, and electrocatalytic activity towards various substrates.Recently, Caruso et al. have extended the layer-by-layer assembly from planar surfaces to curved surfaces of small beads or particles, forming a core-shell structure.16–18 In the structure, the “core” materials were nanoparticles,19–26 submicrometer-sized latex beads,27–31 biocrystals,32–34 or other colloid templates. These core-shell nanoclusters containing enzymes were used as bioreactors to catalyze substrate reactions.35–37 For example, Lvov and Caruso alternately assembled oppositely charged urease and poly(diallyldimethylammonium) (PDDA) layer by layer on a polystyrene (PS) latex bead surface.35 The immobilized urease retained its catalytic activity and exhibited better stability than in solution, and the catalytic activity increased proportionally with the number of urease/PDDA bilayers.
Stimulated by the works of Caruso et al., we assembled hemoglobin (Hb) shell on the surface of PS latex bead core, forming PS–Hb particles with a core-shell structure. The PS–Hb particles in their aqueous dispersions were then cast onto a PG electrode surface. After evaporation of solvent in air, PS–Hb films were formed on the PG surface.38 Hb, in this new kind of cast film, retained its native structure and displayed good direct electrochemistry and electrocatalytic properties.
The present work is our further attempt in this direction. We felt that the core-shell PS–protein particles could be further assembled layer by layer into porous films with polyions on electrode surfaces. We expected that the proteins in these novel films might exhibit better direct electrochemistry and electrocatalytic properties. In the present paper, Hb and myoglobin (Mb) were first adsorbed on the surface of PS latex beads, forming core-shell PS–protein particles. The PS–protein particles were then assembled layer by layer with oppositely charged poly(styrene sulfonate) (PSS) on PG electrodes, forming {(PS–protein)/PSS}n films. The films exhibited well-defined and reversible electrochemistry for protein heme Fe(III)/Fe(II) redox couples. Various techniques were used to characterize the protein layer-by-layer films. The stable {(PS–protein)/PSS}n films catalyzed electrochemical reduction of various substrates of biological or environmental significance.
Experimental
Chemicals and reagents
Bovine hemoglobin (Hb, MW 66![[hair space]](https://www.rsc.org/images/entities/char_200a.gif) 000, 90%) was from Shanghai Lizhu Dongfeng Biotechnology. Horse heart myoglobin (Mb, MW 17800) and polystyrene (PS) latex beads (diameter 500 nm), bearing negatively charged sulfate groups on their surfaces, supplied as an aqueous suspension (solid content 2.5%) were from Sigma. Poly(ethylenimine)
(PEI, 90%, MW∼15000), poly(sodium 4-styrenesulfonate)
(PSS, MW∼70000), and 3-mercapto-1-propanesulfonate (MPS, 90%) were from Aldrich. Trichloroacetic acid (TCA) was from Beijing Dongjiao Chemicals, sodium nitrite was from Beijing Sanhuan Chemicals, and hydrogen peroxide (H2O2, 30%) was from Beijing Chemical Engineering Plant. All other chemicals were of analytical grade.
000, 90%) was from Shanghai Lizhu Dongfeng Biotechnology. Horse heart myoglobin (Mb, MW 17800) and polystyrene (PS) latex beads (diameter 500 nm), bearing negatively charged sulfate groups on their surfaces, supplied as an aqueous suspension (solid content 2.5%) were from Sigma. Poly(ethylenimine)
(PEI, 90%, MW∼15000), poly(sodium 4-styrenesulfonate)
(PSS, MW∼70000), and 3-mercapto-1-propanesulfonate (MPS, 90%) were from Aldrich. Trichloroacetic acid (TCA) was from Beijing Dongjiao Chemicals, sodium nitrite was from Beijing Sanhuan Chemicals, and hydrogen peroxide (H2O2, 30%) was from Beijing Chemical Engineering Plant. All other chemicals were of analytical grade.
The supporting electrolyte was usually 0.05 M potassium dihydrogen phosphate buffer at pH 7.0 containing 0.1 M KBr. Other buffers were 0.1 M sodium acetate, 0.1 M boric acid, or 0.1 M citric acid, all containing 0.1 M KBr. The pHs of buffers were regulated with HCl or NaOH solutions. Solutions were prepared with twice distilled water.
Assembly of heme proteins onto PS latex beads
The method for assembly of heme proteins onto PS latex beads was similar to that described previously,38 and the protein-coated PS latex beads were designated as PS–protein. Briefly, taking PS–Hb as an example, 25 µl of 2.5% PS aqueous suspension (about 1010 PS particles) was added to a centrifuge tube containing 10 ml of 1 mg ml−1 Hb in pH 5.0 buffer. Positively charged Hb at pH 5.0 was adsorbed on the surface of negatively charged PS latex beads mainly by electrostatic attraction. After the adsorption equilibrium was reached, the dispersion was centrifuged to separate PS–Hb particles with the supernatant. In the next washing step, the pure water was added to the tube and the PS–Hb particles were redispersed in water, followed by centrifugation. This redispersion/centrifugation cycle was repeated for two additional times to ensure removal of all free or unadsorbed Hb from the PS–Hb particles. The PS–Hb particles were then dispersed in 100 µl of pH 5.0 buffer containing 0.5 M NaCl.Assembly of {(PS–protein)/PSS}n films
Layer-by-layer {(PS-protein)/PSS}n films were assembled on various solid substrates such as carbon electrodes, quartz slides, and gold-coated quartz crystal resonators. The experimental conditions for the assembly were optimized after a series of experiments.Prior to use, basal plane pyrolytic graphite (PG, Advanced Ceramics, geometric area 0.16 cm2) disk electrodes were polished with metallographic sandpapers while flushing with water. The electrodes were ultrasonicated in pure water for 30 s and dried under a nitrogen stream. The PG electrodes were then alternately immersed for 20 min into PEI solution (3 mg ml−1, 0.5 M NaCl) and PSS solution (3 mg ml−1, 0.5 M NaCl) with intermediate water washing and nitrogen stream drying so that a {PEI/PSS}2 precursor film was assembled on PG. The multilayer precursor film may provide a more uniform and smooth surface, which is important and critical to obtain a reproducible and stable protein layer-by-layer film.39 The {(PS-protein)/PSS}n layer-by-layer films were then assembled on PG/{PEI/PSS}2 surface by alternate adsorption in PSS solution for 20 min at room temperature and PS–protein suspensions for 60 min at 10 °C.
Quartz slides (0.8 × 4 cm, 1-mm thick) were washed in a solution (49% ethanol + 50% water + 1% KOH) for 30 min at 50 °C to introduce negative charges on to the quartz surface. After the {PEI/PSS}2 precursor film was adsorbed at room temperature, the {(PS–protein)/PSS}n films were assembled on the quartz surface in the same way as on PG electrodes.
Gold-coated quartz crystal resonator electrodes (International Crystal Manufacturing Co., geometric area 0.196 cm2) for a quartz crystal microbalance (QCM) were soaked in a freshly prepared “piranha” solution (3 : 7 volume ratio of 30% H2O2 and 98% H2SO4) for 15 min, and washed in pure water (Caution: the piranha solution is highly corrosive, and should be handled with extreme care. Only a small volume should be prepared at any time). The gold electrodes were immersed in 4 mM MPS ethanol solutions for 24 h to form an MPS monolayer on gold, and introduce negative charges on the surface. The {PEI/PSS}2 precursor films and following {(PS–protein)/PSS}n films were assembled on a Au/MPS surface in the same way as on PG electrodes. For each adsorption step, the electrodes were washed thoroughly in water for about 1 min, dried under a nitrogen stream and then measured by QCM in air.
Instruments and procedures
A CHI 660A electrochemical analyzer (CH Instruments) was used for cyclic and square wave voltammetry. In electrochemical measurements, a regular three-electrode cell was used with a saturated calomel electrode (SCE) as the reference, a platinum wire as the counter electrode, and a PG disk electrode coated with films as the working electrode. All experiments were performed at ambient temperature (20 ± 2 °C).Voltammetry at {(PS–protein)/PSS}n film electrodes was run in buffers containing no proteins. Prior to electrochemical measurements, buffer solutions were purged with purified nitrogen for at least 15 min, and then the nitrogen was bubbled gently through the solutions for exclusion of oxygen during the whole experiments. In aerobic experiments, measured volumes of air were injected via a syringe to a solution in a sealed cell, which had been previously de-gassed with nitrogen.
UV-vis absorption spectroscopy was carried out with a Cintra-10e UV-vis spectrometer (GBC). Scanning electron microscopy (SEM) was done with an X-650 scanning electron microanalyzer (Hitachi) at an acceleration voltage of 20 kV. Sample films for SEM were prepared on QCM gold electrodes.
A CHI 420 electrochemical analyzer (CH Instruments) was used to measure the QCM frequency change in order to monitor the assembly of {(PS–protein)/PSS}n layer-by-layer films. The quartz crystal resonator (AT-cut) has a fundamental resonance frequency of 8 MHz and is covered by thin gold films on both sides (geometric area 0.196 cm2). On the basis of the Sauerbrey equation,40 the frequency shift (ΔF) can be converted to micro-mass change (ΔM) by taking into account the characters of quartz resonator used in this work:
| ΔF = −7.40 × 10⁸ ΔM | (1) |
This equation is reliable for a dry adsorption layer when measurement is performed in air, as shown in previous studies.41,42 The viscoelestic effect of the absorbents on frequency can be ignored in this case. Thus, 1 Hz of frequency decrease corresponds to 1.35 ng of mass increase.
Results
Layer-by-layer assembly of {(PS–protein)/PSS}n films
The isoelectric point of Hb and Mb is at pH 7.443 and 6.8,44 respectively. Thus, Hb or Mb is positively charged at pH 5.0, and was adsorbed on negatively charged PS latex beads mainly by electrostatic interaction and formed a stable protein shell on the surface of PS beads. The assembly of Hb on PS was described in detail in our previous work, and confirmed by electrophoretic mobility and UV-vis spectroscopy.38 Spectroscopic results showed that in 10 ml of 1 mg ml−1 protein adsorbate solution, around 10% Hb and 2% Mb were adsorbed on PS beads, respectively. Assuming the amount of PS particles in 25 µl of PS dispersion was about 1010, the number of proteins adsorbed on each PS bead was estimated to be 9.0 × 10⁵ for Hb and 6.7 × 10⁵ for Mb. These numbers were larger than the numbers for monolayer adsorption of the corresponding proteins, indicating the multilayer adsorption or aggregation of proteins on PS beads. At pH 5.0, PS–protein particles were positively charged since the outermost layer of proteins on PS surface had net positive charges. Thus, PS–protein particles were successfully assembled layer by layer with negatively charged PSS on various solid substrates, mainly by electrostatic attraction between them, forming {(PS–protein)/PSS}n films. Compared with ordinary polyions or proteins, a PS latex particle has more rigid structure and relatively larger volume and mass. It was therefore more difficult for PS–protein particles to adsorb on a solid surface in layer-by-layer assembly. After a series of optimization experiments, we found that longer adsorption times at a lower adsorption temperature were more beneficial to the adsorption of PS–protein particles, so 60 min and 10 °C were selected as the optimal condition.QCM was used to monitor the assembly of {(PS–protein)/PSS}n films. Taking the Hb system as an example, when PS–Hb was assembled with PSS layer by layer on Au/MPS/{PEI/PSS}2 surface, a roughly linear decrease of frequency with adsorption step was observed (Fig. 1(a)), indicating that PS–Hb particles and PSS form layer-by-layer films, and the growth of the films is essentially uniform or regular with nearly constant adsorption amounts of (PS–Hb)/PSS in each bilayer. The average frequency decrease caused by the adsorption of PS–Hb particles (3749 ± 529 Hz) was much larger than that of PSS, mainly because of the much greater mass of each PS–Hb particle than that of PSS molecule. In the PSS adsorption step, some PS–Hb particles previously adsorbed on electrodes might desorb and leave from the surface, resulting in net increase of QCM frequency. However, the desorption of small amounts of PS–Hb particles did not influence the adsorption of PSS and the following adsorption of PS–Hb particles. In our experiments, the growth of four (PS–Hb)/PSS bilayers was successfully monitored by QCM on gold resonator electrodes. Further adsorption of PS–Hb particles would cause the total mass of films to be too large and out of the working range of a quartz crystal. {(PS–Mb)/PSS}n films showed similar QCM behavior (Fig. 1(b)) but with a smaller average frequency decrease for PS–Mb particles (3222 ± 898 Hz).
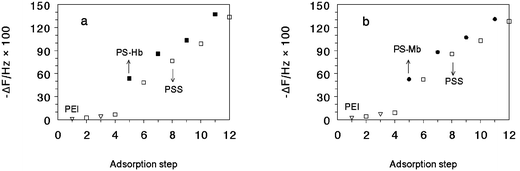 | ||
| Fig. 1 QCM frequency shift (ΔF) with the adsorption steps for a, {(PS–Hb)/PSS}n, and b, {(PS–Mb)/PSS}n films on Au/MPS surface: (▽) PEI, (□) PSS, (■) PS–Hb, and (●) PS–Mb. | ||
Assuming that the diameter of PS–protein particle is the same as the bare PS latex bead (500 nm) and the particles are densely and perfectly packed according to the hexagonal model, the maximum coverage of protein–PS particles on a surface is around 74%, so the surface coverage of a PS–protein monolayer would be about 3.7 × 10⁸ particles cm−2, and the total number of PS–protein particles adsorbed on both sides of QCM gold electrodes (geometric area 0.196 cm2 per face) would be 1.5 × 10⁸. If the density of PS–protein particles is assumed to be the same as that of bare PS latex beads (1.05 g cm−345), the theoretical frequency decrease would be 7380 Hz according to eqn. 1. Thus, the experimental frequency shift of 3749 Hz for PS–Hb adsorption would correspond to about 50% coverage, and 3222 Hz for PS–Mb would be about 44% coverage. While these relative coverage values were just a rough estimation, the results indicate that the PS–protein particles adsorbed in each cycle were not packed densely and arranged perfectly.
The heme prosthetic group of both Hb and Mb has a sensitive Soret absorption band at about 410 nm:46,47 UV-vis spectroscopy was thus used to monitor the growth of {(PS–protein)/PSS}n films assembled layer by layer on a quartz/{PEI/PSS}2 surface. Taking {(PS–Hb)/PSS}n films as an example, the Soret band for Hb increased linearly with the number of (PS–Hb)/PSS bilayers (n) with a correlation coefficient of 0.999 (Fig. 2), suggesting that PS–Hb particles form layer-by-layer films with PSS, and the amount of PS–Hb particles adsorbed in each bilayer is nearly the same. The Soret band of Hb showed a blue-shift from 412 nm to 408 nm with increasing the bilayer number (Fig. 2). The reason for this is not very clear yet, and is probably related to the gradual change of microenvironment where Hb resides. When the number of bilayers increased, more cavities or pores were formed in the films, which contained more water in solution and provided a more aqueous-like microenvironment for Hb. In aqueous solution, the Soret absorption band of Hb is at 408 nm. The Mb system showed similar behavior.
 | ||
| Fig. 2 UV-vis spectra for {PEI/PSS}2 precursor film and {(PS–Hb)/PSS}n films on quartz/{PEI/PSS}2 surface with different number of bilayers (n). | ||
Cyclic voltammetry (CV) was also used to monitor the assembly process of {(PS–protein)/PSS}n films on PG electrodes. After each adsorption cycle, the {(PS–protein)/PSS}n film electrode was washed in water, placed in a pH 7.0 buffer containing no protein, and monitored by CV scans (Fig. 3). A pair of well-defined, reversible CV peaks was observed at about −0.35 V versus SCE that were characteristic of the protein heme’s Fe(III)/Fe(II) redox couples.48,49 Both reduction and oxidation peaks grew nonlinearly with the number of (PS–protein)/PSS bilayers (n) until n = 6. When n exceeded 6, the peak currents tended to level off and essentially did not increase any more, indicating that proteins assembled in the bilayers of n > 6 are not electrochemically addressable.
 | ||
| Fig. 3 Cyclic voltammograms for {(PS–protein)/PSS}n films at 0.2 V s−1 in pH 7.0 buffers with different number of bilayers (n) for a, {(PS–Hb)/PSS}n, and b, {(PS–Mb)/PSS}n films. | ||
Morphology of {(PS–protein)/PSS}n films
{(PS–protein)/PSS}n films assembled on gold substrates were characterized by scanning electron microscopy (SEM). Fig. 4 shows SEM top views of {(PS–Hb)/PSS}n films with n = 1 and n = 4, respectively, with the same magnification. While the adsorbed Hb and PSS were not observable or detectable in the picture with this magnification, spheres of PS beads were clearly shown. For {(PS–Hb)/PSS}4 films with n = 4, some layered structures were also observed. The results showed that in the layer-by-layer {(PS–Hb)/PSS}n films, the PS–Hb particles were not packed densely, leaving a plenty of space between the particles, which is qualitatively consistent with the QCM results discussed above. | ||
| Fig. 4 Top view of SEM of {(PS–Hb)/PSS}n films with the same magnification for a, n = 1, and b, n = 4. | ||
Voltammetric properties of {(PS–protein)/PSS}6 films
Since the layer-by-layer {(PS–protein)/PSS}6 films with n = 6 gave a steady state of CV response at PG electrodes, most of the following voltammetric experiments were carried out with {(PS–protein)/PSS}6 film electrodes. CVs of {(PS–protein)/PSS}6 films in pH 7.0 buffers showed a fairly symmetrical peak shape (Fig. 3) with roughly equal heights of reduction and oxidation peaks. The reduction peak currents increased linearly with scan rates from 0.05 to 2.0 V s−1, and integration of reduction peaks at different scan rates in this range gave nearly constant charge (Q) values. All these are characteristic of the diffusionless, surface-confined voltammetric behavior.50According to the charge (Q) value estimated by integration of CV reduction peak for {(PS–protein)/PSS}n films and the relationship Q = nFAΓ*,50 the surface concentration of electroactive protein in the films (Γ*, mol cm−2) was estimated, where A is the geometric area of PG electrode and n and F have their usual meanings. By combining the results of adsorption amounts of PS–protein particles in each bilayer estimated by QCM and amounts of proteins adsorbed on each PS particle estimated by UV-vis spectroscopy, the surface concentration of total adsorbed proteins (Γ, mol cm−2) in each bilayer was estimated to be 2.8 × 10⁻¹⁰ mol cm−2 for {(PS–Hb)/PSS}n films, and 1.4 × 10⁻¹⁰ mol cm−2 for {(PS–Mb)/PSS}n films. Thus, the fraction of electroactive proteins among the total adsorbed proteins in each bilayer (Γ*/Γ) was estimated. For example, while Γ* increased gradually with the number of bilayers when n < 6 for {(PS–Mb)/PSS}n films, the ratio Γ*/Γ decreased dramatically with n (Fig. 5), indicating that the distance between the proteins and electrodes is crucial for efficient electron exchange.
 | ||
| Fig. 5 Influence of the number of bilayers (n) on a, surface concentration of electroactive Mb (Γ*), and b, fraction of electroactive Mb. Data are from cyclic voltammograms at 0.2 V s−1 in pH 7.0 buffers for {(PS–Mb)/PSS}n film. | ||
The stability of {(PS–protein)/PSS}6 film electrodes was tested by two methods. In a solution study, {(PS–protein)/PSS}6 films were stored in pH 7.0 blank buffers all the time, and CVs were carried out periodically. Alternatively, with the “dry” method, {(PS–protein)/PSS}6 film electrodes were stored in air for most of the storage time, and put into pH 7.0 buffers occasionally for CV measurements. With both methods, {(PS–protein)/PSS}6 films showed excellent stability. Peak potentials and currents essentially maintained unchanged for at least one month.
CVs of {(PS–protein)/PSS}6 films showed great dependence on the pH of external buffers. An increase of pH in solution led to a negative shift in potential of both reduction and oxidation peaks of the heme Fe(III)/Fe(II) redox couple. Changes of CV peak potentials with pH were reversible in the range of pH 5.0–10.0. For example, a {(PS–Hb)/PSS}6 film electrode was first placed in a pH 5.0 buffer and tested by CV. It was then transferred to a pH 7.0 buffer and examined by CV. When the film was placed back into the pH 5.0 buffer again, the CV was quite reproducible and demonstrated almost the same peak potentials and heights as before. Surface concentration of electroactive Hb in {(PS–Hb)/PSS}6 films (Γ*) maintained nearly constant between pH 5.0 and 9.0 (Fig. S1†). The formal potential (E°′) of {(PS–protein)/PSS}6 films, estimated as the midpoint of reduction and oxidation CV peak potentials, had a linear relationship with pH from pH 5.0 to 11.0 with a slope of −56 mV pH−1 for {(PS–Hb)/PSS}6 films, and −47 mV pH−1 for {(PS–Mb)/PSS}6 films. These slope values are reasonably consistent with the theoretical value of −58 mV pH−1 at 20 °C for a reversible electron transfer coupled by proton transport with an equal number of protons and electrons,51,52 which can be expressed as hemeFe(III) + e− + H+ ⇔ hemeFe(II). An inflection point appeared at pH 5.0 for both proteins. At pH lower than 5.0, E°′ changed with pH more slowly.
Square wave voltammetry (SWV) has a better signal-to-noise ratio and resolution than CV,53 and was used here to estimate the apparent heterogeneous electron transfer rate constant (ks) and formal potential (E°′) for {(PS–protein)/PSS}6 films. Nonlinear regression analysis was employed for SWV background-subtracted forward and reverse curves, using the combination of a single-species surface-confined SWV model54 and a formal potential dispersion model.55 This method was successfully used in various protein films,8,11,56 and a detailed description of the process was discussed in the literature.55,56
Analysis of SWV data for {(PS–protein)/PSS}6 films demonstrated goodness of fit onto the model with p = 5 over a range of amplitudes and frequencies. The average ks and E°′values obtained from fitting SWV data at pH 7.0 for {(PS–protein)/PSS}6 films are listed in Table 1. Values of ks and E°′ obtained by the same method from cast PS–Hb film electrodes are also listed in Table 1 for comparison.
| Films | ks/s−1 | Average E°′/V vs. SCE) | Referencea | |
|---|---|---|---|---|
| CV | SWV | |||
| a tw: this work, reporting average values for analysis of eight SWVs at frequencies of 100–200 Hz, amplitudes of 60–75 mV, and a step height of 4 mV. | ||||
| {(PS–Hb)/PSS}6 | 56±7 | −0.355 | −0.352 | tw |
| PS–Hb (cast) | 58±5 | −0.350 | −0.360 | 38 |
| {(PS–Mb)/PSS}6 | 52±7 | −0.358 | −0.350 | tw |
For {(PS–Hb)/PSS}6 films, the relatively large ks value is of the same order of magnitude as that of cast Hb–PS films. Both layer-by-layer {(PS–protein)/PSS}6 films and cast protein–PS films provided a favorable microenvironment for the proteins and enhanced the rate of electron transfer between proteins and PG electrodes. The advantage of layer-by-layer films over the cast films is their precise control of architecture and thickness. The E°′ values of {(PS–Hb)/PSS}6 films and cast Hb–PS films are very similar, suggesting that the assembly manner may have little influence on the formal potential since the microenvironment where the proteins reside for two types of films is quite similar.
Conformational studies
UV-vis spectroscopy was also used to check conformational change of the heme proteins in {(PS–protein)/PSS}6 films, especially the change in the heme regions. For example, both dry Hb and {(PS–Hb)/PSS}6 films demonstrated a Soret band at 412 nm (Fig. 6), indicating that Hb in dry layer-by-layer films retains the near native structure of Hb. When {(PS–Hb)/PSS}6 films were immersed into buffers at pH between 4.0 and 11.0, the Soret band appeared at 412 nm, identical to that for dry Hb and {(PS–Hb)/PSS}6 films, suggesting that in the medium pH range, Hb essentially retains its native conformation in the film environment. When pH was changed towards more acidic or more basic direction, the Soret band became broadened and distorted, indicating that Hb in the films may undergo denaturation to a considerable extent. | ||
| Fig. 6 UV-vis spectra on quartz slides for: a, dry Hb film; b, dry {(PS–Hb)/PSS}6 film, and {(PS–Hb)/PSS}6 films in different buffers; c, pH 5.0; d, pH 7.0; e, pH 9.0; f, pH 11.0; g, pH 4.0; h, pH 3.0; i, pH 12. | ||
On quartz slides, layer-by-layer {(PS–Hb)/PSS}6 films showed better stability than cast Hb–PS films, but {(PS–Hb)/PSS}6 films on quartz slides were less stable than the films on the PG electrode surface. For example, after being soaked in pH 7.0 buffers for more than 1 h, the {(PS–Hb)/PSS}6 films showed a pronounced decrease in Soret band. In addition, Hb was detected by Soret band in the external solution, indicating that some of the Hb in films desorbed and entered into the solution.
Catalytic activity
Both {(PS–Hb)/PSS}6 and {(PS–Mb)/PSS}6 films showed good electrocatalytic activity towards a variety of substrates of biological or environmental significance. For instance, when a certain volume of air was injected into pH 7.0 buffers, a significant increase of the CV reduction peak at about −0.35 V was observed at the {(PS–Mb)/PSS}6 film electrodes, accompanied by a disappearance of the oxidation peak of MbFe(II) (Fig. S2†). An increase in the amount of air resulted in an increase in reduction peak. For the {PEI/PSS}2 precursor films assembled on PG electrodes, the direct reduction of O2 appeared at about −0.85 V. The {(PS–Mb)/PSS}6 films lowered the reduction overpotential of O2 by about 0.5 V. Catalytic efficiency, expressed as the ratio of reduction peak current in the presence (Ic) and absence (Id) of oxygen, Ic/Id, decreased with increase of scan rate, also characteristic of electrochemical catalytic reduction of oxygen by {(PS–Mb)/PSS}6 films.57Catalytic CV behavior was also observed for hydrogen peroxide at {(PS–protein)/PSS}6 film electrodes. Taking {(PS–Mb)/PSS}6 film electrode as an example, when H2O2 was added to a pH 7.0 buffer, an increase in the reduction peak at about −0.4 V was observed with the disappearance of oxidation peak for MbFe(II). The reduction peak current increased with the concentration of H2O2 in solution. However, no direct reduction of H2O2 was observed on {PEI/PSS}2 precursor films in the studied potential range (Fig. 7). The catalytic CV reduction peak of {(PS–Mb)/PSS}6 films had a linear relationship with H2O2 concentration in the range of 2.0 × 10⁻⁵–1.4 × 10⁻⁴ M, with a correlation coefficient of 0.998. When the concentration of H2O2 exceeded 1.4 × 10⁻⁴ M, the reduction peak of {(PS–Mb)/PSS}6 films tended to level off or even gradually decrease, suggesting a progressive enzyme inactivation in the presence of a high concentration of substrates.58
 | ||
| Fig. 7 Cyclic voltammograms at 0.2 V s−1 in pH 7.0 buffers for: a, {PEI/PSS}2 film; b, {PEI/PSS}2 film with 0.05 mM H2O2; c, {(PS–Mb)/PSS}6 film; d, {(PS–Mb)/PSS}6 film with 0.025 mM H2O2; and e, {(PS–Mb)/PSS}6 film with 0.068 mM H2O2. | ||
The catalytic reduction of nitrite with {(PS–protein)/PSS}6 films was also investigated by CV. When NO2− was added to a pH 5.5 buffer, a new reduction wave at about −0.75 V was observed at the {(PS–Hb)/PSS}6 film electrode, while the Hb Fe(III)/Fe(II) peak pair was nearly intact (Fig. S3†). The new reduction peak current increased with the concentration of nitrite in solution. The direct reduction of nitrite at blank {PEI/PSS}2 precursor film electrodes was observed at a potential more negative than −1.2 V. Thus, the reduction overpotential of nitrite was decreased by at least 0.4 V.
Electrocatalytic activity of {(PS-protein)/PSS}6 films toward trichloroacetic acid (TCA) was also investigated. When TCA was added to a pH 5.5 buffer, {(PS–Hb)/PSS}6 films showed an increase in reduction peak at about −0.4 V (Fig. S4†). The increase in the HbFe(III) reduction peak was accompanied by a decrease in the HbFe(II) oxidation peak, since HbFe(II) had reacted with TCA. The reduction peak current increased with the concentration of TCA in solution. The direct reduction of TCA at {PEI/PSS}2 precursor film electrodes was observed at a potential more negative than −1.0 V. The reduction overpotential of TCA was thus decreased by at least 0.6 V. These results demonstrated typical electrochemical catalysis, where HbFe(II), the reduction product of the electrode reaction, was oxidized by TCA in a chemical reaction and returned to the HbFe(III) form, the HbFe(III) then accepting one electron from the electrode again, forming a catalytic cycle. TCA presumably underwent stepwise reductive dechlorination to ultimately become acetic acid, as described previously with other protein films.59
The CV reduction peak currents of different substrates catalyzed by {(PS–protein)/PSS}6 films was used to quantitatively estimate the concentration of the substrates such as H2O2, TCA, and NO2− in solution. The linear range of calibration curve, the detection limit, the sensitivity, and the correlation coefficient for these systems are listed in Table 2. For O2 and H2O2 systems, the catalytic efficiency (Ic/Id) is also listed. For comparison, the corresponding data of cast PS–Hb films towards these substrates are also presented in Table 2.
| Substrates | Films | |||
|---|---|---|---|---|
| {(PS–Hb)/PSS}6 | PS–Hb (cast)38 | {(PS–Mb)/PSS}6 | ||
| a CV, 20 ml of air injected in 8 ml of pH 7.0 buffers at 0.2 V s−1. b CV, 30 ml of air injected in 8 ml of pH 7.0 buffers at 0.2 V s−1. c CV, at 0.2 V s−1 in pH 7.0 buffers. d CV, 0.05 mM H2O2 in pH 7.0 buffers at 0.2 V s−1. e CV, at 0.1 V s−1 in pH 5.5 buffers. f CV, at 0.2 V s−1 in pH 5.5 buffers. | ||||
| O2 | catalysis efficiency | 17a | 9.0b | 6.7a |
| H2O2c | linear range/mM | 0.001–0.15 | 0.007–0.13 | 0.002–0.14 |
| detection limit/mM | 0.001 | 0.002 | 0.001 | |
| sensitivity/µA mM−1 | 57 | 52 | 66 | |
| correlation coefficient | 0.993 | 0.996 | 0.998 | |
| catalysis efficiencyd | 6.5 | 1.1 | 5.6 | |
| NaNO2e | linear range/mM | 0.5–17 | 6.0–16 | 0.1–10 |
| detection limit/mM | 0.4 | 1.0 | 0.1 | |
| sensitivity/µA mM−1 | 0.16 | 0.15 | 0.15 | |
| correlation coefficient | 0.994 | 0.994 | 0.997 | |
| TCAf | linear range/mM | 3.0–50 | 20–50 | 0.1–1.5 |
| detection limit/mM | 3.0 | 20 | 0.1 | |
| sensitivity/µA mM−1 | 0.25 | 0.23 | 0.70 | |
| correlation coefficient | 0.997 | 0.995 | 0.995 | |
Discussion
The main driving force for layer-by-layer assembly of positively charged PS–protein particles and polyanionic PSS is electrostatic attraction between them, as in the other protein/polyion layer-by-layer films.3,4 The strong electrostatic interaction between protein and PSS in PSS adsorbate solution may cause the formation of a protein–PSS complex or aggregate, and make some PS–protein particles previously adsorbed on solid surface desorb from the surface and “dissolve” into the PSS solution (Fig. 1). However, the results show that the desorption amount of PS–protein particles is very limited and has no significant influence on the formation of {(PS–protein)/PSS}n films (Fig. 1). Also, the {(PS–protein)/PSS}n films on a PG electrode surface are stable for at least several weeks when stored in blank buffer. These results suggest that in addition to electrostatic interaction, other interactions such as hydrogen bonding and hydrophobic attraction may also play an important role. Previous studies showed that positively charged heme proteins could form stable layer-by-layer films with PSS,8,60 which also supports the formation of stable {(PS–protein)/PSS}n films using the layer-by-layer method since the interaction should be similar for {protein/PSS}n and {(PS–protein)/PSS}n film systems.Both QCM and TEM results (Figs. 1 and 4) indicate that PS–protein particles adsorbed in each adsorption cycle are not packed densely and arranged perfectly. Thus, there would be a lot of “cavities” or “channels” in {(PS-protein)/PSS}n films. The existence of large amounts of space in the films makes the films contain a lot of water and small ions when they are placed in buffers. While PS beads and PSS are non-conductive, the {(PS–protein)/PSS}n films in buffers may provide an aqueous-like microenvironment for the proteins, which is favorable for the proteins to transfer electrons with underlying electrodes. In addition, large amounts of counterions contained in the cavities and channels of the films would greatly decrease the resistance of charge transport.
The diameter of the PS–protein particle is about 500 nm. The maximum thickness of 6 (PS–protein)/PSS bilayers would thus be about 3 µm. Considering the mixing of neighboring layers in assembly, the actual thickness of {(PS–protein)/PSS}6 films would be less than this value. Nevertheless, the thickness of electroactive films should still be at the µm level. It is impossible that heme proteins immobilized on PS surface would physically diffuse to electrode with that long distance. Therefore, it is more reasonable to use electron-hopping mechanism61 to interpret the electron transfer of proteins in {(PS–protein)/PSS}n films with underlying electrodes even though the effective electron hopping distance at µm level is much larger than most other protein layer-by-layer films, in which the maximum thickness of electroactive films would be in the range of a few tens to a few hundreds of nm.8–15 The larger effective charge-hopping distance of {(PS–protein)/PSS}n films is possibly related to the efficiency of counterion transport which often limits overall charge transport in electroactive films.61 {(PS–protein)/PSS}6 films may have more cavities than most other protein layer-by-layer films. These channels may allow counterions in buffers to move into or out of the films more easily, and greatly enhance the charge transport mobility within the films.
Heme proteins in {(PS–protein)/PSS}6 films display good catalytic activity toward various substrates (Figs. 7, S2, S3, S4, and Table 2). In particular, {(PS–protein)/PSS}6 multilayer films demonstrate obvious advantages over the corresponding cast PS–protein films in catalysis (Table 2). {(PS–protein)/PSS}6 films may have more cavities than cast PS–protein films. These more porous layer-by-layer films allow the enzyme substrates to enter into the films and react with the immobilized proteins more easily and rapidly, thus improving the catalytic performances of the proteins. Another advantage of the layer-by-layer films over the cast films is that the thickness of the films can be controlled more precisely, and thus the electrochemical activity and catalytic reactivity of proteins in these films can be tailored or organized more accurately. The good catalytic activity and stability of {(PS–protein)/PSS}n film electrodes demonstrate that this novel protein film construction strategy, which combines the core-shell structure building-up and the layer-by-layer assembly, may have potential promise in fabricating mediator-free biosensors and bioreactors.
Acknowledgements
The financial support of the National Natural Science Foundation of China (NSFC 20475008 and 20275006) and the State Key Laboratory of Electroanalytical Chemistry of Changchun Institute of Applied Chemistry, the Chinese Academy of Sciences, is gratefully acknowledged.References
- G. Decher, Science, 1997, 277, 1232–1237 CrossRef CAS.
- Y. Lvov in “Handbook of Surfaces and Interfaces of Materials”, Nanostructured Materials, Micelles and Colloids, ed. R. W. Nalwa, Academic Press, San Diego, 2001, vol. 3, pp. 170–189 Search PubMed.
- Y. Lvov, in Protein Architecture: Interfacing Molecular Assemblies and Immobilization Biotechnology, eds. Y. Lvov and H. Möhwald, Marcel Dekker, New York, 2000, pp. 125–166 Search PubMed.
- J. F. Rusling in Protein Architecture: Interfacing Molecular Assemblies and Immobilization Biotechnology, eds. Y. Lvov and H. Mohwald, Marcel Dekker, New York, 2000, pp. 337–354 Search PubMed.
- F. A. Armstrong, H. A. O. Hill and N. J. Walton, Acc. Chem. Res., 1988, 21, 407–413 CrossRef CAS.
- F. A. Armstrong in Bioinorganic Chemistry: Structure and Bonding, Springer-Verlag, Berlin, 1990, vol. 72, pp. 137–236 Search PubMed.
- M. F. Chaplin and C. Bucke, Enzyme Technology, Cambridge University Press, Cambridge, UK, 1990 Search PubMed.
- H. Ma, N. Hu and J. F. Rusling, Langmuir, 2000, 16, 4969–4975 CrossRef CAS.
- L. Wang and N. Hu, Bioelectrochemistry, 2001, 53, 205–212 CrossRef CAS.
- Y. Zhou, Z. Li, N. Hu, Y. Zeng and J. F. Rusling, Langmuir, 2002, 18, 8573–8579 CrossRef CAS.
- P. He, N. Hu and G. Zhou, Biomacromolecules, 2002, 3, 139–146 CrossRef CAS.
- Z. Li and N. Hu, J. Colloid Interface Sci., 2002, 254, 257–265 CrossRef CAS.
- Z. Li and N. Hu, J. Electroanal. Chem., 2003, 558, 155–165 CrossRef CAS.
- P. He, N. Hu and J. F. Rusling, Langmuir, 2004, 20, 722–729 CrossRef CAS.
- P. He and N. Hu, Electroanalysis, 2004, 16, 1122–1131 CrossRef CAS.
- F. Caruso, R. A. Caruso and H. Mohwald, Science, 1998, 282, 1111–1114 CrossRef CAS.
- F. Caruso, Chem.-Eur. J., 2000, 6, 413–419 CrossRef CAS.
- F. Caruso, Adv. Mater., 2001, 13, 11–22 CrossRef CAS.
- K. Uosaki, T. Kondo, M. Okamura and W. Song, Faraday Discuss., 2002, 121, 373–389 RSC.
- T. Kondo, M. Okamura and K. Uosaki, Chem. Lett., 2001, 930–931 CrossRef CAS.
- W. Song, M. Okamura, T. Kondo and K. Uosaki, J. Electroanal. Chem., 2003, 554(555), 385–393 CrossRef.
- D. I. Gittins and F. Caruso, J. Phys. Chem. B, 2001, 105, 6846–6852 CrossRef CAS.
- R. Davies, G. A. Schurr, P. Meenan, R. D. Nelson, H. E. Bergna, C. A. S. Brevett and R. H. Goldbaum, Adv. Mater., 1998, 10, 1264–1270 CrossRef CAS.
- K. P. Velikov and A. van Blaaderen, Langmuir, 2001, 17, 4779–4786 CrossRef CAS.
- S. J. Oldenburg, R. D. Averitt, S. L. Westcott and N. J. Halas, Chem. Phys. Lett., 1998, 288, 243–247 CrossRef CAS.
- T. Pham, J. Jackson, N. J. Halas and T. R. Lee, Langmuir, 2002, 18, 4915–4920 CrossRef CAS.
- F. Caruso, H. Lichtenfeld, H. Mohwald and M. Giersig, J. Am. Chem. Soc., 1998, 120, 8523–8524 CrossRef CAS.
- V. Salgueirino-Maceira, F. Caruso and L. M. Liz-Marzan, J Phys. Chem. B, 2003, 107, 10990–10994 CrossRef CAS.
- A. J. Khopade and F. Caruso, Nano. Lett., 2002, 2, 415–418 CrossRef CAS.
- K. Rhodes, S. A. Davis, F. Caruso, B. Zhang and S. Mann, Chem. Mater., 2000, 12, 2832–2834 CrossRef CAS.
- F. Caruso and H. Mohwald, J. Am. Chem. Soc., 1999, 121, 6039–6046 CrossRef CAS.
- F. Caruso, D. Trau, H. Mohwald and R. Renneberg, Langmuir, 2000, 16, 1485–1488 CrossRef CAS.
- W. Jin, X. Shi and F. Caruso, J. Am. Chem. Soc., 2001, 123, 8121–8122 CrossRef CAS.
- A. Yu and F. Caruso, Anal. Chem., 2003, 75, 3031–3037 CrossRef CAS.
- Y. Lvov and F. Caruso, Anal. Chem., 2001, 73, 4212–4217 CrossRef CAS.
- F. Caruso and C. Schuler, Langmuir, 2000, 16, 9595–9603 CrossRef CAS.
- C. Schuler and F. Caruso, Macromol. Rapid Commun., 2000, 21, 750–753 CrossRef CAS.
- H. Sun and N. Hu, Biophys. Chem., 2004, 110, 297–308 CrossRef CAS.
- T. Serizawa, H. Takeshita and M. Akashi, Langmuir, 1998, 14, 4088–4094 CrossRef CAS.
- G. Sauerbrey, Z. Phys., 1959, 155, 206 CAS.
- Y. Lvov, K. Ariga, I. Ichinose and T. Kunitake, J. Am. Chem. Soc., 1995, 117, 6117–6123 CrossRef CAS.
- T. Serizawa, S. Kamimura, N. Kawanishi and M. Akashi, Langmuir, 2002, 18, 8381–8385 CrossRef CAS.
- J. B. Matthew, G. I. H. Hanania and F. R. N. Gurd, Biochemistry, 1979, 18, 1919–1928 CrossRef CAS.
- A. Bellelli, G. Antonini, M. Brunori, B. A. Springer and S. J. Sligar, J. Biol. Chem., 1990, 265, 18898–18901 CAS.
- K. Ito, T. Muramoto and H. Kitano, J. Am. Chem. Soc., 1995, 117, 5005–5006 CrossRef CAS.
- H. Theorell and A. Ehrenberg, Acta Chem. Scand., 1951, 5, 823–848 CAS.
- P. George and G. I. H. Hanania, Biochem. J., 1953, 55, 236–243 CAS.
- J. F. Rusling and A.-E. F. Nassar, J. Am. Chem. Soc., 1993, 115, 11891–11897 CrossRef CAS.
- Q. Huang, Z. Lu and J. F. Rusling, Langmuir, 1996, 12, 5472–5480 CrossRef CAS.
- R. W. Murray, in Electroanalytical Chemistry, ed. A. J. Bard, Marcel Dekker, New York, 1984, vol. 13, pp. 191–368 Search PubMed.
- L. Meites, Polarographic Techniques, Wiley, New York, 2nd edn., 1965 Search PubMed.
- A. M. Bond, Modern Polarographic Methods in Analytical Chemistry, Marcel Dekker, New York, 1980 Search PubMed.
- J. G. Osteryoung and J. J. O'Dea in Electroanalytical Chemistry, ed. A. J. Bard, Marcel Dekker, New York, 1986, vol. 14, pp. 209–325 Search PubMed.
- J. J. O'Dea and J. G. Osteryoung, Anal. Chem., 1993, 65, 3090–3097 CrossRef CAS.
- Z. Zhang and J. F. Rusling, Biophys. Chem., 1997, 63, 133–146 CrossRef CAS.
- A.-E. F. Nassar, Z. Zhang, N. Hu, J. F. Rusling and T. F. Kumosinski, J. Phys. Chem. B, 1997, 101, 2224–2231 CrossRef CAS.
- C. P. Andrienx, C. Blocman, J. M. Dumas-Bouchiat, F. M'Halla and J. M. Saveant, J. Electroanal. Chem., 1980, 113, 19–40 CrossRef CAS.
- S. A. Adeiran and A. M. Lambeir, Eur. J. Biochem., 1989, 186, 571–576.
- A.-E. F. Nassar, J. M. Bobbitt, J. O. Stuart and J. F. Rusling, J. Am. Chem. Soc., 1995, 117, 10986–10993 CrossRef CAS.
- Y. M. Lvov, Z. Lu, J. B. Schenkman, X. Zu and J. F. Rusling, J. Am. Chem. Soc., 1998, 120, 4073–4080 CrossRef CAS.
- M. Majda in Molecular Design of Electrode Surfaces, ed. R. W. Murray, Wiley, New York, 1992, pp. 159–206 Search PubMed.
Footnote |
| † Electronic supplementary information (ESI) available: cyclic voltammograms of various films. See http://www.rsc.org/suppdata/an/b4/b411430b/ |
| This journal is © The Royal Society of Chemistry 2005 |