An organic hydrogel as a matrix for the growth of calcite crystals†
Lara A.
Estroff
a,
Lia
Addadi
b,
Steve
Weiner
b and
Andrew D.
Hamilton
*a
aDepartment of Chemistry, Yale University, New Haven, CT 06511. E-mail: andrew.hamilton@yale.edu; Fax: +1 203-432-3221; Tel: +1 203-432-5570
bDepartment of Structural Biology, Weizmann Institute of Science, Rehovot, Israel 76100
First published on 28th November 2003
Abstract
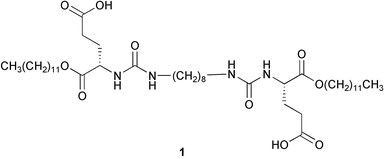
The growth of calcite in an aqueous gel of 1 was studied and the appearance of the crystals was found to change over time. Crystals removed from the gel at progressively longer times showed severely affected surfaces resulting from dissolution. If crystals were removed from the gel after 3.5 hours, at which point there were no etch pits, and then placed in either buffer or pure water, etch pits, similar to those observed on crystals that are left in the gel, were observed. Control calcite crystals exposed to similar conditions (water or buffer) show no significant dissolution after equivalent times. A probable cause of the altered dissolution is the non-specific occlusion of gelator aggregates at sites of imperfection. The gel appears to provide a microenvironment in which the molecules that form the matrix also participate in the crystallization. This system allows the study of the unique properties of a gel for influencing the nucleation and growth of inorganic crystals, some of which may be important for better understanding biomineralization.
Introduction
The conventional model for crystallization by organisms includes nucleation and growth from a saturated solution. Recently, however, based on new experimental evidence, the presence of a hydrogel phase has been suggested in several mineralizing systems including the insoluble matrix of the aragonitic nacreous layer of bivalve mollusks,1 the insoluble matrix of fish otoliths,2 and a major protein component in tooth enamel, the amelogenins.3 In addition, organic fibrous networks, which are related to hydrogels but with a lower water content, have been identified in several other organisms including the collagen fibers in mammalian bone4 and the extracellular matrix in scleractinian coral.5 The environment in a hydrogel differs greatly in diffusion rates, ion activities, and water “structure” (due to the hydrophobic nature of the gel)6 as compared to solution conditions for crystallization. All of these factors have a direct impact on the level of supersaturation and thus a gel phase is predicted to influence the kinetics of crystallization. The hydrophobic environment provided by a gel phase may also induce structure in the macromolecules comprising the soluble matrix, and thus facilitate their ability to influence crystal morphology, size and orientation.7 It is conceivable that growth in a gel environment coupled with controlled delivery of reagents allows organisms much finer control than growth from saturated solutions.Artificially formed gels and fibrous networks are excellent systems for studying crystallization because of the control they afford over local supersaturations and diffusion rates.8,9 For example, in an in vitro experiment, an insoluble matrix composed of β-chitin (isolated from the squid pen, a non-mineralized source) and silk-fibroin (isolated from silk worm cocoons, another non-mineralized source) was used to demonstrate the polymorph selectivity of proteins from the calcitic and aragonitic layers of mollusk shells.10,11 More recently, collagen matrices with adsorbed polypeptides,12 agar with a variety of carboxylic acids additives,13 silica gel,14 gelatin,15,16 polyacrylamide,17 and a sulfonic acid based hydrogel18 have all been used as matrices for the growth of calcium carbonate.
Self-assembling, small molecule organic gels (of both aqueous19 and organic solvents20) are attractive matrices for mineralization. Recently there have been several published reports of successful mineralization around organogelator fibers using sol-gel methods to create silica and titanium oxide structures with templated fibrous, tubular and spherical shapes.21 Another example of mineralized gel fibers is the semi-conductor nanohelices recently reported by Sone et. al.22 The same group has also used aqueous gels to study the growth of biologically relevant carbonated apatite crystals (the bone mineral).23 These are all elegant examples of the use of self-assembled organic suprastructures to control the growth of inorganic minerals.
We were interested in exploring the utility of a self-assembled hydrogel of 124,25 as a matrix for the growth of calcium carbonate. Gels of this type display Ca2+-binding domains (carboxylate groups) on the fibers25 that can potentially either nucleate the growth of a given mineral or interact strongly and specifically with growing crystal faces, thus altering the morphology of the crystals in a controlled fashion. The one-component scaffold created by the aggregation of these molecules in water is well-suited for studying mineralization in an environment where the type and density of functionality as well as the pore size can be manipulated. In particular, we asked the question: how does growth in a gel environment alter the physical characteristics of the crystals as compared to solution growth? The result is an artificial system where the presence of occluded organic material – organic hydrogel aggregates – appears to alter the physical properties of calcite crystals.
Results
Growth experiments
The growth of calcium carbonate crystals in the colloidal gel of 1 was studied using the slow diffusion of carbon dioxide (from subliming (NH4)2CO3) into a calcium ion containing solution.26 Initial attempts, with a high ratio of gelator to calcium chloride (2 : 1; 1 : CaCl2), resulted only in the formation of vaterite spherulitic crystal aggregates, presumably because of the strong calcite inhibitory effects of the carboxylates of 1. By increasing the calcium concentration (to 7 mM) and ratio (to 1 : 3, 1 : CaCl2), calcite became the dominant polymorph.27,28The appearance of calcite crystals grown in the organic hydrogel changes dramatically over time (Figs 1 and 2). Crystals removed from the gel at progressively longer times show increasingly affected surfaces, apparently due to dissolution (Fig. 1).29 Initially (3.5 hours) the crystals are rhombohedral with mostly flat and smooth {10.4} main surfaces (Fig. 1a), without the crevasses typical after longer time periods. The etch pits observed after 10.5 and 24 hours do not have the geometry (rhombohedral or trigonal) observed when calcite is etched with acid,30 chelators such as EDTA (see ESI†)31 or additives such as aspartic acid.32 Instead, they appear irregular, following no crystallographic symmetry and penetrate deep into the crystals (Fig. 1(b–d)). After even longer times growing in the gel (greater than 2 days), the original rhombohedra completely lose their shape. They are round, and there appears to be overgrowth on the surfaces of the crystals in addition to continued dissolution (Fig. 2). The new overgrown crystals are small, perfect rhombohedra with smooth faces (Fig. 2b), whereas the surface of the original crystal remains pitted and uneven.
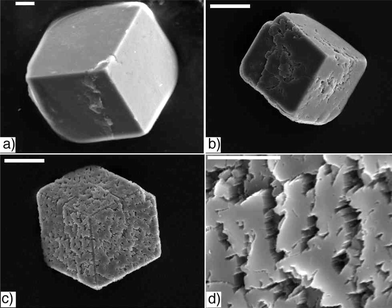 | ||
| Fig. 1 Changes in calcite surface texture as a function of time. Crystals removed from a gel of 1 after a) 3.5 hours, scale bar: 5 µm, b) 10.5 hours, scale bar: 20 µm, and c) 24 hours, scale bar: 20 µm. d) A magnified veiw of the surface texture of the 24 hour crystal shown in c), scale bar: 5 µm. | ||
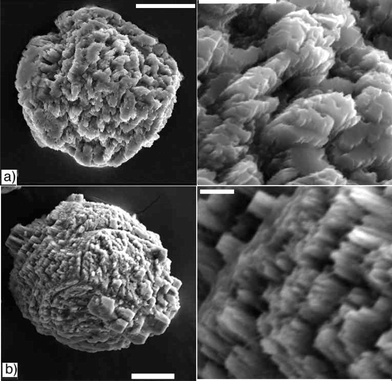 | ||
| Fig. 2 Changes in calcite surface texture as a function of time. Crystals removed from a gel of 1 after a) 48 and b) 168 hours (scale bars: 20 µm). A magnified view of the surface texture is shown to the right of each (scale bars: 5 µm). | ||
Dissolution experiments
To test our hypothesis that the unusual surface features were due to etching, a series of dissolution experiments were performed. All experiments were done using the 3.5 hour gel-grown crystals (Fig. 1a) which, after removal from the gel, appear as unaltered rhombohedral calcite crystals. We wanted to know if these crystals were “pre-programmed” to develop the surface features observed after longer growth times.Buffer and water
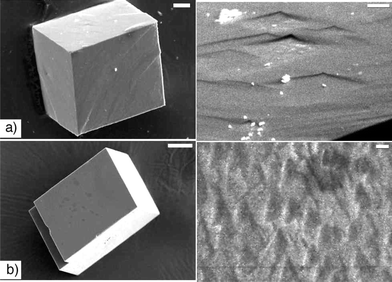
After 24 hours in a Tris solution (50 mM, pH 9), the 3.5 hour gel-grown crystals develop etch pits similar to those observed on crystals that continue to grow in the gel, although the etching was less severe (Fig. 3b). Even more strikingly, after a similar time period in HPLC grade water (∼ pH 6), the same crystals dissolve completely. If removed from the water after 2.5 hours, severe etching, similar to that observed under basic conditions, is observed (Fig. 3a). Control calcite crystals exposed to similar conditions (water or Tris) show no significant dissolution after equivalent times (Fig. 4). The etch pits that do appear are shallow and geometric, which is consistent with literature reports of how calcite is etched in different solutions.33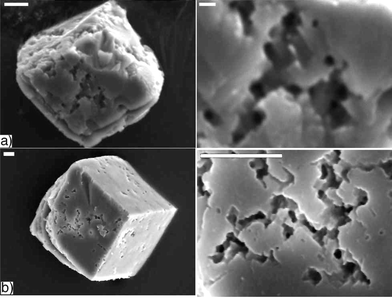 | ||
| Fig. 3 Etching of calcite crystals grown in a gel of 1 removed after 3.5 hours. a) After treatment with distilled water for 2.5 hours (scale bar left: 5 µm, right: 1 µm). b) After treatment with Tris (50 mM, pH 9) for 24 hours (both scale bars: 5 µm). | ||
 | ||
| Fig. 4 Etching of control calcite crystals. a) After treatment with distilled water for 24 hours (scale bar left: 20 µm, right: 5 µm). b) After treatment with Tris (50 mM, pH 9) for 24 hours (scale bar left: 50 µm, right: 2 µm). | ||
Gelator as etchant
Another possibility examined was that the gelator, 1, itself became the etching agent as time progressed. It was possible that as the calcium supply was depleted (due to crystal growth), the gelator, which is known to bind Ca2+,24,25 became “Ca2+-starved” and began dissolving the crystals to reclaim the Ca2+.34 To test this, a solution of 1, at the same concentration as the gel (3.2 mM 1 in 50 mM Tris, pH 9), with no added salt,35 was used as the etching solution for both control calcite crystals and 3.5 hour gel-grown crystals (Fig. 5). 1 does not etch like a chelator (EDTA) however, it also does not produce the very deep etch pits observed over time in the gel. This suggests that 1 is not causing the formation of the etch pits by acting from solution after crystal growth.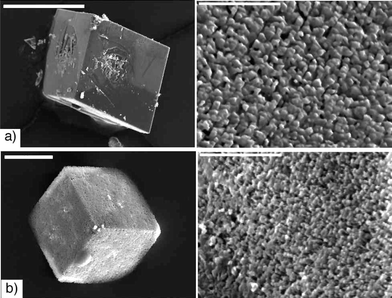 | ||
| Fig. 5 Etching with 1 (3.2 mM 1 in 50 mM Tris) for 24 hours of a) a control calcite crystal (scale bar: 200 µm) and b) a 3.5 hour gel-grown crystal (scale bar: 20 µm). The right hand column show high magnification images of the crystal surfaces (Scale bars: 5 µm). | ||
Discussion
Both the unique surface features that develop with time and the dissolution behavior of the gel-grown crystals indicate that the organic hydrogel alters the growth and physical characteristics of these calcite crystals as compared to those formed from aqueous solutions. A probable cause of these observations is the occlusion of gelator material inside the growing crystal lattice.36 The observed overgrowth on the crystals left in the gel for over 48 hours (Fig. 2), can be attributed to a ripening process in which more soluble areas (those containing occluded gelator) are dissolved and more stable calcite (without occluded material) is slowly reprecipitated (Ostwald ripening).37Precedents for the occlusion of gels into crystal lattices
There are reports in the literature of polymeric gel matrices (agarose and silica) being occluded into protein crystals.38,39 In addition, calcite crystals grown in silica,40 polyacrylamide15,17 and gelatin15,17 gels have been shown to incorporate the gel matrix. Interestingly, the force of a growing crystal41 is greater than the force required to break most polymer gels.9,39,42 Therefore, there must be an interaction between the crystals and the gel matrix that causes the occlusion of the gel rather than causing it to break. In addition, the occluded gel material does not affect the diffraction of the protein crystals indicating that, in at least one example, the fibers are randomly incorporated.39Dissolution of biogenic minerals
There have been several reports of unusual etching behavior of biominerals, perhaps due to occluded macromolecules. For example, Ryall et. al. have demonstrated that the occlusion of proteins into calcium oxalate urinary crystals makes the crystals more susceptible to etching by NaOH and proteases.43 Calcitic sea urchin spicules, sponge spicules and brittle star vertebrae, were observed to be etched during overgrowth experiments, while new crystals developed on the surfaces.44,45 Finally, it is well documented that the mineralized skeletons of different species of marine plankton (e.g. coccolithophora and foraminifera) have different solubilities.46 All of these observations suggest that as a result of occluded macromolecules, the biological materials have increased solubility as compared to synthetic calcite.Designer etchants
Lahav, Leiserowitz and co-workers have designed additives to etch organic crystals in a controlled fashion.47,48 By constructing molecules that resemble the substrate, it is possible to stereoselectively bind to specific crystallographic sites. In this way, dissolution is retarded in certain directions and enhanced in others, resulting in etch pits with a controlled shape and orientation. In similar work, carboxylate-containing additives, when absorbed onto the surface of calcite, have been shown to retard dissolution, presumably by lowering the surface energy and protecting the surface. 30,32,49 It is important to emphasize the difference between surface-absorbed impurities, such as those discussed above, and occluded material, such as the gelator aggregates discussed in this work. Additives only present on the surface can impede dissolution, while additives inside of the crystalline lattice may enhance it (see below). This may be why when 1 is used as an etchant, the gel-grown crystals do not develop any deep etch pits (Fig. 5b)The possible basis for altered dissolution of gel-grown crystals
The carboxylate groups of 1 have an affinity for the calcium ions on the surface of the growing calcite crystals and therefore promote adsorption.50 The lack of symmetry or consistent geometry of the etch pits observed on the gel-grown crystals suggests that while this interaction is strong, it is also non-specific. The effect on growth is also weak and non-specific, suggesting that adsorption occurs at imperfections. Etching with the “Ca2+-starved” gelator, which shows no preferential etch patterns (Fig. 5), also supports a non-specific interaction. We propose, therefore, that gelator molecules or aggregates preferentially absorb onto the calcite crystals at sites of imperfections (screw dislocations, kink sites etc.), which are distributed randomly over the crystal surface, and subsequently become occluded. The accumulation of aggregates at these sites amplifies the imperfections, resulting in more gelator becoming adsorbed at that location, further increasing the size (and depth) of the imperfection. It is well accepted that dislocations are the origin of etch pits.51,52 The presence of occluded gel material at these locations enhances the imperfections and thus increases dissolution along the path of the emerging imperfections, resulting in the irregular and deep etch pits observed.48,52 For crystals to develop the deep etch pits, gelator must be occluded during growth, which explains why etching control calcite crystals with a “Ca2+-starved” gelator solution does not produce similar results.Conclusions
The hydrogel formed by 1 provides a microenvironment in which the molecules that form the matrix also participate in the crystallization of calcite. In so doing, the physical properties of the crystals are altered. This system influences the nucleation and growth of inorganic crystals and allows us to gain insight into key factors governing biomineralization. It is well documented that organisms use macromolecules to control the growth of minerals.7 These macromolecules have many possible roles including specific adsorption onto growing crystal faces (which influences crystal morphology),53 intercalation into the crystalline matrix (which affects the fracture strength) and the display of ordered arrays of functionality for nucleation (which can control polymorph selectivity).10,54 One possible effect that has not been fully explored is an increased susceptibility to dissolution due to the occluded macromolecules. The results presented here suggest that during growth of calcite crystals in an organic hydrogel, gelator aggregates become occluded into the crystalline lattice at sites of imperfection and in turn alter the physical properties of the crystals, in particular their dissolution behavior.Experimental
The synthesis and properties of 1 have been reported previously.24,25Crystal growth
The crystal growth experiments were carried out in a 24-well plate mini-desiccator. (NH4)2CO3(s) was placed in one corner and covered with tin foil and sealed with Parafilm with only one needle hole in the center. CaCl2(s) and aqueous calcium chloride solutions were placed in between the carbonate source and the gel to slow diffusion and prevent condensation from forming and preventing visualization of the gel with the light microscope. A heated solution of 1 (3.2 mM) in 50 mM Tris buffer (pH 9) was filtered through a 0.45 µm hydrophilic PTFE syringe filter (Millipore) into the well. To initiate gelation, a small aliquot (depending on the desired final concentration) of 300 mM CaCl2 was added and the solution was briefly agitated. The cover of the 24-well plate was then sealed with Parafilm and the mini-desiccator was left undisturbed for the desired amount of time. The crystallization could be carried out under a dissecting microscope (Olympus SZH12, 7X-225X) to determine when the first crystals began to appear. After a certain period of time, the crystals were removed from the gel using drawn glass fibers. This was necessary since rinsing with aqueous or organic solvents and/or bleach treatment altered the appearance of the crystals, apparently via dissolution. The crystals could be manipulated away from the wet gel before it dried and appeared clean by SEM.Crystal dissolution
The dissolution experiments were carried out using crystals removed from the gel (with glass fibers) after 3.5 hours of growth as well as control calcite crystals grown from 7 mM CaCl2 solution in the same set-up. Glass coverslips (FisherBrand, 12 mm dia.) were used as substrates for the growth to make manipulation easier. Ten to twenty crystals were placed in a well with the etching solution and then rocked on a rocking table (to prevent a build up of acid around the crystals) for a given amount of time. Glass fibers were again used to remove the etched crystals to minimize damage and they were then imaged with SEM.Scanning electron microscopy
The crystals were transferred to stubs covered with double-sided carbon tape and then sputter-coated with either carbon or gold. The samples were then either imaged by a JEOL JXA-8600 electron microprobe (Department of Geology, Yale University, New Haven, CT) or a JEOL 6400 scanning electron microscope (Electron Microscope Facility, Weizmann Institute of Science, Rehovot, Israel).Acknowledgments
The authors thank the NSF (CHE0131477) and the Yale-Weizmann Exchange Fund for financial support of this research. Dr Jim Eckert (Yale University) provided technical support for the SEM. LA is the incumbent of the Dorothy and Patrick Gorman professorial Chair of Biological Ultrastructure and SW is the incumbent of the Dr. Walter and Dr. Trude Burchardt Professorial Chair of Structural Biology at the Weizmann Institute of Science.References
- Y. Levi-Kalisman, G. Falini, L. Addadi and S. Weiner, J. Struct. Biol., 2001, 135, 8 CrossRef CAS.
- E. Murayama, Y. Takagi, T. Ohira, J. G. Davis, M. I. Greene and H. Nagasawa, Eur. J. Biochem., 2002, 269, 688 CrossRef CAS.
- J. Moradian-Oldak, Matrix Biol., 2001, 20, 293 CrossRef CAS.
- S. Weiner, W. Traub and H. D. Wagner, J. Struct. Biol., 1999, 126, 241 CrossRef CAS.
- P. L. Clode and A. T. Marchall, Protoplasma, 2003, 220, 153 Search PubMed.
- R. J. Mashl, S. Joseph, N. R. Aluru and E. Jakobsson, Nano Lett., 2003, 3, 589 CrossRef CAS.
- S. Weiner and L. Addadi, J. Mater. Chem., 1997, 7, 689 RSC.
- Z. Pucar, B. Pokric and A. Graovac, Anal. Chem., 1974, 46, 403 CrossRef CAS.
- H. Henisch, Crystals in Gels and Liesegang Rings, Cambridge University Press, New York , 1988 Search PubMed.
- G. Falini, S. Albeck, S. Weiner and L. Addadi, Science, 1996, 271, 67.
- Y. Levi, S. Albeck, A. Brack, S. Weiner and L. Addadi, Chem. Eur. J., 1998, 4, 389 CrossRef CAS.
- G. Falini, S. Fermani, M. Gazzano and A. Ripamonti, Chem. Eur. J., 1997, 3, 1807 CrossRef CAS; G. Falini, S. Fermani, M. Gazzano and A. Ripamonti, Chem. Eur. J., 1998, 4, 1048 CrossRef CAS.
- N. Wada, M. Okazaki and S. Tachikawa, J. Cryst. Growth, 1993, 132, 115 CrossRef CAS; N. Wada, K. Yamashita and T. Umegaki, J. Colloid Interface Sci., 1999, 212, 357 CrossRef CAS.
- L. Fernandez-Diaz, A. Putnis, M. Prieto and C. V. Putnis, J. Sediment. Res., 1996, 66, 482 Search PubMed; N. Wada, K. Yamashita and T. Umegaki, J. Colloid Interface Sci., 1998, 201, 1 CrossRef CAS; N. Wada, K. Yamashita and T. Umegaki, J. Cryst. Growth, 1995, 148, 297 CrossRef CAS.
- O. Grassmann, G. Muller and P. Lobmann, Chem. Mater., 2002, 14, 4530 CrossRef CAS.
- J. Zhan, H. P. Lin and C. Y. Mou, Adv. Mater., 2003, 15, 621 CrossRef CAS.
- O. Grassmann, R. B. Neder, A. Putnis and P. Lobmann, Am. Miner., 2003, 88, 647 CAS.
- O. Grassmann and P. Lobmann, Chem. Eur. J., 2003, 9, 1310 CrossRef CAS.
- L. A. Estroff and A. D. Hamilton, Chem. Rev., 2003, submitted.
- P. Terech and R. G. Weiss, Chem. Rev., 1997, 97, 3133 CrossRef; D. J. Abdallah and R. G. Weiss, Adv. Mater., 2000, 12, 1237 CrossRef CAS; J. H. van Esch and B. L. Feringa, Angew. Chem., Int. Ed., 2000, 39, 2263 CrossRef.
- K. J. C. van Bommel, A. Friggeri and S. Shinkai, Angew. Chem., Int. Ed., 2003, 42, 980 CrossRef.
- E. D. Sone, E. R. Zubarev and S. I. Stupp, Angew. Chem., Int. Ed., 2002, 41, 1706 CrossRef CAS.
- J. D. Hartgerink, E. Beniash and S. I. Stupp, Science, 2001, 294, 1684 CrossRef CAS; J. D. Hartgerink, E. Beniash and S. I. Stupp, Proc. Natl. Acad. Sci. U. S. A., 2002, 99, 5133 CrossRef CAS.
- L. A. Estroff and A. D. Hamilton, Angew. Chem., Int. Ed., 2000, 39, 3447 CrossRef CAS.
- L. A. Estroff, L. Leiserowitz, L. Addadi, S. Weiner and A. D. Hamilton, Adv. Mater., 2003, 15, 38 CAS.
- S. Albeck, J. Aizenberg, L. Addadi and S. Weiner, J. Am. Chem. Soc., 1993, 115, 11691 CrossRef CAS.
- A small amount of vaterite was always formed, but this is consistent with the control experiments in the absence of gel that also contained some vaterite spherulites (see ref. 28).
- S. R. Dickinson, G. E. Henderson and K. M. McGrath, J. Cryst. Growth, 2002, 244, 369 CrossRef CAS.
- Interestingly, the vaterite crystals obtained in early experiments with low calcium concentrations also appear to have etch pits.
- R. G. Compton, K. L. Pritchard, P. R. Unwin, G. Grigg, P. Silvester, M. Lees and W. A. House, J. Chem. Soc., Faraday Trans. 1, 1989, 85, 4335 RSC.
- C. N. Fredd and H. S. Fogler, J. Colloid Interface Sci., 1998, 204, 187 CrossRef CAS.
- H. H. Teng and P. M. Dove, Am. Miner., 1997, 82, 878 CAS.
- N. E. Pingitore, S. B. Fretzdorff, B. P. Seitz, L. Y. Estrada, P. M. Borrego, G. M. Crawford and K. M. Love, J. Sediment. Petrol., 1993, 63, 641 Search PubMed.
- Calculations of the approximate amount of calcium consumed by crystal growth after 7.5 hours (when the etch pits begin appearing) indicate that there is sufficient (orders of magnitude) calcium remaining to satisfy the gelator.
- A solution of 1 with no added countercation does not form a gel and is stable on the benchtop for up to a week before becoming viscous (L.A. Estroff, PhD. Thesis, Yale University, New Haven, 2003).
- Assuming that as the crystal grows it neither pushes away the gel matrix or concentrates it, a 10 µm3 crystal (average size from microscopy) contains 0.03 pmoles of 1. This is approximately 0.1 wt% which is too small to be detected by many methods.
- M. L. Dundon and E. Mack, J. Am. Chem. Soc., 1923, 45, 2479 CrossRef CAS.
- J. M. Garcia-Ruiz, J. Cryst. Growth, 1985, 73, 251 CrossRef CAS.
- J. A. Gavira and J. M. Garcia-Ruiz, Acta Crystallogr., Sect. D: Biol. Crystallogr., 2002, 58, 1653 CrossRef.
- H. Nickl and H. Henisch, J. Electrochem. Soc., 1969, 116, 1258.
- According to an equation derived by Correns, this depends on the supersaturation and molar volume of the crystallizing compound. C. W. Correns, Faraday Discuss., 1949, 5, 267 Search PubMed.
- R. J. Flatt, J. Cryst. Growth, 2002, 242, 435 CrossRef CAS; X. Ping and J. J. Beaudoin, Cem. Concr. Res, 1992, 22, 631 CrossRef CAS.
- R. L. Ryall, D. E. Fleming, I. R. Doyle, N. A. Evans, C. J. Dean and V. R. Marshall, J. Struct. Biol., 2001, 134, 5 CrossRef.
- J. Aizenberg, S. Albeck, S. Weiner and L. Addadi, J. Cryst. Growth, 1994, 142, 156 CrossRef CAS.
- All of these elements are made of high Mg2+ calcite, which has a higher solubility than pure calcite. The overgrowth was pure calcite, suggesting that this may just be an example of Ostwald rippening, see ref. 37.
- D. B. Ryves, S. Juggins, S. C. Fritz and R. W. Battarbee, Paleogeogr. Paleoclimatol. Paleoecol., 2001, 172, 99 Search PubMed; M. J. Kennish and R. A. Lutz, Paleogeogr. Paleoclimatol. Paleoecol., 1999, 154, 293 Search PubMed; S. J. Brown and H. Elderfield, Paleoceanography, 1996, 11, 543 CrossRef; G. P. Lohmann, Paleoceanography, 1995, 10, 445 CrossRef; B. U. Haq, in Introduction to Marine Micropalaeontology, ed. B. U. Haq and A. Boersma, Elsevier, New York, 1978, pp. 79–108 Search PubMed.
- L. Addadi, Z. Berkovitch-Yellin, I. Weissbuch, J. vanMil, L. J. W. Shimon, M. Lahav and L. Leiserowitz, Angew. Chem., Int. Ed. Engl., 1985, 24, 466 CrossRef; L. J. W. Shimon, M. Lahav and L. Leiserowitz, J. Am. Chem. Soc., 1985, 107, 3375 CrossRef CAS; A. Peytcheva and M. Antonietti, Angew. Chem., Int. Ed., 2001, 40, 3380 CrossRef CAS.
- L. J. W. Shimon, M. Lahav and L. Leiserowitz, New J. Chem., 1986, 10, 723 Search PubMed.
- A. J. Barwise, R. G. Compton and P. R. Unwin, J. Chem. Soc., Faraday Trans., 1990, 86, 137 RSC.
- C. Geffroy, A. Foissy, J. Persello and B. Cabane, J. Colloid Interface Sci., 1999, 211, 45 CrossRef CAS; S. Mann, J. M. Didymus, N. P. Sanderson, B. R. Heywood and E. J. A. Samper, J. Chem. Soc., Faraday Trans., 1990, 86, 1873 RSC.
- I. N. MacInnis and S. L. Brantley, Geochim. Cosmochim. Acta, 1992, 55, 1113 CrossRef.
- F. C. Frank, in Growth and Perfection of Crystals, ed. R. H. Doremus, B. W. Roberts and D. Turnbull, John Wiley & Sons, Inc., New York, 1958, pp. 411–419 Search PubMed.
- J. Aizenberg, J. Hanson, M. Ilan, L. Leiserowitz, T. F. Koetzle, L. Addadi and S. Weiner, FASEB J., 1995, 9, 262 Search PubMed; J. Aizenberg, J. Hanson, T. F. Koetzle, S. Weiner and L. Addadi, J. Am. Chem. Soc., 1997, 119, 881 CrossRef CAS.
- A. Belcher, X. Wu, R. Christensen, P. Hansma, G. Stucky and D. Morse, Nature, 1996, 381, 56 CrossRef CAS.
Footnote |
| † Electronic supplementary information (ESI) available: Scanning electron micrographs of calcite etched with EDTA. See http://www.rsc.org/suppdata/ob/b3/b309731e/ |
| This journal is © The Royal Society of Chemistry 2004 |

