On the crystal structures and melting point alternation of the n-alkyl carboxylic acids†
Andrew D.
Bond‡
*
University of Cambridge, Department of Chemistry, Lensfield Road, Cambridge, CB2 1EW, U.K.
First published on 5th November 2003
Abstract
The crystal structures of the complete series of n-alkyl carboxylic acids from hexanoic to pentadecanoic acid have been determined following in situ crystallisation. The structures reveal that the melting point alternation across the series is correlated with alternating crystal density. All even acids crystallise from the liquid as the C modification, while the odd acids exhibit a transition from the C′ to the C″ modification between undecanoic and tridecanoic acid. In each structure, molecules form hydrogen-bonded dimers arranged into bilayers, with a rectangular packing arrangement in the plane perpendicular to the dimer long axes. The packing density within bilayers is comparable in each case and the alternating crystal density can be attributed solely to alternating packing density between bilayers. The carboxyl groups are identically disposed in all structures, but adjacent dimers are offset to differing degrees parallel to their long axes to reduce in-plane O⋯O repulsions, giving rise to angles between n-alkyl chains. The extent of the lateral offset diminishes in general across the series as the n-alkyl chains exert an increasing driving force towards parallel alignment. The systematic alternation in the packing density between bilayers arises as a result of different orientations adopted by the terminal C–C bonds with respect to the methyl group interface. Several of the key structural features may be rationalised using a simple two-dimensional model that describes the packing of modified parallelograms and trapezoids, representing the even and odd acids, respectively. Extension of the model into three dimensions permits complete rationalisation of the structures.
Introduction
As is the case for most terminally substituted n-alkane derivatives, the n-alkyl carboxylic acids display an alternation in their melting points between the odd and even members of the series.1 This must be attributed to variations in their crystal structures since the properties of the liquid phase, in particular boiling points, show a monotonic increase with chain length. Study of the carboxylic acids by X-ray diffraction dates almost to the very beginning of the technique: the crystal structure of the B form of octadecanoic (stearic) acid was determined successfully by Müller in 1927,2 only six years after the first investigations of organic crystal structures.3 Since these early studies, the acids that are solid under ambient conditions have been examined extensively, with notable contributions made by Lomer4 and von Sydow,5 and later by Goto and Asada.6The crystal structures of n-alkyl derivatives in general have been the subject of a great deal of previous experimental study and analysis. The packing of hydrocarbon chains in long-chain n-alkyl derivatives is such that the molecules are arranged into layers in which their long axes are parallel and close to normal to the plane of the layers. The possible close-packed arrangements of extended n-alkyl chains within such layers has been described in detail by Kitaigorodskii.7 From the perspective of melting point alternation, Larsson has suggested that “the molecular arrangement within the layers in homologously isomorphous series is the same in even and odd members” and that “the alternation of melting points depends only on differences in packing densities at the layer interface”.8
The phenomenon of melting point alternation in n-alkanes and their derivatives has recently received new attention, largely as a consequence of improved instrumentation and techniques for in situ crystallisation of low-melting materials—crystal structures that were previously elusive have become accessible. The seminal contemporary study of this kind is that by Boese et al. concerning the short-chain n-alkanes, propane to nonane.9 In that series, the melting point alternation is directly correlated with crystal density, the odd alkanes having a systematically lower density than the even alkanes and a systematically lower melting point. In accordance with Larsson's generalisation, this can be attributed to alternating packing density at the layer interface: optimal contacts are adopted between methyl groups at both ends of the even alkanes, but non-optimal contacts are adopted between methyl groups at one end of the odd alkanes. The origin of the effect can be localised to two-dimensional close-packed sections through the acid layers; the observed crystal structures can be rationalised on the basis of a simple geometrical model that describes the packing of parallelograms (representing the centrosymmetric even alkanes) and trapezoids (representing the 2-fold symmetric odd alkanes) within these sections. Similar direct correlation between melting point and crystal density has also been observed in the α,ω-alkanediols,10 α,ω-alkanediamines10 and α,ω-alkanedithiols.11 Of particular relevance to the work described here is a recent study of the α,ω-alkanedicarboxylic acids, oxalic (C2) to sebacic (C10) acid, in which it was observed that the alternating melting point is inversely correlated with crystal density.12 Again, the origin of this effect may be localised to planar sections through the crystal structures; the different arrangements observed for the odd and even diacids may be rationalised on the basis of a two-dimensional model based on modified parallelograms and trapezoids. In both the odd and even diacids, layered structures are formed through hydrophobic interactions between n-alkyl chains. In the even diacids, molecules are offset along their long axes to reduce in-plane O⋯O repulsions between carboxyl groups. In the odd diacids, attainment of a similar offset arrangement is not consistent with a dense packing arrangement of trapezoids and repulsive contacts between carboxyl groups are reduced instead by intramolecular distortions that give rise to higher-energy molecular conformations, and therefore lower melting points.12
The origin of the odd-even melting point alternation in the n-alkyl carboxylic acids should be similarly elucidated by the crystal structures that are in equilibrium with the liquid phase. It has been reported previously that this is the C modification for the even acids and the C′ modification for the odd acids.13 Crystallographic study of these phases is complicated, however, by the fact that they are relatively low-melting and often are stable over only a limited temperature range. As a result, few C/C′ structures have been reported to date. The structures of the C form of dodecanoic acid (C12)14 and the C′ form of undecanoic acid (C11) were determined almost 50 years ago (the latter only in 2-dimensional projection)15 and the C form of stearic acid (C18) has been determined only slightly more recently from powder X-ray diffraction data.16 On the basis of the first two of these structures, von Sydow suggested that differences between the C and C′ structures arise as a result of interactions between methyl groups at the molecular termini, causing molecules “to arrange themselves in different ways for the (odd and even) cases, seeking the largest possible van der Waals interaction”.17 From the same two structures, Kitaigorodskii noted that the carboxyl groups are identically disposed relative to one another in the C and C′ forms and that this is “not contrary to the most favourable positions for the terminal methyl groups” in the C structures, but “results in less favourable layers” in the C′ structures.18 In addition, the acid dimers in C12 are displaced laterally along their molecular axes by ca. 0.3 Å from ideal positions, which “while unfavourable to the alkyl chains, produces a favourable positioning of the carboxyl groups”. In this study of 1961, Kitaigorodskii also noted that “unfortunately, the data on the fatty acids are scanty”.
In the years since these studies, the crystal structures of the short-chain members of the series, methanoic to pentanoic acid (C1–C5), have been determined.19–23 As is common for the early members of most homologous chemical series, however, their crystal structures display considerable variation and they have not yet resulted in any deeper understanding of the melting point alternation. The crystal structures of the intermediate members, hexanoic (C6) to decanoic (C10) acid, still have not been reported to date, presumably as a result of difficulties associated with crystallising these low-melting materials—attempts to determine their structures must surely have been made. For the higher acids, numerous polymorphic forms have been reported,6 but the crystal structures that are in equilibrium with the liquid (relevant to the discussion of melting points) have also largely remained elusive.
Reported here are the crystal structures of the complete series from hexanoic (C6) to pentadecanoic acid (C15), including full redeterminations of the structures of C11 and C12, all of which were obtained following in situ crystallisation from the liquid. The redetermination of C11 provides a full three-dimensional structure to supersede the previous two-dimensional projection.15 The redetermination of C12 was undertaken at 270 K, the temperature of interest for the comparative study. With the exception of tridecanoic acid (C13) and C15, the C/C′ structures identified by von Sydow are obtained. For C13 and C15, a new crystal modification (denoted C″) is identified. The complete series of structures facilitates rationalisation of the melting point alternation in the n-alkyl carboxylic acids (C6 and higher), some 125 years after its first observation.
Experimental
Crystal growth
Crystals were grown in glass capillaries mounted on a Nonius KappaCCD diffractometer equipped with an Oxford Cryosystems N2 cryostream. Crystals of C6–C9, which are liquid under ambient conditions, were grown at a temperature only slightly below the melting point of the sample in the capillary tube, using a simple zone-refinement technique described previously.24 Crystals of C10–C15, which are solid under ambient conditions, were obtained using a slight variation of the technique: the N2 gas stream was set at a temperature just below the melting point of the sample (but above room temperature) and melting outside of the gas stream was effected by passing the capillary tube into a heated metal block, effectively “raising room temperature”. It is noteworthy that the in situ technique proved effective for the samples that melt above room temperature where conventional methods of crystal preparation (i.e. from solvents or from conventional slow cooling of the melt) fail, the latter providing only waxy solids. The practical limit of the in situ equipment was reached at C15, however, with the upper temperature limit of the cryostream and heating block preventing crystallisation of C16 and higher. Once grown, crystals were cooled where possible prior to data collection. In all cases, lattice parameters measured at the lower temperature were comparable to those measured just below the melting point. For most of the samples, in particular the odd members of the series, the crystals were stable over only a limited temperature range and the diffraction patterns deteriorated significantly or were lost entirely on further cooling. In these cases, data were collected only a few degrees below the temperature at which the crystal was grown.§Isothermal density measurement
The limited temperature range of crystal stability prohibits direct isothermal measurement of crystal density. Comparative densities were sought, therefore, by measurement where possible and by extrapolation otherwise; 270 K was chosen as the temperature at which minimum extrapolation was required. For C8, C9, C10, C12, and C14, which are solid and remain crystalline at 270 K, cell parameters were measured directly and densities were calculated from these. For C6 and C7, which are liquid in the capillary tube at 270 K, cell parameters were measured at intervals from the melting point down to the limit of crystal stability and densities were extrapolated upwards. For C11, which is solid but ceases to diffract on cooling to 270 K, cell parameters were measured at 300 and 290 K only and the density was extrapolated downwards. For C13 and C15, it was possible to collect data only at a single temperature (310 and 320 K, respectively) and the densities at 270 K were estimated by comparison with the thermal density variation of the other acids (see the Electronic supplementary information).Results and discussion
Correlation between melting point and crystal density
Table 1 lists the space group and unit-cell parameters for C6–C15, together with the crystal density at both the temperature of the full structure determination and at 270 K. For the even acids, the C modification is obtained from the liquid throughout the series. For the odd acids, a distinct transition exists: for C7, C9 and C11, the C′ modification is obtained from the liquid, while for C13 and C15, a new C-centred monoclinic modification is obtained, hereafter denoted the C″ form. Despite this structural transition, the crystal densities at 270 K show a continuous alternation across the entire series that is directly correlated with the melting point (Fig. 1).25 Rationalisation of the melting point alternation therefore requires explanation of the alternating crystal density. In all structures C6–C15, molecules are linked into centrosymmetric dimers via O–H⋯O hydrogen bonds; these dimers are arranged into bilayers parallel to the crystallographic bc plane [Figs. 2(a)–(c)]. Discussion of the crystal structures may therefore be separated into description of the packing arrangements within bilayers and the arrangements between bilayers.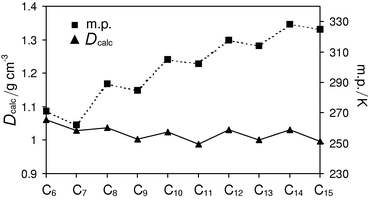 | ||
| Fig. 1 Melting point and crystal density at 270 K for C6–C15. | ||
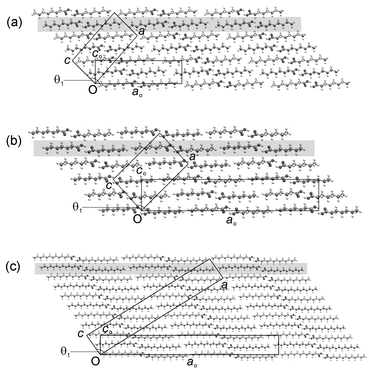 | ||
| Fig. 2 Representative projections of (a) C8, (b) C7 and (c) C13 along the b direction (equivalent to bo) showing three bilayers in each structure, with the definitions of the orthogonal and true monoclinic unit cells. The aobo planes referred to in the text are shaded. | ||
| Structure modification | Space group | a/Å | b/Å | c/Å | β/° | U cell/Å3 | T/K | D calc/g cm−3 (at T) | D calc/g cm−3 (at 270 K) | M. p./K | |
|---|---|---|---|---|---|---|---|---|---|---|---|
| a Measured. b Extrapolated. c Estimated. | |||||||||||
| C6 | C | P21/c | 15.0180(15) | 5.0236(5) | 9.9426(6) | 106.549(5) | 719.0(1) | 240 | 1.073 | 1.060b | 271 |
| C7 | C′ | P21/c | 16.0089(15) | 5.0764(4) | 10.1589(7) | 92.864(3) | 824.6(1) | 230 | 1.049 | 1.029b | 262 |
| C8 | C | P21/c | 18.6641(11) | 4.9756(3) | 9.5741(5) | 95.774(2) | 884.6(1) | 170 | 1.083 | 1.038a | 289 |
| C9 | C′ | P21/c | 21.1130(3) | 4.9188(6) | 10.1177(7) | 93.778(7) | 1048.5(2) | 270 | 1.002 | 1.002a | 285 |
| C10 | C | P21/c | 22.8440(16) | 4.9612(3) | 9.3977(6) | 93.559(4) | 1063.0(1) | 170 | 1.076 | 1.025a | 305 |
| C11 | C′ | P21/c | 25.839(3) | 4.9123(4) | 10.0285(11) | 99.010(3) | 1257.2(2) | 300 | 0.984 | 0.987b | 302 |
| C12 | C | P21/c | 27.563(2) | 4.9627(3) | 9.5266(6) | 98.006(2) | 1290.4(2) | 270 | 1.031 | 1.031a | 318 |
| C13 | C″ | C2/c | 59.880(2) | 4.9425(2) | 9.8118(5) | 93.800(2) | 2897.5(2) | 310 | 0.983 | 1.000c | 314 |
| C14 | C | P21/c | 31.559(3) | 4.9652(5) | 9.4260(11) | 94.432(4) | 1472.6(3) | 270 | 1.030 | 1.030a | 328 |
| C15 | C″ | C2/c | 69.258(3) | 4.9556(2) | 9.7197(4) | 98.024(2) | 3303.3(2) | 320 | 0.975 | 0.997c | 325 |
Packing arrangements within bilayers
Projection of a single bilayer perpendicular to the b axis of the unit cell and approximately along the long axes of the acid dimers reveals a rectangular packing arrangement in each case (Fig. 3), similar to that observed in the crystal structures of the higher long-chain n-alkanes.7 The packing arrangement may be described by a planar cell with dimensions bo and co, where bo is identical to b, and co is the projection of the c axis of the monoclinic unit cell onto the plane perpendicular to the projection direction.26 The projection defines an orthogonal set of reference axes within each structure, with dimension ao perpendicular to the boco plane (Fig. 2). The aobo plane defined in this manner forms a convenient reference within bilayers for subsequent discussion of the structures. The proper magnitude of ao (Table 2) takes into account the packing arrangements between bilayers: in the C structures of the even acids, the translational repeat distance along ao includes every bilayer, while in both the C′ and C″ structures of the odd acids the translational repeat distance along ao includes every second bilayer, so that ao is doubled with respect to the even structures.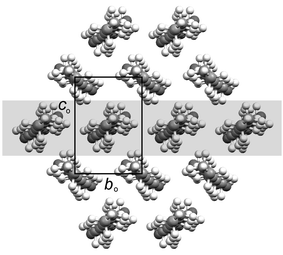 | ||
| Fig. 3 Representative projection of a single bilayer along the ao direction. One aobo plane referred to in the text is shaded. | ||
| a o/Å | b o/Å | c o/Å | θ 1/° | |
|---|---|---|---|---|
| a The quantities are derived from full data sets and are therefore temperature-dependent to some degree. | ||||
| C6 | 20.235 | 5.0236 | 7.074 | 134.6 |
| C7 | 42.963 | 5.0764 | 7.542 | 132.1 |
| C8 | 25.372 | 4.9756 | 6.994 | 133.1 |
| C9 | 53.601 | 4.9188 | 7.952 | 128.2 |
| C10 | 30.470 | 4.9612 | 7.032 | 131.6 |
| C11 | 63.739 | 4.9123 | 8.032 | 126.8 |
| C12 | 35.626 | 4.9627 | 7.299 | 130.0 |
| C13 | 73.739 | 4.9425 | 7.948 | 125.9 |
| C14 | 40.715 | 4.9652 | 7.285 | 129.4 |
| C15 | 84.023 | 4.9556 | 7.933 | 125.3 |
Within a given bilayer in each structure, adjacent acid dimers in the aobo plane adopt face-to-face arrangements in which their constituent molecular planes (containing both the n-alkyl chains and the carboxyl groups) are parallel. Projection of these dimers onto the aobo plane (Fig. 4) reveals that the n-alkyl chains are parallel and offset along their long axes. The magnitude of the offset (Table 3) is a fractional multiple of 2.54 Å in each case and is therefore inconsistent with ideal close packing of parallel n-alkyl chains; this is the lateral offset of ca. 0.3 Å noted previously by Kitaigorodskii in the structure of C12.18 The offset diminishes in general across the series and displays an alternation effect, although the alternation is not continuous across the entire series. For C6–C11, the offset is systematically greater in the odd acids than the evens. For C12–C15, the offset is systematically greater in the even acids.
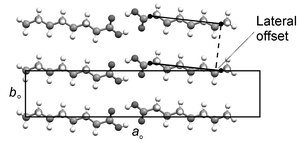 | ||
| Fig. 4 Representative projection (C8 illustrated) of a single aobo plane within a bilayer showing the lateral offset of adjacent acid dimers. | ||
| Dihedral angle between carboxyl groups in adjacent aobo planes/° | Lateral offset of dimers adjacent along bo/Å | Angle between n-alkyl chains in adjacent aobo planes, θ2/° | R.m.s. deviation of carboxyl group positions relative to C6/Å | V bilayer(1)/Å3 | V bilayer(2)/Å3 | |
|---|---|---|---|---|---|---|
| a The quantities are derived from full data sets and are therefore temperature-dependent to some degree. | ||||||
| C6 | 68.2 | 0.88 | 20.3 | 0 | 514.4 | 588.8 |
| C7 | 64.9 | 1.04 | 23.5 | 0.11 | 597.3 | 710.2 |
| C8 | 69.2 | 0.53 | 12.3 | 0.17 | 696.5 | 760.0 |
| C9 | 67.1 | 0.60 | 14.1 | 0.11 | 806.3 | 918.4 |
| C10 | 69.7 | 0.34 | 7.9 | 0.26 | 877.6 | 938.6 |
| C11 | 68.0 | 0.38 | 8.9 | 0.08 | 1008.3 | 1124.1 |
| C12 | 69.3 | 0.27 | 6.1 | 0.20 | 1095.2 | 1160.3 |
| C13 | 68.3 | 0.23 | 5.3 | 0.09 | 1193.1 | 1316.0 |
| C14 | 69.1 | 0.21 | 4.8 | 0.25 | 1280.4 | 1343.8 |
| C15 | 67.8 | 0.18 | 4.2 | 0.12 | 1390.2 | 1515.5 |
Acid dimers in adjacent aobo planes adopt edge-to-face arrangements, with dihedral angles between their constituent molecular planes in the range 64.9° (in C7) to 69.7° (in C10) (Table 3). Molecules in adjacent aobo planes are offset along ao, so that an angle (denoted θ1 in Table 2 and Fig. 2) is formed between the aobo plane and the methyl group interface (i.e., the bc face of the true unit cell).27 The n-alkyl chains of the acid dimers in adjacent aobo planes form angles (denoted θ2 in Table 3 and Fig. 5) in the range 23.5° (in C7) to 4.2° (in C15), diminishing in general with increasing chain length, with the relative rotation lying entirely in the aobo plane. For C6–C11, the angle θ2 is systematically greater in the odd acids, while for C12–C15, it is systematically greater in the even acids.
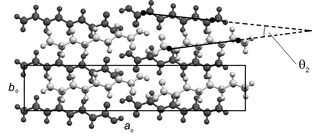 | ||
| Fig. 5 Representative projection (C8 illustrated) of two adjacent aobo planes. The upper plane is a lighter shade of grey. An angle (θ2) is formed between the long axes of n-alkyl chains in adjacent aobo planes. | ||
The relative arrangement of the carboxyl groups is essentially identical in each structure: the carboxyl groups (defined by the four atoms Cα–CO2) in the five dimers that comprise the rectangular repeating unit within each bilayer may be overlayed almost exactly for all structures. For the ten carboxyl groups described in each structure (40 atoms in total), the r.m.s. deviation of the atomic positions relative to those in C6 lies in the range 0.08 Å (in C11) to 0.26 Å (in C10) (Table 3).28 Adjacent dimers are positioned so that a hydrogen atom of the α–CH2 group in one acid molecule projects into the centre of the carboxyl groups of an adjacent dimer [Fig. 6(a)], in an interaction reminiscent of those commonly observed between C–H bonds and phenyl rings.29 In each case, the Cα–Cβ bond vector in one n-alkyl chain is aligned essentially parallel to the O⋯O vectors of the adjacent carboxyl groups [Fig. 6(b); see also the ESI].
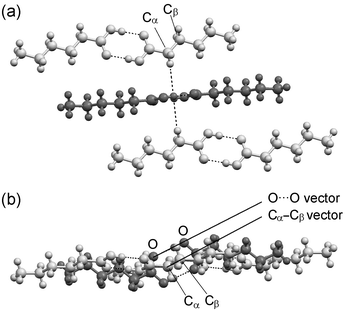 | ||
| Fig. 6 Representative view (C6 illustrated) of the relative arrangement of carboxyl groups in all structures. (a) View showing the hydrogens of the α-CH2 groups pointing towards the centroid of the carboxyl groups in an adjacent dimer. (b) Perpendicular view showing the parallel alignment of the Cα–Cβ and O⋯O vectors. | ||
The consistency of the relative arrangement of carboxyl groups is crucial to the overall arrangement within bilayers. Firstly, it leads to the adoption of the angles between the n-alkyl chains (Fig. 5). Where the dimers in one aobo plane are offset along their long axes, a second aobo plane placed above the first must be rotated (about co) in order for the carboxyl groups to maintain their optimum relative positions.30 The angle of rotation θ2 is linearly correlated with the magnitude of the lateral offset across the entire series (see ESI). Thus, as the extent of the lateral offset decreases across the series, the angle between the long axes of the acid dimers within a given bilayer also decreases and both parameters display an alternation that has a discontinuity between C12 and C13. Secondly, the consistent relative arrangement of carboxyl groups leads to different arrangements of the terminal C–C bond vectors relative to the methyl group interface for odd and even acids. In the even acids, the terminal C–C bond vectors adopt a relatively small angle to the methyl group interface, while in the odd acids a much greater angle is formed (Fig. 7).31
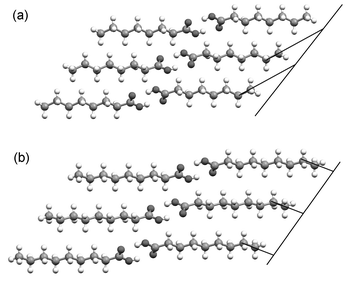 | ||
| Fig. 7 Different alignment of the terminal C–C bond vectors with respect to the methyl group interface in (a) the even acids and (b) the odd acids. The carboxyl groups are identically disposed in each case. | ||
Packing arrangements between bilayers
The packing arrangements between bilayers may be described by considering projections of the terminal C–C bonds in the n-alkyl chains onto the plane of the methyl group interface (i.e., the bc plane of the monoclinic unit cell). In projection onto this plane, an idealised rectangular arrangement of dimers contains two equivalent sets of interstitial hollows, denoted A and B (Fig. 8), only one set of which can be occupied at any one time. The actual arrangement at the methyl group interface differs from this idealised model in two respects. Firstly, the projections of the terminal C–C bond vectors are directional and the C–C bond at the centre of the rectangular arrangement points in a direction different from those at the corners. Hence, the two types of n-alkyl chain and, therefore, the two sets of hollows A and B, are not equivalent. Secondly, since the n-alkyl chains form angles in the aobo plane, the methyl carbon of the central n-alkyl chain does not in fact lie at the centre of the bc face. The fractional coordinate along the c direction is exactly 0.5 in each case (being the translational component of a c glide perpendicular to b), but the coordinate along the b direction is variable (Table 4). The deviation from the ideal centred rectangular arrangement is determined by the angle (θ2) formed between n-alkyl chains in adjacent aobo planes within bilayers.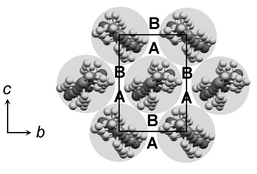 | ||
| Fig. 8 Idealised representation of the methyl group interface, illustrating the two sets of hollows, denoted A and B. | ||
| Angle of terminal C–C bond vector to bc plane/° | Position of C atom of central methyl group in bc face (fractional coordinates: b,c) | Origin offset of bc faces in adjacent bilayers (fractional coordinates: b,c) | Contact (i)/Å | Contact (ii)/Å | Contact (iii)/Å | V Me(1)/Å3 | V Me(2)/Å3 | |||
|---|---|---|---|---|---|---|---|---|---|---|
| a The quantities are derived from full data sets and are therefore temperature-dependent to some degree. | ||||||||||
| C6 | 29.5 | 0.49 | 0.50 | −0.01 | 0.29 | 4.204(5) | 4.204(5) | 3.853(4) | 204.6 | 130.3 |
| C7 | 47.2 | 0.10 | 0.50 | −0.40 | −0.30 | 3.946(5) | 3.946(5) | 4.261(8) | 227.3 | 114.4 |
| C8 | 26.2 | 0.46 | 0.50 | −0.04 | 0.30 | 4.083(6) | 4.083(6) | 3.897(5) | 188.1 | 124.6 |
| C9 | 52.9 | 0.23 | 0.50 | −0.28 | −0.31 | 4.041(9) | 4.041(9) | 4.327(9) | 242.2 | 130.1 |
| C10 | 25.7 | 0.42 | 0.50 | −0.08 | 0.31 | 4.072(6) | 4.072(6) | 3.948(6) | 185.4 | 124.5 |
| C11 | 58.1 | 0.32 | 0.50 | −0.18 | −0.33 | 4.05(2) | 4.05(2) | 4.34(3) | 248.9 | 133.1 |
| C12 | 27.0 | 0.40 | 0.50 | −0.10 | 0.30 | 4.178(7) | 4.178(7) | 3.982(7) | 195.2 | 130.1 |
| C13 | 62.8 | 0.60 | 0.50 | 0.60 | 0.15 | 3.67(2) | 4.28(2) | 4.42(2) | 255.7 | 132.7 |
| C14 | 26.6 | 0.39 | 0.50 | −0.11 | 0.30 | 4.157(6) | 4.157(6) | 3.984(6) | 192.2 | 128.8 |
| C15 | 66.1 | 0.58 | 0.50 | 0.58 | 0.14 | 3.77(2) | 4.25(2) | 4.49(3) | 261.5 | 136.1 |
In the C structures of the even acids, the offset of equivalent bc faces across the bilayer interface is ca. (0, +0.3c) in each case (Table 4), bringing the methyl groups of one bilayer into one set of hollows in the adjacent bilayer [arbitrarily denoted A; Fig. 9(a)]. In the C′ structures of C7, C9 and C11, the offset of adjacent bc faces along c is ca. −0.3 in each case, bringing the methyl groups of one bilayer into the B hollows in the adjacent bilayer [Figs. 9(b) and 9(c)]. The offset of the origins along b is variable since the offset of the central carbon atom in the rectangular arrangement causes the position of the centroid between the atoms comprising the hollow to shift along b from C7 to C11. In the C″ structures of C13 and C15, the offset of adjacent bc faces is ca. (0.5b, +0.15c) in each case, resulting again in occupation of the B set of hollows [Fig. 9(d)]. The arrangement differs from that of the C′ structures, however: in C13 and C15, the central methyl group in the rectangular arrangement occupies the B hollows, while in the C′ structures, the same hollows are occupied by methyl groups from the corners of an adjacent bc face.
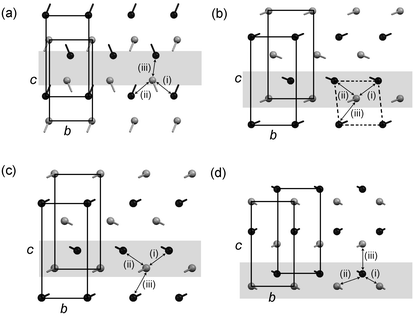 | ||
| Fig. 9 Projections of the terminal C–C bonds onto the bc face of the monoclinic unit cell for (a) the even acids, (b) C7, (c) the odd acids C9 and C11, and (d) the odd acids C13 and C15. The top layer in the projection is shaded grey and the bottom is black. The methyl C atom is represented as a circle and the bond to the adjacent CH2 group is indicated. Equivalent bc faces in adjacent bilayers and contacts (i)–(iii) are indicated. A single aobo plane referred to in the text is shaded. | ||
The three different arrangements in the C, C′ and C″ structures give rise to three different distributions of C⋯C contacts across the bilayer interface. The three shortest C⋯C distances between the methyl carbon atoms in adjacent bilayers are denoted (i), (ii) and (iii), according to Fig. 9, and their magnitudes are listed in Table 4. In the even acids, the shortest contact (iii) lies between methyl groups in the same aobo plane and is comparable to the “non-optimal staggered” contacts observed in the short-chain odd n-alkanes, heptane and nonane:9 the terminal C–C bond vectors are parallel, but offset laterally with respect to each other [Fig. 10(a)]. The C⋯C distances lie in the range 3.853(4)–3.984(6) Å, increasing continuously across the series (Table 4). Contacts (i) and (ii) lie between methyl groups in adjacent aobo planes, with the terminal C–C bonds forming a herringbone-type pattern [Fig. 10(a)].32 The magnitudes of the two C⋯C separations are equivalent in each case and lie in the range 4.072(6) Å (in C10) to 4.204(5) Å (in C6).
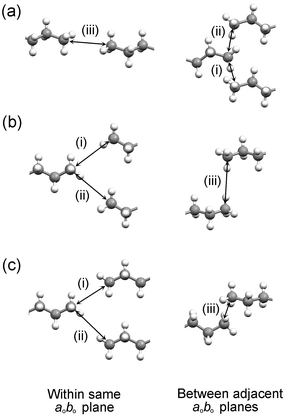 | ||
| Fig. 10 Contacts (i), (ii) and (iii) in (a) the C structures of the even acids, (b) the C′ structures of C7, C9 and C11, and (c) the C″ structures of C13 and C15. | ||
In the C′ structures of C7, C9 and C11, the terminal C–C bonds within aobo planes adopt a herringbone-type arrangement, in which the methyl groups approach adjacent n-alkyl chains in a side-on manner [Fig. 10(b)].33 The magnitudes of contacts (i) and (ii) are equivalent in each structure and lie in the range 3.946(5)–4.05(2) Å, increasing continuously from C7 to C11. Contact (iii), between methyl groups in adjacent aobo planes, involves parallel C–C bond vectors in each case, but the relative disposition of the two methyl carbons varies. In C7, the methyl groups in one aobo plane lie almost halfway between those in the adjacent aobo plane [Fig. 9(b)]. In C9, the methyl groups in one aobo plane are displaced from the middle of those in the adjacent aobo plane, while in C11, the two methyl groups lie almost directly one above the other (along co). Thus, from C7 to C11, the H atoms of these methyl groups adopt progressively shorter contacts of 2.82, 2.79 and 2.50 Å, respectively, and the magnitude of contact (iii) becomes progressively larger (Table 4).
In the C″ structures of C13 and C15, the shortest contact (i) within aobo planes is comparable to the “optimal staggered” contacts observed in the short-chain even n-alkanes, hexane, octane9 and decane:34 the terminal C–C bond vectors are parallel and meet in a linear fashion across a crystallographic centre of symmetry [Fig. 10(c)]. The magnitude of this contact is 3.67(2) Å in C13 and 3.77(2) Å in C15, significantly shorter than the “non-optimal staggered” contacts observed in the even acids. The second contact (ii) within aobo planes is formed to a methyl group adjacent along bo and is considerably longer.35 Contact (iii), between methyl groups in adjacent aobo planes, is similar to that in C11: the two methyl groups lie almost directly one above the other along co, with H⋯H contacts of 2.51 and 2.60 Å in C13 and C15, respectively [Fig. 10(c)]. In contrast to C7, C9 and C11, the C–C bond vectors form an angle to each other in projection onto the aobo plane, but this does not influence significantly the nature of the contact; the arrangement of the terminal methyl groups is essentially identical in each case. The increase in the magnitude of contact (iii) is continuous across the entire series of odd acids, becoming insignificantly different at C13 and C15.
In each of the structures, contacts (i) and (ii) are consistent with dense packing between bilayers. The most significant difference between the odd and even acids lies in the nature of contact (iii): in the even structures, this contact is also consistent with dense packing between bilayers, but in the odd structures it leads in general to longer C⋯C separations. The difference arises as a result of the orientation of the terminal C–C bond vectors with respect to the methyl group interface. In the even structures, the C–C vectors comprising the contact are aligned so as to form a linear staggered arrangement. In the odd acids (both the C′ and C″ structures), the C–C vectors are oriented so that the same relative positions of the methyl carbons give rise to an edge-on contact with short H⋯H separations (Fig. 11). The fact that contact (iii) arises in the C′ structures between C–C vectors that are parallel in projection onto the aobo plane, but in the C″ structures between C–C vectors in a herringbone arrangement has no bearing on its inherent unfavourable nature. The detrimental influence of the contact is greatest in C13 and C15 where the arrangement of the methyl groups at the bilayer interface is closest to centred rectangular. In C11, C9 and C7, the unfavourable contact is progressively alleviated by movement of one methyl group from the centre of the bc face, as the angle θ2 increases towards C7.
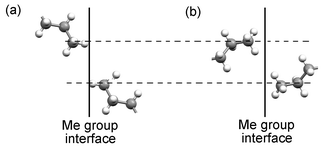 | ||
| Fig. 11 Differing nature of contact (iii) in (a) the even acids and (b) the odd acids. The C atoms of the methyl groups are identically disposed in each case. The difference arises as a result of the orientation of the terminal C–C bond vector with respect to the methyl group interface. | ||
Quantifying the contributions to the packing density
To quantify the respective contributions to the packing density from within and between bilayers, the unit cell may be partitioned into two sections. The volume of the parallelpiped defined by two equivalent bc faces across the bilayer, denoted Vbilayer, provides a suitable measure of the packing density within bilayers. A measure of the packing density between bilayers, denoted VMe, is then given by the volume of the parallelpiped defined by two equivalent bc faces across the bilayer interface. The sum of Vbilayer and VMe is of course Ucell. Two points may be envisaged at which to set the division between Vbilayer and VMe: the C atoms of the CH2 groups adjacent to the terminal methyl groups [Fig. 12(a)] or the the C atoms of the terminal methyl groups themselves [Fig. 12(b)]. The volume derived for the methyl group interface in the two cases is denoted VMe(1) and VMe(2), respectively (Table 4), and the corresponding volumes within bilayers are denoted Vbilayer(1) and Vbilayer(2) (Table 3). The quantity VMe(2) describes only the closeness of the approach between the C atoms of the methyl groups, while VMe(1) also takes into account the differing angles formed by the terminal C–C bond vectors to the methyl group interface.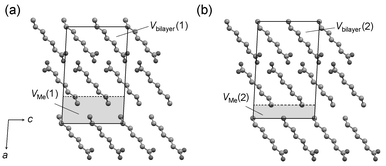 | ||
| Fig. 12 Partitioning of the unit cell to define (a) Vbilayer(1) and VMe(1), and (b) Vbilayer(2) and VMe(2) (C7 illustrated, H atoms omitted). | ||
V bilayer(1) increases monotonically across the series, illustrating that the packing density within bilayers is identical in each structure. This observation is consistent with the identical disposition of carboxyl groups in each case. The corresponding value VMe(1) displays a continuous alternation across the series, being systematically greater for the odd acids than for the evens. Thus, the packing density between bilayers is systematically less in the odd acids compared with the evens and it is this effect alone that leads to the overall lower density in the odd structures. The values of Vbilayer(2) and VMe(2) indicate that there are two contributions to the decreased packing density: with the exception of C7, VMe(2) is systematically greater for the odd acids than for the evens, demonstrating that the terminal methyl groups simply approach each other less closely in the odd structures. This may be attributed largely to the differing nature of contact (iii). Secondly, the systematically greater angles formed by the terminal C–C bond vectors to the methyl group interface contribute to the reduced packing density between bilayers in the odd structures. This is apparent from simple geometrical considerations: the quantity VMe(1) is defined by the area of the bc face multiplied by the perpendicular separation between adjacent bc faces passing through the CH2 groups [Fig. 12(a)]. The bc area differs little across the series, but the perpendicular separation is systematically greater in the odd acids compared with the even acids since their terminal C–C bonds adopt systematically greater angles with respect to the methyl group interface (Table 4). The alternation of the quantity Vbilayer(2) clearly encompasses this effect.
The apparently anomalous value of VMe(2) for C7 is readily explained by considering the packing arrangements at the bilayer interface. As a result of the appreciable angle θ2 between the n-alkyl chains within bilayers in C7, the terminal methyl groups in the bc face in fact resemble more closely a square pattern rather than a centred rectangular one [Fig. 9(b)]. Thus, the terminal methyl groups in C7 project into hollows that are closer to square-shaped rather than triangular. As a result, the nature of contact (iii) becomes comparable to contacts (i) and (ii) in the even acids and all three are consistent with a dense packing arrangement.36 In geometric terms, the perpendicular separation between adjacent bc planes that define VMe(2) is considerably smaller for C7 since the terminal methyl groups project further into the square-shaped hollows than is possible with the triangular hollows of the other acids. The systematically greater value of VMe(1) for C7 therefore arises entirely from the greater angle formed by the C–C vectors to the methyl group interface, and is clearly attenuated to some extent compared with the other odd acids (Fig. 13).
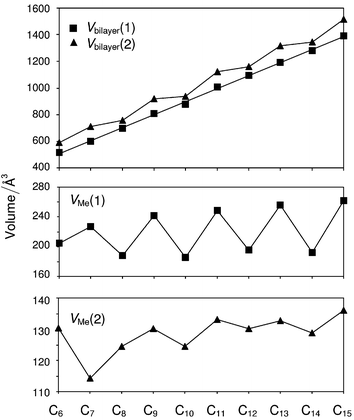 | ||
| Fig. 13 Variation of Vbilayer and VMe for C6–C15. A least-squares best-fit line is drawn for Vbilayer(1). For the other quantities, the lines connecting the data points are of no significance; they merely serve to highlight the trends. VMe(2) gives a measure of the closeness of the approach between the C atoms of the terminal methyl groups across the bilayer interface, while VMe(1) gives a measure of the overall packing density between bilayers. The values are derived from the full data sets and are therefore temperature-dependent to some degree. | ||
Rationalisation of the alternation of VMe(1) across the series accounts fully for the observed alternation in the overall crystal density and therefore in the melting points. To rationalise the observed crystal structures as a whole, however, several questions remain to be answered. (i) Why is the lateral offset of adjacent dimers systematically greater in the odd structures for C6–C11, but systematically less in the odd structures for C12–C15? (ii) Why does the extent of the lateral offset diminish in general across the series? (iii) Why do C7, C9 and C11 adopt herringbone arrangements in the aobo plane while C13 and C15 adopt linear staggered arrangements? (iv) Why does the transition occur from the C′ to the C″ structures between C11 and C13? Most of these observations can be rationalised using the simple parallelogram-trapezoid model that was effective previously for the n-alkanes9 and α,ω-alkanedicarboxylic acids.12 It is important to emphasise that in those cases, reduction to a two-dimensional model is possible since variation of the packing density in the third dimension is insignificant across each series. In the present case, the origin of the alternating crystal density cannot be localised to a single planar section and it is necessary to consider both the packing arrangements within the aobo planes and the manner in which adjacentaobo planes are arranged.
Packing description in the aobo plane: the parallelogram-trapezoid model
As described in the Introduction, the packing arrangements in the α,ω-alkanedicarboxylic acids may be rationalised on the basis of a simple geometrical model in which the even and odd diacids are represented by modified parallelograms and trapezoids, respectively.12 In the mono-acids described here, the parallelograms representing the even acids and the trapezoids representing the odd acids are paired in each case by the formation of an R22(8) hydrogen-bond motif between carboxyl groups [Figs. 14(a) and 14(b)] so that they may be represented by modified “double” parallelograms and trapezoids [Figs. 14(c) and 14(d)].37 This renders the basic unit centrosymmetric in every case. In addition, the difference between the even and odd acid dimers is more subtle than the difference between parallelograms and trapezoids: in the dimers of the even acids, the terminal C–C bond vectors lie parallel to the direction of the O–H⋯O hydrogen bonds, while in the dimers of the odd acids they lie at an angle of ca. 109.5°.38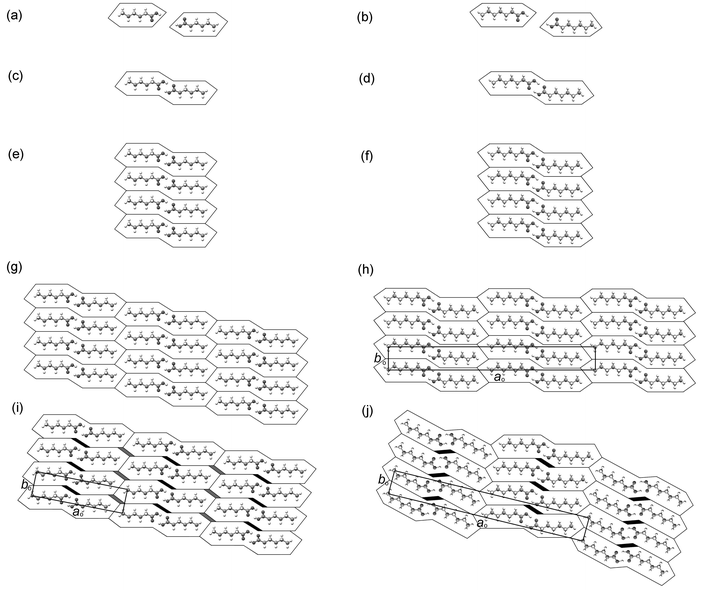 | ||
| Fig. 14 Geometrical model describing the possible packing arrangements of acid dimers in the aobo plane. Even acids (left) and odd acids (right) are represented by modified “double” parallelograms and trapezoids, respectively. The axes ao and bo are identified in (h)–(j). | ||
Columnar close packing of the n-alkyl chains in adjacent acid dimers may be envisaged along the bo direction [Figs. 14(e) and 14(f)], each column being a two-dimensional section in the aobo plane through the bilayers described previously. Two-dimensional close-packed arrangements may then be derived, similar to those illustrated in Figs. 14(g) and 14(h). Both of these packing arrangements, however, introduce relatively short intermolecular contacts between carboxyl groups in the aobo plane: a separation of ca. 5.0 Å between n-alkyl chains along bo gives rise to in-plane intermolecular O⋯O distances of ca. 2.0 Å (cf. the sum of the van der Waals radii of ca. 3.0 Å). To overcome these repulsive O⋯O contacts while maintaining close packing of the n-alkyl chains (i.e., without dramatically increasing the separation along bo), two modifications may take place. The carboxyl groups may rotate from the plane of the layers, either in the same direction to give face-to-face contacts, or in opposite directions to give edge-to-face contacts. The former is observed in all of the acid structures. In addition, the acid dimers may translate perpendicular to the column stacking direction, along the direction of the n-alkyl chain long axes, similar to the translation observed in the α,ω-alkanedicarboxylic acids.12 In the even acids, such a translation is potentially unrestricted and an arrangement similar to that shown in Fig. 14(i) results. The extent of the offset decreases from C6 to C14. In addition, translation approximately parallel to bo is observed in the even structures, each column sliding upwards with respect to the column on its left-hand side as depicted in Fig. 14(i). The extent of this translation increases across the series and at C12 and C14 it is sufficiently large that the long axes of the n-alkyl chains in adjacent columns are brought into an essentially co-linear arrangement. In the odd acids, however, translation perpendicular to the column stacking direction is restricted by the acid dimer geometry, with the orientations of the methyl groups at each end of the dimer preventing the carboxyl groups from moving apart. In the non-offset arrangement, translation parallel to bo is similarly restricted and the observed structures of C13 and C15 resemble closely that shown in Fig. 14(h).
Considering finally the C′ structures of C7, C9 and C11: the herringbone arrangement adopted by the acid dimers in adjacent columns may be represented schematically by Fig. 14(j). The crucial difference between this arrangement and the one illustrated in Fig. 14(h) is that the former allows for lateral offset of acid dimers within each column, while maintaining efficient packing of the terminal methyl groups. The optimal herringbone arrangement is one where the terminal C–C bonds are approximately perpendicular, that is the C–C bond vectors form an angle of ca. 45° to the methyl group interface. In C7, the observed angle to the interface is 47.2° (Table 4), but this increases progressively in C9 (52.9°) and C11 (58.1°) as the angle between the n-alkyl chain long axes in adjacent columns (equivalent to θ2) decreases. This is, of course, a consequence of the diminishing angle between the n-alkyl chains within bilayers, which is in turn a consequence of the diminishing lateral offset of adjacent dimers. Hence, as the lateral offset of the dimers diminishes, the packing density of the herringbone arrangement at the column interface decreases. Herein lies the origin of the transition from the C′ to the C″ structures: where the lateral offset within columns is large, the herringbone arrangement permits dense packing at the methyl group interface within the aobo plane. As the extent of the lateral offset decreases, the packing efficiency of the herringbone arrangement at the methyl group interface becomes less. At C13, the lateral offset becomes sufficiently small that the packing density of the herringbone arrangement is less than that of the linear staggered arrangement of Fig. 14(h) and the transition from the C′ to the C″ modification is observed.
Thus, the parallelogram-trapezoid model applied in the aobo plane permits rationalisation of several key structural features. It does, however, leave two questions unanswered. (i) Why does the lateral translation in the aobo plane diminish in general across the series? (ii) Why in the even acids does the arrangement of the methyl groups at the bilayer interface in the aobo plane deviate progressively from the optimal staggered arrangements that might be expected? To rationalise these features, it is necessary to extend the model into three dimensions, considering also the manner in which adjacentaobo planes are arranged.
The influence of the packing in the third dimension: the arrangement of adjacent aobo planes
The diminishing lateral offset within the aobo plane across the series may be attributed to an effect between adjacent aobo planes within bilayers. As described previously, lateral offset of adjacent acid dimers introduces angles between n-alkyl chains in adjacent aobo planes. The optimal arrangement of close-packed n-alkyl chains is parallel alignment of their long axes, as observed in the crystal structures of the n-alkanes themselves; this arrangement maximises attractive dispersion (hydrophobic) forces along the entire length of the n-alkyl chain. In the carboxylic acids, the n-alkyl chains are not quite close-packed, since the interchain spacing in the plane perpendicular to their long axes (along both bo and co) is determined by the arrangement of carboxyl groups rather than by the n-alkyl chains themselves. Hence, the various angles between the n-alkyl chains in adjacent aobo planes can be tolerated without variation in the packing density within bilayers. Nonetheless, as the length of the n-alkyl chain increases, the driving force towards parallel alignment increases and, therefore, the lateral offset between adjacent acid dimers within bilayers decreases. In the higher members of the series, the driving force towards parallel alignment also manifests itself in a slight bending of the n-alkyl chains to facilitate an arrangement closer to the optimal one at the ends of the chains distant from the carboxyl groups [see for example Fig. 2(c)]. The overall arrangement within bilayers results then from a balance between repulsive O⋯O contacts between carboxyl groups and a drive towards a parallel alignment of n-alkyl chains. The latter influence becomes progressively more significant as the length of the n-alkyl chain increases and the lateral offset of adjacent dimers in the aobo plane therefore decreases across the series.The origin of the deviation of the methyl groups from optimal staggered arrangements within the aobo plane in the even acids may be attributed to an effect between adjacent aobo planes between bilayers. The driving force for the observed arrangements at the methyl group interface is not the adoption of optimal staggered contacts as in the n-alkanes, but rather the drive towards effective packing of methyl groups in adjacent aobo planes, by adopting separations of 0.5bo [equalising contacts (i) and (ii)]. The separation along bo of the methyl groups in adjacent aobo planes within each bilayer moves progressively closer to 0.5bo as the angle θ2 between the n-alkyl chains within the bilayer decreases. Thus, the offset along bo between n-alkyl chains in adjacent aobo planes between bilayers must move progressively closer to zero, so that the n-alkyl chains in the same aobo plane in adjacent bilayers are brought progressively closer to co-linear alignment from C6 to C14. In the odd acids, both the herringbone arrangement of the C′ structures and the non-offset staggered arrangement of the C″ structures do not permit translation along bo of adjacent bilayers. Hence, there is no possibility for similar optimisation of the packing arrangements to alleviate the generally unfavourable contact (iii).
Conclusions
The melting point alternation in the n-alkyl carboxylic acids (C6 and higher) is directly correlated with alternating crystal density. In each case, the crystal structures that are in equilibrium with the liquid comprise hydrogen-bonded dimers that are arranged into bilayers. The packing density within bilayers is essentially identical in each case and the alternation in the overall crystal density may be attributed solely to alternating packing density between bilayers. This is in accordance with the statement made previously by Larsson.8 In contrast to Larsson’s statement, however, the packing arrangements within bilayers differ across the series. The observed arrangements may be rationalised on the basis of a balance between two competing driving forces: repulsive O⋯O contacts between carboxyl groups and attractive dispersion (hydrophobic) interactions between n-alkyl chains. The latter become relatively more significant as the n-alkyl chain length increases. The crucial constant feature within the structures is the identical relative disposition of carboxyl groups, in which one C–H bond of the α-CH2 group projects onto the centre of the carboxyl groups of an adjacent acid dimer. It is noteworthy that the same arrangement of carboxyl groups is also observed in the α,ω-dicarboxylic acids.12 Within this fixed framework, the lateral offset of adjacent acid dimers (to reduce in-plane repulsive O⋯O contacts) is directly correlated with the angles formed between n-alkyl chains. The lateral offset diminishes in general across the series as the longer n-alkyl chains exert an increasing driving force towards parallel alignment. The decreased packing density at the bilayer interface in the odd structures arises predominantly as a result of the different orientations adopted by the terminal C–C bonds with respect to the methyl group interface in the odd and even acids. With the exception of C7, the methyl groups also approach each other less closely in the odd acids compared to the even acids. Although it has not yet been possible to examine C16 and C17, it is expected that these two acids will continue the series in a predictable manner. The two-dimensional parallelogram-trapezoid model of Boese et al.9,12—applied here for the first time to molecules with two different end groups—is useful for rationalising several key structural features, but cannot account fully for the observed structures. Extension of the model into three dimensions permits complete effective rationalisation.Acknowledgements
This work was supported by the Engineering and Physical Sciences Research Council (EPSRC, U.K., Grant No. GR/R08919). I am grateful to Dr John E. Davies for expert assistance with crystal growth and for his continued support and encouragement, and to Profs. J. K. M. Sanders and Andrew B. Holmes for facilitating this research. I am also grateful to Roger Ward (Department of Chemistry, University of Cambridge) for the design and construction of the heating-block apparatus that made possible crystallisation of the higher acids.References
- (a) The first note regarding melting point alternation is attributed to Baeyer in an article dealing specifically with the n-alkyl carboxylic acids: A. Baeyer, Ber. Chem. Ges., 1877, 10, 1286 Search PubMed; (b) see also: A. W. Ralston, Fatty Acids and Their Derivatives, John Wiley & Sons, New York, 1948 Search PubMed.
- A. Müller, Proc. R. Soc. London, Ser. A, 1927, 114, 542.
- (a) W. H. Bragg, Proc. Phys. Soc. (London), 1921, 34, 33 Search PubMed; (b) W. H. Bragg, Proc. Phys. Soc. (London), 1922, 35, 167 Search PubMed.
- (a) T. R. Lomer, Nature (London), 1955, 176, 653 CAS; (b) T. R. Lomer and R. M. Spanswick, Acta Crystallogr., 1961, 14, 312 CrossRef CAS; (c) T. R. Lomer, Acta Crystallogr., 1963, 16, 984 CrossRef CAS.
- (a) E. von Sydow, Acta Crystallogr., 1954, 7, 529 CrossRef CAS; (b) A. Abrahamsson and E. von Sydow, Acta Crystallogr., 1954, 7, 591 CrossRef; (c) E. von Sydow, Acta Crystallogr., 1954, 7, 823 CrossRef; (d) E. von Sydow, Acta Crystallogr., 1955, 8, 845 CrossRef CAS; (e) E. von Sydow, Acta Chem. Scand., 1956, 10, 1; (f) K. Larsson and E. von Sydow, Acta Chem. Scand., 1966, 20, 1203 CAS.
- (a) M. Goto and E. Asada, Bull. Chem. Soc. Jpn., 1978, 51, 70 CAS; (b) M. Goto and E. Asada, Bull. Chem. Soc. Jpn., 1978, 51, 2456 CAS; (c) M. Goto and E. Asada, Bull. Chem. Soc. Jpn., 1980, 53, 2111 CAS; (d) M. Goto and E. Asada, Bull. Chem. Soc. Jpn., 1984, 57, 1145 CAS.
- A. I. Kitaigorodskii, Molecular Crystals and Molecules, Academic Press, New York, 1973, p. 48ff Search PubMed.
- K. Larsson, J. Am. Oil Chem. Soc., 1966, 43, 559 CrossRef CAS.
- R. Boese, H.-C. Weiss and D. Bläser, Angew. Chem., Int. Ed., 1999, 38, 988 CrossRef CAS.
- V. R. Thalladi, R. Boese and H.-C. Weiss, Angew. Chem., Int. Ed., 2000, 39, 918 CrossRef CAS.
- V. R. Thalladi, R. Boese and H.-C. Weiss, J. Am. Chem. Soc., 2000, 122, 1186 CrossRef CAS.
- V. R. Thalladi, M. Nüsse and R. Boese, J. Am. Chem. Soc., 2000, 122, 9227 CrossRef CAS.
- For the polymorphic acids, the various crystal modifications are denoted A, B, C, etc. for the even acids and A′, B′, C′, etc. for the odd acids. The classification is based on the magnitude of the perpendicular separation of crystallographically equivalent planes passing through the terminal methyl groups. The crystal modification with the longest observed separation is denoted A/A′, the second longest B/B′, etc. For a detailed discussion, see ref. 17.
- E. von Sydow, Acta Crystallogr., 1955, 8, 810 CrossRef CAS.
- V. Vand, W. M. Morley and T. R. Lomer, Acta Crystallogr., 1951, 4, 324 CrossRef CAS.
- V. Malta, G. Celotti, R. Zannetti and A. F. Martelli, J. Chem. Soc. B, 1971, 548 RSC.
- E. von Sydow, Arkiv Kemi, 1956, 9, 231 Search PubMed.
- A. I. Kitaigorodskii, Organic Chemical Crystallography, Consultants Bureau, New York, 1961, p. 208ff Search PubMed.
- (a) F. Holtzberg, B. Post and I. Fankuchen, Acta Crystallogr., 1953, 6, 127 CrossRef CAS; (b) I. Nahringbauer, Acta Crystallogr., Sect. B, 1978, 34, 315 CrossRef.
- (a) R. E. Jones and D. H. Templeton, Acta Crystallogr., 1958, 11, 484 CrossRef CAS; (b) I. Nahringbauer, Acta Chem. Scand., 1970, 24, 453 CAS; (c) P.-G. Jönsson, Acta Crystallogr., Sect. B, 1971, 27, 893 CrossRef CAS; (d) R. Boese, D. Bläser and A. Bäumen, Acta Crystallogr., Sect. C, 1999, 55, IUC9900001.
- F. J. Streiter and D. H. Templeton, Acta Crystallogr., 1962, 15, 1233 CrossRef.
- F. J. Streiter and D. H. Templeton, Acta Crystallogr., 1962, 15, 1240 CrossRef.
- R. F. Scheuerman and R. L. Sass, Acta Crystallogr., 1962, 15, 1244 CrossRef CAS.
- J. E. Davies and A. D. Bond, Acta Crystallogr., Sect. E, 2001, 57, o947 CrossRef.
- The same trend may be expressed either in terms of unit-cell volume, packing coefficients or calculated lattice-binding energies (see ESI). The densities and unit-cell volumes of the full data sets, although collected over a range of temperatures, alternate in an essentially identical manner, so that the subsequent discussion based on atomic coordinates derived from the full data sets is valid.
- The planar cell is more commonly described in the literature with labels ao and bo. The use of bo and co in this case is consistent with the planar cell being a projection of the bc face of the monoclinic unit cell, as described in space group P21/c or C2/c.
- The metrically monoclinic cell described by ao, b, c and θ1 is a true unit cell for each structure in space group P1. It does not take proper account of the crystal symmetry.
- R.m.s deviations were derived using the OFIT function of XP within SHELXTL ( G. M. Sheldrick, SHELXTL, Version 6.12, Bruker AXS, Madison, WI, USA, 2001). Search PubMedIt is of note that the relative arrangement of carboxyl groups is also essentially identical in the α,ω-alkanedicarboxylic acids, C5 and higher (see ref. 12). The r.m.s. deviations (Å) for the diacids compared with hexanoic acid are 0.41, 0.10, 0.31, 0.06, 0.33 and 0.08 for diacids C5–C10, respectively. In the case of the odd diacids, the fit refers to the β polymorph; the α polymorph of the odd diacids displays a different arrangement.
- G. R. Desiraju and T. Steiner, The Weak Hydrogen Bond in Structural Chemistry and Biology (IUCr Monographs on Crystallography 9), Oxford University Press, New York, 1999, p. 122ff Search PubMed.
- The same effect is seen in the α,ω-alkanedicarboxylic acids.
- In the previous literature describing the structures of the n-alkyl carboxylic acids (most notably Kitaigorodskii’s description in ref. 18), the direction of the offset is described as opposite in the odd and even acids. This is somewhat misleading. The direction of the offset is identical in each case. The different arrangements at the methyl group interface arise simply from having odd or even numbers of carbon atoms in the n-alkyl chains.
- The geometry of the CH3⋯CH3 contacts resembles that of C–X⋯X–C contacts (X
![[thin space (1/6-em)]](https://www.rsc.org/images/entities/char_2009.gif) =
=![[thin space (1/6-em)]](https://www.rsc.org/images/entities/char_2009.gif) halogen) commonly observed in crystal structures: V. R. Pedireddi, D. S. Reddy, B. S. Goud, D. C. Craig, A. D. Rae and G. R. Desiraju, J. Chem. Soc., Perkin Trans 2, 1994, 2353 Search PubMed . The contacts between terminal C–C bond vectors that are parallel resemble type I contacts, while those between terminal C–C bond vectors that are close to perpendicular resemble type II contacts.
halogen) commonly observed in crystal structures: V. R. Pedireddi, D. S. Reddy, B. S. Goud, D. C. Craig, A. D. Rae and G. R. Desiraju, J. Chem. Soc., Perkin Trans 2, 1994, 2353 Search PubMed . The contacts between terminal C–C bond vectors that are parallel resemble type I contacts, while those between terminal C–C bond vectors that are close to perpendicular resemble type II contacts. - The herringbone arrangement is comparable to that observed in monolayers of the even alkanes adsorbed on a graphite surface: T. Arnold, R. K. Thomas, M. A. Castro, S. M. Clarke, L. Messe and A. Inaba, Phys. Chem. Chem. Phys., 2002, 4, 345 Search PubMed . In similar monolayers of the odd alkanes the n-alkyl chains are parallel but maintain a side-on arrangement of methyl groups: T. Arnold, C. C. Dong, R. K. Thomas, M. A. Castro, A. Perdigon, S. M. Clarke and A. Inaba, Phys. Chem. Chem. Phys., 2002, 4, 3430 RSC.
- A. D. Bond and J. E. Davies, Acta Crystallogr., Sect. E, 2002, 58, 196 CrossRef.
- The inequivalence of contacts (i) and (ii) is in fact the origin of the different space group symmetry for C13 and C15 compared with the other structures, since it causes the 21 screw axis parallel to b at the bilayer interface to be lost. In addition, the inequivalence of contacts (i) and (ii) leads to the doubling of ao in the C″ structures: the pattern of short and long contacts is inverted at the two ends of a given bilayer and repeats itself by translation only every other bilayer along ao.
- The fourth closest C⋯C contact across the bilayer interface in C7 is 4.840(8) Å, significantly shorter than in any of the other structures.
- This is the first application of the parallelogram-trapezoid model to molecules with different end groups. It is not strictly necessary to employ “double” parallelograms and trapezoids as the most basic units—the model may still be employed using single parallelograms and trapezoids if it is also noted that the two ends of each shape will have different packing requirements, that is the carboxyl groups will always form centrosymmetric dimers and the methyl groups would be expected to form “optimal staggered” contacts. The use of the doubled entities not only simplifies the discussion, but is also based on sensible “supramolecular” principles: the hydrogen-bond motif formed by the carboxyl groups within each dimer contributes sufficiently to the overall lattice binding energy that it is not disrupted in any of the structures.
- This difference was noted previously by von Sydow within ref. 17.
Footnotes |
| † Electronic supplementary information (ESI) available: crystallographic data for C6–C15 in tabular and .cif format, full details of temperature calibration and density measurement, packing coefficients and lattice binding energies, formal definitions of the orthogonal cells, details of all projections and measurements of all geometric parameters referred to in the text. See http://www.rsc.org/suppdata/nj/b3/b307208h/ |
| ‡ Present address: University of Southern Denmark, Department of Chemistry, Campusvej 55, 5230 Odense M, Denmark. E-mail: adb@chem.sdu.dk. |
| § CCDC reference numbers 197245–197253 and 198903. See http://www.rsc.org/suppdata/nj/b3/b307208h/ for crystallographic data in .cif or other electronic format. |
| This journal is © The Royal Society of Chemistry and the Centre National de la Recherche Scientifique 2004 |
