Integration of single cell injection, cell lysis, separation and detection of intracellular constituents on a microfluidic chip†
Jian
Gao
,
Xue-Feng
Yin
and
Zhao-Lun
Fang
*
Institute of Microanalytical Systems, Department of Chemistry, Zhejiang University, 310028 Hangzhou, China. E-mail: fangzl@mail.hz.zj.cn; Fax: 86 57187951895; Tel: 86 57188273572
First published on 29th October 2003
Abstract
A microfluidic system was developed for the analysis of single biological cells, with functional integration of cell sampling, single cell loading, docking, lysing, and capillary electrophoretic (CE) separation with laser induced fluorescence (LIF) detection in microfabricated channels of a single glass chip. Channels were 12 µm deep and 48 µm wide, with a simple crossed-channel design. The effective separation channel length was 35 mm. During sampling with a cell suspension (cell population 1.2 × 10⁵ cells per mL in physiological salt solution), differential hydrostatic pressure (created by adjusting liquid levels in the four reservoirs) was used to control cell flow exclusively through the channel crossing. Single cell loading into the separation channel was achieved by electrophoretic means by applying a set of potentials at the four reservoirs, counteracting the hydrostatic flow. A special docking (adhering) procedure for the loaded cell was applied before lysis by repeatedly connecting and disconnecting a set of low potentials, allowing precise positioning of the cell within the separation channel. Cell lysis was then effected within 40 ms under an applied CE separation voltage of 1.4 kV (280 V cm−1) within the working electrolyte (pH 9.2 borate buffer) without additional lysates. The docked lysing approach reduced dispersion of released intracellular constituents, and significantly improved the reproducibility of CE separations. Glutathione (GSH) was used as a model intracellular component in single human erythrocyte cells. NDA derivatized GSH was detected using LIF. A throughput of 15 samples h−1, a retention time precision of 2.4% RSD was obtained for 14 consecutively injected cells. The average cellular concentration of GSH in human erythrocytes was found to be 7.2 × 10⁻⁴ ± 3.3 × 10⁻⁴ M (63 ± 29 amol per cell). The average separation efficiency for GSH in lysed cells was 2.13 × 10⁶ ± 0.4 × 10⁶ plates per m, and was about a factor of 5 higher than those obtained with GSH standards using pinched injection.
Introduction
Blood testing is indispensable for clinical diagnosis and treatment. Owing to limitations in quantification, in regular blood testing, usually thousands of cells are sampled and homogenized to provide the required amount of analytes. Such practice precludes the possibility for the assessment of cellular constituents of individual cells, which can vary significantly from cell to cell. The averaged results often conceal important information vital for the diagnosis of certain diseases. Such defects are further enhanced owing to the fact that, at early stages of development of a disease, only a very small percentage of cells carry the information indicative of malfunction. Individual examination of the cellular components of a large number of cells no doubt will greatly increase the probability of discriminating infected cells from healthy ones and provide a sounder basis for clinical diagnosis.1–3 However, single cell analysis calls for multiple improvements in cell manipulation, lysis, and separation of cellular constituents, detection sensitivity and throughput. Although studies on chemical components in single cells were conducted as early as in mid-sixties of the last century,4 progress in this field had been rather slow owing to the above mentioned requirements. The advent of capillary electrophoresis (CE) as an efficient separation technique, suitable for the introduction of micro-volume samples, greatly accelerated the development of single cell analysis.5,6 However, the mode of operation, and often also the related equipment employed in CE procedures for single cell analysis are relatively sophisticated.7–9 More recently, Chen and Lillard reported a simplified instrumentation for high throughput analysis of single cells by CE.10 The system was characterized by a cell lysis junction between the introduction capillary and separation capillary, produced by coupling the two capillaries using a 5 mm PTFE tubing to create a 5 µm gap. Individual cells transported by electroosmotic flow (EOF) were lysed at the junction presumably owing to dramatic changes in flow conditions at the gap. The system was used to detect hemoglobin and carbonic anhydrase in human erythrocytes by laser induced native fluorescence.Recently the exploitation of microfluidic chip-based systems for biological cell studies is attracting broad interest. Such systems, more generally referred to as miniaturized total analysis systems (μTAS), had gone through rapid development in the past decade.11,12 The micrometer channel dimensions of microfluidic chips are ideally suited for the sample introduction, manipulation, reaction, separation and detection of single cells. Integration of such functions with chip-based CE could potentially result in highly efficient and simplified approach for the determination of intracellular components of single cells. However, hitherto most applications of microfluidic chips to biological cell studies were aimed at developing individual cellular operations such as cell culturing,13 sorting,14 handling,15,16 and lysis.17 This might be associated with difficulties in achieving effective and efficient coupling of on-line cytolysis with chip-based CE. Compared to conventional CE equipment, control and minimization of molecular diffusion during cytolysis is more challenging in microfluidic chips. Separation channels are significantly shorter, and even small diffusion of intracellular components during the kinetic process of cell lysis subsequently translates to significant losses in the separation efficiency on the CE column.
Most recently, Wheeler et al.18 developed a multilayered microfluidic device constructed from poly(dimethylsiloxane) (PDMS) using soft lithography for the analysis of single cells. The system featured the use of on-chip integrated pumps and valves for achieving rapid single cell isolation, and the incorporation of a highly miniaturized perfusion chamber for assaying cell viability. Intracellular Ca2+ flux was measured in the intact cell before and after perfusion of reagents.
In most previously reported works, the in-capillary cell lysis, including conventional CE and chip-based CE, has not been critically controlled. This refers to procedures involving both the use of lysing reagents or electrical fields during CE separation, and is the probable cause for variations in peak shape and retention time of individual cells.19 Such deficiencies are bound to affect the quantification of intracellular constituents to different extents, and impairs the very purpose for individually assessing the constituents in single cells. A better control and synergistic coupling of the various stages involved in the determination of intracellular components in single cells could possibly be achieved on microfluidic chips to improve the reproducibility of the whole procedure. However, to our best knowledge, hitherto no work has been reported on the integration of single cell injection, controlled cell lysis and CE separation of intracellular constituents of a lysed single cell on a microfluidic chip system, and this was the objective of the present work.
Glutathione (GSH), a major intracellular thiol-containing compound existing in animals,20 was used as a model cellular component for this study. GHS is a tripeptide that is involved in many physiological processes.21,22 Being easily oxidized, it is often involved in the protection of thiol-containing proteins from the oxidation of reactive free radicals. The determination of GSH in individual erythrocytes is of significance for studying the mechanism of various biological processes in the human body. Owing to the biological and clinical significance of GSH, various methods have been developed to determine its cellular concentration. Determination of GSH in single cells with LIF7,19,23 and amperometric detection,8 using conventional CE separations have been reported.
In this work, we demonstrate the continuous isolation, transport, manipulation, cytolysis, CE separation, and LIF detection of cellular GSH in lysed single erythrocytes on a microfluidic device. A new approach was developed involving hydrostatic transport of cells through a valveless channel network, with subsequent single cell isolation, docking and adherence of the cell on the channel wall prior to cytolysis. Diffusion of intracellular components was minimized by electrical lysing of the docked cell, followed by CE separation and LIF detection of NDA labeled intracellular GSH in human erythrocytes.
Experimental
Instrumentation
A home-built confocal microscope LIF system equipped with an ocular was used for observation and manipulation of cells as well as for detection. A 488 nm argon ion laser (Model 367, 4 mW, Nanjing Electronic Equipment Corp., Nanjing,) was coupled to an inverted microscope (Jiangnan Optics & Electronics Co., Nanjing), with the necessary optical components. The laser beam was reflected and focused to a 20 µm point on the separation channel from below the chip. The emitted light was collected by the same focusing system, and directed to a pinhole by the optics of the inverted microscope. A 520 nm cutoff filter was positioned directly before the window of a CR114 type PMT (Hamamatsu, Beijing) connected to a model GD-1 HV power supply and amplifier (Reike Electronic Equipment Co. Ltd., Xi'an). Signal output from the detector was recorded using a model XWTD-164 chart recorder (Dahua Instruments, Shanghai). For direct viewing and recording of the sampling process, the ocular mounting was substituted with a charge-coupled device (CCD, DM/T-520, Dedicated Micros, Manchester), and the viewing field was illuminated using a tungsten filament lamp. A homebuilt multi-terminal high voltage power supply, variable in the range of 0–1500 V, was used for cell manipulation and CE separation.Fabrication of the microfluidic chip device
A microchip was fabricated on soda-lime glass using a photolithographic and wet chemical etching procedure described elsewhere.24 The channel design of the microchip device used for this work is shown in Fig. 1. The channels were etched to a depth of 12 µm and a width of 48 µm. Access holes were drilled into the etched plate with a 1.2 mm diameter diamond-tipped drill bit at the terminals of the channels. After permanent bonding by a thermal bonding procedure detailed elsewhere,24 four 4 mm inner diameter and 6 mm tall micropipet tips were epoxyed on the chip surrounding the holes, serving as reservoirs. The channel between reservoir S and SW was used for sampling and channel between B and BW was used for cytolysis and separation.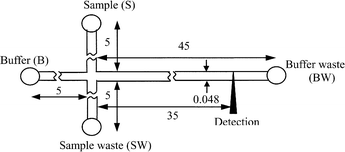 | ||
| Fig. 1 Schematic diagram of the channel design of the microfluidic chip. Dimensions are given in mm. | ||
Reagents and chemicals
All chemicals used were of analytical reagent grade, and demineralized water was used throughout. L-glutathione (GSH, reduced form) was obtained from Sigma Chemicals (St. Louis, MO), and 2,3-naphthalenedicarboxaldehyde (NDA) from Aldrich Chemicals (St. Louis, MO). 2 mg NDA were dissolved in 1 mL acetonitrile for derivatizing GSH in standard solutions and in blood cells. 20 mmol borate buffer (pH 9.2) was used as the medium for cell lysis as well as working electrolyte for CE separation. Physiological salt solution (PSS, NaCl, 0.9 wt%, pH 7.4) was used as for washing and preserving the red blood cells. GSH standard solutions were prepared freshly before use from its powdered form to avoid oxidation.Sample treatment
Human blood from a healthy adult was obtained from Zhejiang Provincial Blood Center (Hangzhou). 25 µL blood samples were centrifuged at 1000 rpm for 5 min to separate the erythrocytes. The supernatant was discarded and the erythrocytes were washed with PSS 3–4 times by centrifuging until a clear supernatant was obtained. After discarding the supernatant, the erythrocytes were suspended in 1 mL PSS. 10 µL NDA acetonitrile solution (10.8 mM) was added to the suspension, and derivatized at room temperature for 10 min, according to a procedure described by Orwar et al.19 The cells were washed with PSS several times to remove the unreacted NDA and resuspended in PSS to obtain a cell population of 1.2 × 10⁵ cells mL−1.Procedures
50 µL, 50 µL and 20 µL working electrolyte solutions were added to the reservoirs (which had identical inner diameters of 4 mm), B, BW and SW respectively. Then 100 µL (1.2 × 10⁵ cells mL−1) of the cell suspension were added to the sample reservoir S, also with 4 mm id. Owing to the differences in liquid level in the reservoirs created by the different volumes, the cell suspension flowed from reservoir S to SW (Fig. 2A) under hydrostatic pressure. Individual cells could be observed under the microscope being transported in the direction indicated by the arrows. When a single cell moved within the crossed section of the channels, a set of electrical potentials was applied to the four reservoirs, with buffer reservoir (B) at +150 V, sample reservoir (S) and sample waste reservoir (SW) both at +70 V, and buffer waste reservoir (BW) grounded (Fig. 2B). The sampled cell was slowly transported towards the buffer waste reservoir (BW) by EOF, counteracting the hydrostatically induced flow. After 2 s, the set of potentials was switched on and off for 2–3 times with an interval of 1 s between each switching. Fast reiteration of the change of flow direction of the sampled cell subsequently effected settling of the cell within the channel with adherence to its walls (see cell in Fig. 2B). 15 s later, potentials were applied to B, S, and SW reservoirs for 1 s at +1400 V, +800 V, and +800 V respectively, while BW reservoir was grounded. The docked cell was lysed immediately on site in the working electrolyte under the electrical field (Fig. 2C). The time for lysis of the sampled cell was determined using a VirtualDub 1.4.9 software (Avery Lee). After cytolysis, the labeled intracellular components were released, separated by CE and detected by LIF. Before separation, the potentials were shortly interrupted, while the chip was shifted from the channel-crossing viewing position to the detection point, the laser beam was re-focused, and the potentials shown in Fig. 2C were resumed. Simultaneously the chart recording was initiated, and stopped at the end of the CE separation. | ||
| Fig. 2 CCD images showing a single erythrocyte being transported, docked (adhering) and lysed in the micro-channels. Arrows indicate the direction of liquid flow and the black bar shows the scale (50 µm). (A) Single cell loaded by hydrostatic pressure, the cell suspension contained about 1.2 × 10⁵ cells per mL. (B) A set of electrical potentials was used to inject a single cell from the sample channel into the separation channel and to stop the single cell and have it docked at an appropriate site on the channel walls. (C) The docked cell was lysed in the working electrolyte buffer solution under the applied electrical field in 40 ms, and ready for CE separation. | ||
Results and discussions
Injection and loading of single cells
In studies on biological cells using microfluidic devices, the cells are often being transported using applied electrical fields.15 Unfortunately, the high current and Joule heating that result from using high voltages with typical cell buffers, and the potential for accidental cell lysis in electric fields pose limitations for their use.18 In preliminary studies, we used electrical fields in the range from 100 to 800 V cm−1 to drive the cells. At electrical field strengths below 100 V cm−1, the cells could not be moved out of the sample reservoir, while at field strengths exceeding 600 V cm−1, the cells were lysed in the sampling channel despite an environment of isotonic buffer.Another approach was developed by Arai et al.25 for the sampling of single cells using a combination of laser-trapping and dielectrophoretic forces. Although high-speed separation of single cells were effected in 20 s, the method involved rather specialized and sophisticated optical equipment. Müller et al.26 developed a 3D microelectrode system for handling and caging single cells and particles using microfabricated traps, also employing dielectrophoretic force. However, no attempts were reported on further treatment of the isolated cells in either work.
The hydrodynamic approach appears to offer better assurance for the intactness of the cells during manipulation compared to electrokinetic means.16–17,27–29 Culbertson et al.16 and McClain et al.17 reported briefly on employing syringe pumps to bring cells to a cross intersection where a combination of chemical and electrical lysis was performed.
During the preparation of this manuscript, an elegant approach for single cell sampling, based on hydrodynamic flows generated by a miniaturized flow injection system,18 came to our notice. The operation of a standard sixport, two-way valve used in conventional flow injection experiments was mimicked by controlling a set of solenoid valves that exerted pressure through gas or liquid flows on microfabricated PDMS structures integrated on the chip.
To produce a simpler system, in this work, the hydrostatic pressure generated by the difference of liquid level was used to drive the cells. In order to manipulate individual cells within the channels, the liquid levels in the reservoirs and the population of cell suspension were optimized. The heights of the liquid in the reservoirs were adjusted so that HS > HB > = HBW >> HSW. Under such conditions, the directions of liquid flow in the channels are shown by the white arrows in Fig. 2A, and cells flowed from reservoir S to SW. Flows were also induced from B and BW reservoirs to SW reservoir, creating a pinched flow for the cell suspension at the channel crossing, and preventing the entrance of cells into the separation channel (see arrows in Fig. 2A). The cell population in suspension was optimized to facilitate single cell sampling with populations in the range 1.0 × 10⁵ ∼ 1.0 × 10⁶ cells mL−1. When the population exceeded 1.0 × 10⁶ cells mL−1, cell agglomeration occurred within the channels. At 1.0 × 10⁶ cells mL−1 multiple cells occupied the channel crossing at any given time resulting in multi-cell loading. A cell population about 1.0 × 10⁵ ∼ 1.5 × 10⁵ cells mL−1 was found to be appropriate for single cell sampling under the experimental conditions adopted, as shown in Fig. 2A. Excessively low population extended the intervals for single cell sampling and reduced the throughput. With the liquid levels of S, B, BW, and SW reservoirs adjusted to 6.0, 3.0, 3.0, 1.0 mm, individual cells with populations in the 1.0 × 10⁵∼1.5 × 10⁵ cells mL−1 range were separated with an average of 2 mm apart at 0.2 mm s−1 flow-rate. Under such conditions, only about 25 s were required for transporting a cell from the sample reservoir S to the channel crossing. The flow-rate could be easily varied by appropriate adjustment of liquid levels in the reservoirs; however, experience showed that trapping single cells is much more difficult at substantially higher flow-rates, while lower flow-rates retard the sampling process.
When a single erythrocyte (with average dimensions of about 2 µm thick and 8 µm diameter30) was sampled into the separation channel on applying an electrical field under conditions as described under Procedures, the EOF in the sampling channel was equal or greater than the Poiseuille flow. The net flow directions thus produced were towards the sample reservoir and sample waste reservoir, as indicated by the white arrows in Fig. 2B, and further cells were prevented from entering the separation channel. When observed under a microscope, the cells remained intact during the manipulation under the low field strength applied.
Optimization of conditions for cytolysis
SDS and digitonin have often been used as cell lysate agents in single cell analysis.8,10,15–17 However, additional lysates may interfere with online separation and detection and might be one of the main reasons that systems integrating cell lysis with online separation and detection are rather scarce. Thus Chen and Lillard reported the interfering effects of SDS lysing agent in the CE separation and detection of hemoglobin and carbonic anhydrase in erythrocytes, with SDS causing co-elution of the two analytes.10In this work we found that cells suspended in electrophoresis buffer with relatively high pH could be lysed rapidly under relatively high electric field strength without the introduction of special lysing agents. In preliminary studies, relatively high voltages (e.g. +1400 V) were used for cell loading, lysis and separation of cellular constituents; however, the retention time for NDA–GSH was irreproducible. Further studies under the microscope equipped with a CCD camera revealed that the sampled cells were not lysed immediately after entering the separation channel, but traveled 5–10 mm downstream (in 10–20 s) before the contours of the cellular membrane disappeared. This suggests that under such conditions the cell lysis process was poorly defined in space and time. One reason for such behavior might be that the single cell was suspended in the sample plug of PSS medium, and about 20 s was required for the working electrolyte buffer to diffuse into the sample plug and reach the cell. The higher potentials also produced larger flow velocities, e.g., 0.5 mm s−1 at 280 V cm−1, resulting in shortening of the effective separation length by 5–10 mm. A further and perhaps more important reason might be that GSH and other intracellular components were continuously released during cell lysis, while the partially disintegrated cytoplasm was being transported downstream through the separation channel by EOF. This assumption was validated by lysing the cell under static conditions. This was achieved by applying a set of lower potentials after the single cell was introduced into the separation channel. At this point, reiterating the switching on and off of HV potentials at short intervals, as described in the Experimental section, allowed the cell to stand still within 50 µm of the channel crossing, and the cell adhered on site to the channel walls (Fig. 2B). After standing 15 s to allow diffusion of buffer into the sample zone, a larger potential of 1400 V was applied for 1 s and then switched off at once. The cell remained in its docked position during this short period, and was immediately lysed. This lysing process was recorded using a CCD camera showing that it usually required less than 40 ms (Fig. 2C). Fig. 5 shows the critical stages of cell lysis of a sampled cell. Consecutive CCD images were taken at intervals of 5 ms, after application of the lysis/separation voltage. In this particular case cell lysis was completed in about 25 ms. A video clip showing the cell sampling, docking, and lysis process is also provided as supporting information.
The CE separations that followed demonstrated significantly improved reproducibility, with an RSD of 2.4% for the retention time of GSH for 14 consecutively analyzed single cells.
Our observations have shown that under the low flow-rates used in this study, cells traveled on, or close to the bottom of the micro-channel during transport, and docked immediately on the channel walls when they stopped flowing. However, further studies showed that the docking time of cells in the channel affected the strength of adherence on its walls. Several single cells were tested by docking them on channel walls for 5, 10, 15 and 20 s, respectively, before the lysing procedure. In case of an insufficient docking period, even though the cells were lysed and the intracellular components released on applying the lysing/separation voltage, dislodging of the docked cells could occur during lysis, leading to deterioration in reproducibility of results. A docking time of 15 s proved to be sufficient.
In this work, a study was further conducted to obtain additional evidence on the immediate complete destruction of the docked cell under the applied HV potentials. The cells were labeled overnight with fluorescein isothiocyanate (FITC) in PSS medium. Since FITC was known not being able to penetrate cellular membranes, it is not suitable for labeling of intracellular components. This property is exploited in this study for the exclusive labeling of components in the cellular membrane of the erythrocytes. The CE recordings of FITC-labeled cells following cell-lysis, shown in Fig. 6, using the same procedure, showed a number of peaks with reproducible migration times, albeit with varied ratios for individual cells. The peaks were assumed to be amino-group-containing phospholipids contained in the cell membrane,31 but no attempts were made to identify them in this study. The reproducibility of the peak retention times suggest an immediate and complete destruction of the cellular membrane.
Separation and determination of GSH in single erythrocytes
Our reason for considering GSH as a model intercellular constituent for evaluating the performance of the microfluidic single cell analysis system not only lies in its biological and physiological significance, but more importantly, is the ease of derivatizing the component in the cell suspension under physiological conditions.19 NDA readily penetrates the cell membrane, producing with GSH a highly fluorescent species that is conveniently excited by an argon ion laser at 488 nm. Orwar et al.19 found that, in contrast to previous accounts on the labeling of primary amines by NDA, no cyanide ion or additional nucleoplile is required for derivatization, which achieves equilibrium in 90 s at pH 7.4 in a HEPES buffer, and that the fluorescence of the derivative showed no difference at pH values of 7.4 and 9.1. Such kinetic properties and reaction conditions were quite ideal for our purpose.A secondary but also important objective of this work was to determine the GSH concentration in individual cells. This required special considerations for calibration, including the following measures taken. Firstly, in order to maintain similar conditions for the derivatizing of the GSH calibration standard, the standards were prepared in PSS at pH 7.4. Secondly, an electrokinetic pinched-injection mode operated at a channel-cross was used to inject the derivatized standards after reacting for 10 min. This injection mode usually provides superior reproducibility, and a well-defined sample zone before and after injection.32 And thirdly, the fluorescence of the derivative in the sample was detected by LIF following CE separation under the same conditions as for single cell analysis to facilitate comparison. The recorded electropherograms of a series of replicate standards of mM NDA–GSH are shown in Fig. 3. A regression equation of y = (0.85 × 10⁶)x (x is the concentration in mM, r2 = 0.994) was obtained for the calibration, with a dynamic range of 5 × 10⁻⁷∼2 × 10⁻⁵ M, and a detection limit of 0.25 µM (3.5 amol) (S/N = 3). Reproducibilities of 0.9% RSD (n = 10) for the retention time, and 2.2% RSD (n = 10) for peak area were obtained for a 65 µM NDA–GSH standard.
 | ||
| Fig. 3 Recorded electropherograms of a series of duplicate standards of NDA–GSH. (a)1.30 × 10⁻⁵ M; (b) 3.25 × 10⁻⁵ M; (c) 6.50 × 10⁻⁵ M. Potentials applied to B, S, and SW reservoirs during CE separation were +1400 V, +800 V and +800 V respectively, while BW reservoir was grounded. 20 mmol borate buffer (pH 9.2) was used as working electrolyte for CE separation. Negative spikes on the baseline correspond to the starting point of the CE separation. | ||
Typical electropherograms recorded during the consecutive injection of a series of single erythrocytes are shown in Fig. 4. Only a single peak was recorded for each injection, which agreed with the results obtained by Orwar et al.19 using conventional CE, and demonstrated the specificity of the derivatization. The average retention time of the peaks (76.0 s), with a reproducibility of 2.4% RSD for 14 injected cells, agreed well with that obtained using the NDA–GSH standard (75.2 s). No drift in retention time was observed within this period, such as those observed by Jin et al. in a conventional CE system with amperometric detection,8 and the precision was almost a factor of two better than that reported by Orwar et al.19 Such results imply an effective control of dispersion effects during cell lysis. This was achieved in the proposed procedure by firstly docking the sampled cell at a relatively precise position in the separation channel within an error of 50 µm, and then electrically lysing the docked cell within a short period of 40 ms. Dispersion of intracellular components during cell lysis and uncertainty in the spatial starting point of CE for the analyte were therefore largely avoided. This is evident from the significant improvement in separation efficiency in the analysis of GSH in lysed cells compared to GSH standards, as shown in Fig. 4. The average separation efficiency for the GSH peak (2.13 × 10⁶ ± 0.4 × 10⁶ plates m−1) from the lysed cells were about a factor of 5 higher than those obtained with standards using pinched injection (4.14 × 10⁵ plates m−1). The higher separation efficiency of the lysed cells no doubt is a consequence related to the small volume of the cell. The volume of an injected standard sample under the pinched conditions used in this work was estimated to be 14 pL, as evidenced from CCD images, while the volume of a single erythrocyte is only about 0.1 pL. Apparently, intracellular constituents have dispersed into a somewhat larger volume during cell lysis immediately before the separation, but still significantly smaller than an injected liquid sample. It is therefore reasonable to use peak area for calibration in estimating the mass of GSH released for each single cell. This data was then used to determine the cellular concentration of GSH for each individual erythrocyte, assuming the cell volume to be 87 fL.30 A comparison of the results obtained in this work is made with those reported by other workers using conventional CE for determination of GSH in single erythrocytes, as shown in Table 1.
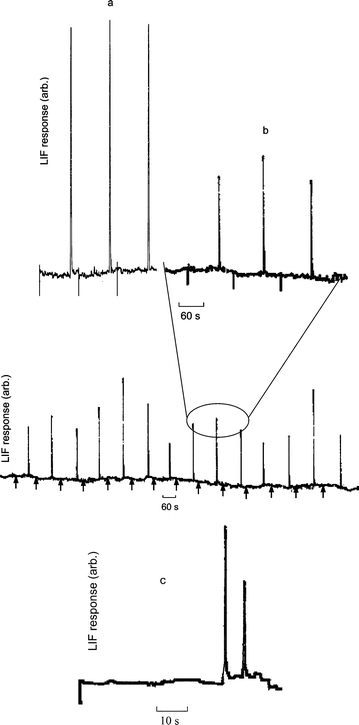 | ||
| Fig. 4 Electropherograms obtained using the microfluidic chip with LIF detection. (a) 6.5 × 10⁻⁵ M GSH–NDA standard. (b) GSH–NDA in single lysed human erythrocytes. Lower panel, continuously recorded electropherograms of a series of 14 cells injected consecutively. (c) electropherogram of GSH from the simultaneous lysis of two consecutively introduced cells labeled with NDA. Conditions as in Fig. 3. Negative spikes or arrows on the baselines correspond to the starting point of the CE separations. | ||
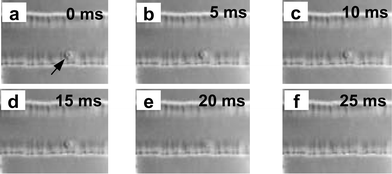 | ||
| Fig. 5 CCD images showing the critical stages of cell lysis. Separate images were taken at intervals of 5 ms. Arrow indicates the single cell, (a) corresponds to the starting point of the lysis, (f) corresponds to the complete cell-lysis. | ||
 | ||
| Fig. 6 CE recordings of FITC-labeled cells following cell-lysis. | ||
In this work, the same confocal microscope was used to observe the cell during introduction and for LIF detection downstream. The operation was therefore interrupted for about 2 min during each analytical cycle for chip shifting and refocusing, this time was not reflected in the electropherograms shown in Fig. 4. Even with this delay, a throughput of 15 cells h−1 was readily achieved.
In order to further enhance the throughput, an attempt was made in this work to dock multiple cells in a string, closely positioned to each other in the lysis/separation channel, prior to simultaneous cell lysing and CE separation. The feasibility of this approach is shown in the recording in Fig. 4c, where two cells were docked consecutively, and lysed under the same applied HV. However, the operation was found to be considerably less reliable, with frequent failures encountered, and the attempt was suspended.
Conclusions
We have demonstrated the feasibility of integrating the whole process for single cell analysis on a microfluidic chip including single cell injection, lysis, separation and detection of cellular constituents by CE, employing the docked-cell-electrolysing approach. Although other choices for cell-docking, such as trapping in channel recesses, by dielectrophoretic approaches, or employing adherents on channel walls, might be used, our experiences showed that “switching the HV on and off” is a most effective, robust and convenient approach for cell docking. The manual operations used in this work could be easily improved by computer programming. As demonstrated by the determination of GSH in human erythrocytes, the proposed microfluidic system provides an effective and efficient platform for qualitative and quantitative analysis of intracellular constituents in a single cell, which might be of significance in biological and medical research. This work also demonstrates that well-controlled docking and lysing of single cells before CE separation is a vital factor for ensuring reproducibility and separation efficiency. The high separation efficiency achieved with single cells in this work shows favorable potential for the analysis of multi-intracellular components in the single cell. The challenge lies in the development of suitable fluorimetric labeling reagents, which could penetrate the cell membrane under physiological conditions and form derivatives with multi-components of biological interest. This work also showed that good performance in single cell analysis need not always be related to complicated microstructures, since the performance achieved in this work was achieved using a microfluidic chip of the simplest design.Acknowledgements
This work was supported by Natural Science Foundations of China under project No. 20299030. The Authors are grateful to Professor Wen-Rui Jin of Shandong University for inspiring discussions.References
- J. L. Zabzdyr and S. J. Lillard, Trends Anal. Chem., 2001, 20, 467 CrossRef CAS.
- E. S. Yeung, J. Chromatogr., A, 1999, 830, 243 CrossRef CAS.
- S. N. Krylov, E. Arriaga, Z. Zhang, N. W. C. Chan, M. M. Palcic and N. J. Dovichi, J. Chromatogr., B, 2000, 741, 31 CrossRef CAS.
- G. T. Matioli and H. B. Niewisch, Science, 1965, 150, 1824 CAS.
- R. T. Kennedy and J. W. Jorgenson, Anal. Chem., 1989, 61, 436 CrossRef CAS.
- R. T. Kennedy, M. D. Oates, B. R. Cooper, B. Nickerson and J. W. Jorgenson, Science, 1989, 246, 57 CAS.
- B. L. Hogan and E. S. Yeung, Anal. Chem., 1992, 64, 2841 CrossRef CAS.
- W. R. Jin, W. Li and Q. Xu, Electrophoresis, 2000, 21, 774 CrossRef CAS.
- S. N. Krylov, D. A. Starke, E. A. Arriaga, Z. Zhang, N. W. C. Chan, M. M. Palcic and N. J. Dovichi, Anal. Chem., 2000, 72, 872 CrossRef CAS.
- S. Chen and S. J. Lillard, Anal. Chem., 2001, 73, 111 CrossRef CAS.
- A. Manz, N. Graber and H. M. Widmer, Sens. Actuators, 1990, B1, 244 Search PubMed.
- D. J. Graves, Trends Biotechnol., 1999, 17, 127 CrossRef CAS.
- I. Inoue, Y. Wakamoto, H. Moriguchi, K. Okano and K. Yasuda, Lab Chip, 2001, 1, 50 RSC.
- A. Wolff, I. R. Perch-Nielsen, U. D. Larsen, P. Friis, G. Goranovic, C. R. Poulsen, J. P. Kutter and P. Telleman, Lab Chip, 2003, 3, 22 RSC.
- P. C. H. Li and D. J. Harrison, Anal. Chem., 1997, 69, 1564 CrossRef CAS.
- C. T. Culbertson, J. P. Alarie, M. A. McClain, S. C. Jacobson and J. M. Ramesy, in Proceedings of Micro Total Analysis Systems 2001, ed. J. M. Ramsey and A. van den Berg, Kluwer Academic Publishers, Dordrecht, The Netherlands, 2001, pp. 285–286 Search PubMed.
- M. A. McClain, C. T. Culbertson, S. C. Jacobson and J. M. Ramsey, in Proceedings of Micro Total Analysis Systems 2001, ed. J. M. Ramsey and A. van den Berg, Kluwer Academic Publishers, Dordrecht, The Netherlands, 2001, pp. 301–302 Search PubMed.
- A. R. Wheeler, W. R. Throndset, R. J. Whelan, A. M. Leach, R. N. Zare, Y. H. Liao, K. Farrell, I. D. Manger and A. Daridon, Anal. Chem., 2003, 75, 3581 CrossRef CAS.
- O. Orwar, H. A. Fishman, N. E. Ziv, R. H. Scheller and R. N. Zare, Anal. Chem., 1995, 67, 4261 CrossRef.
- A. Meister, J. Biol. Chem., 1988, 263, 17205.
- M. Black, Annu. Rev. Med., 1984, 35, 577 CrossRef CAS.
- S. Curello, C. Ceconi and A. Cargnoni, Clin. Chem., 1987, 33, 1448 CAS.
- K. S. Wong and E. S. Yeung, Microchim. Acta, 1995, 120, 321 CAS.
- X. F. Yin, H. Shen and Z. L. Fang, Fenxi Huaxue (Chin. J. Anal. Chem.), 2003, 31, 116 Search PubMed.
- F. Arai, A. Ichikawa, M. Ogawa, T. Fukuda, K. Horio and K. Itoigawa, Electrophoresis, 2001, 22, 283 CrossRef CAS.
- T. Müller, G. Gradl, S. Howitz, S. Shirley, Th. Schnelle and G. Fuhr, Biosens. Bioelectron., 1999, 14, 247 CrossRef CAS.
- C. W. Yang, Li and J. Yang, Anal. Chem., 2002, 74, 3991 CrossRef CAS.
- J. Kruger, K. Singh, A. O'Neill, C. Jackson, A. Morrison and P. O'Brien, J. Micromech. Microeng., 2002, 12, 486 CrossRef.
- E. A. Schilling, A. E. Kamholz and P. Yager, Anal. Chem., 2002, 74, 1798 CrossRef CAS.
- R. S. Weinstein, in The Red Blood Cell, ed. D. M. Surgenor, Academic Press, New York, 1974, p. 232 Search PubMed.
- L. Zhang, S. N. Krylov, S. Hu and N. J. Dovichi, J. Chromatogr., A, 2000, 894, 129–134 CrossRef CAS.
- S. C. Jacobson, R. Hergenröder, L. B. Koutny, R. J. Warmack and M. Ramsey, Anal. Chem., 1994, 66, 1107 CrossRef CAS.
Footnote |
| † Electronic supplementary information (ESI) available: Video showing a single erythrocyte transported through the microchannel, docking (adhering) at a particular point and then being lysed. See http://www.rsc.org/suppdata/lc/b3/b310552k/ |
| This journal is © The Royal Society of Chemistry 2004 |