Droplet-based chemistry on a programmable micro-chip
Jon A.
Schwartz
*,
Jody V.
Vykoukal
and
Peter R. C.
Gascoyne
Department of Experimental Pathology, University of Texas M. D. Anderson Cancer Center, Box 089, 1515 Holcombe Boulevard, Houston, Texas, USA. E-mail: schwartz@mdanderson.org; Fax: 713 792 5940; Tel: 713 792 7605
First published on 11th November 2003
Abstract
We describe the manipulation of aqueous droplets in an immiscible, low-permittivity suspending medium. Such droplets may serve as carriers for not only air- and water-borne samples, contaminants, chemical reagents, viral and gene products, and cells, but also the reagents to process and characterise these samples. We present proofs-of-concept for droplet manipulation through dielectrophoresis by: (1) moving droplets on a two-dimensional array of electrodes, (2) achieving dielectrically-activated droplet injection, (3) fusing and reacting droplets, and (4) conducting a basic biological assay through a combination of these steps. A long-term goal of this research is to provide a platform fluidic processor technology that can form the core of versatile, automated, micro-scale devices to perform chemical and biological assays at or near the point of care, which will increase the availability of modern medicine to people who do not have ready access to modern medical institutions, and decrease the cost and delays associated with that lack of access.
Introduction
Micro-total analysis systems (μ-TAS) have been brought closer to operational realisation as several technologies have advanced the ability to manipulate sub-micro litre aliquots of biochemical material.1–3 Electro-osmotic and electrophoretic forces that can move cells and conductive solvents along glass- and semiconductor-etched capillaries have advanced continuous-flow technologies such as capillary electrophoresis4,5 where DC electric fields, selectively applied along branched channels, can yield valve-less routing of cell suspensions and reagents. Progressively sophisticated designs for such devices have been developed, now encompassing three-dimensional channel structures capable of routing and combining suspensions of biological interest in a multitude of ways.6,7 In continuous-flow systems channels are used to direct reagent and analyte flow, and to limit lateral diffusion of analytes. Although increasing structural complexity permits a corresponding increase in sophistication of processes, tubes and channels inherently represent a “hard-wired” architecture that can exercise only the specific class or sequence of reactions that their physical structures are designed to realise. Drawbacks to continuous-flow μ-TAS systems have been pointed out previously,8 and include: (1) the possibility of unintended electrochemistry from exposed electrodes interfering with desired processes, (2) the need for micro-pumps or valves, which currently are mechanically complex and have low mean times between failure, (3) dead volumes that can be made small, but not negligible, by making channel dimensions small, and (4) continuity which limits flow control and mandates that flow from one branched channel affects all other channels, unless micro-valves are employed.A recent approach to making μTAS devices that overcomes these continuous flow limitations and allows for the possibility of programmable operation is the use of reaction surfaces whereby samples and reagents in the form of droplets may be combined in different manners according to an arbitrary algorithm. Such an approach demands not only a suitable reaction surface on which droplet chemistry is performed, but also a motive force for the injection and manipulation of the droplets.9 Electric field-based forces are ideally suited to such droplet manipulations on the microscale. These forces fall into three distinct classes, namely electrophoretic, electrowetting and dielectrophoretic. The first of these depends on the application of large DC fields that are problematical in systems involving conductive suspensions. However, the latter two forces depend on the square of the field strength, allowing AC fields to be used.10 Fair and Kim have successfully explored the use of electrowetting as the means for creating droplet processors.11–13 However, translational electrowetting forces depend sensitively on the difference in wetting between the leading and trailing edge of droplets and it is likely that surface contamination issues may arise in many real world biological analysis problems under these conditions. Additionally, the range of sizes of droplets that can be conveniently injected by this approach is limited by the need to confine the droplets between the top and bottom walls of the manipulation chamber. By careful design of electric field geometries and the use of non-wetting surfaces, dielectrophoretic forces, which act as body forces on the droplet rather than surface forces, can be made to dominate. Batchelder first proposed this method as the basis of a droplet processor, and he and others have demonstrated droplet movement based on dielectrophoresis.14–16 Here we present a more complete droplet processor based on dielectrophoresis in which we solve not only the problem of droplet translation on a two-dimensional non-wetting reaction surface, but also the problem of the injection of droplets over a range of scales that allows for the control of reagent titrations.
Dielectric forces do not depend on the movement of charge, but on the polarisability of particles (cells, droplets) relative to their surroundings.17–25 By exploiting these properties we have used dielectrophoresis (DEP) to manipulate collections of cells whose interiors may be made dielectrically distinct from a low-conductivity suspending medium.26–31 This also permits the manipulation of any type of liquid droplet within a dielectrically distinct immiscible carrier medium enabling the discreteness of droplet-based microchemistry. Secondly, dielectric forces are generated by spatially inhomogeneous electric fields. Hence, DEP requires no mechanical actuation. Thirdly, packaging analytes and reagents into discrete droplets, which also permit accurate quantification of reagents, can obviate dead volumes and continuity issues. This has advantages in that liquid droplets not amenable to triboelectrification32 may be manipulated, and that since electric fields need not penetrate droplets there need be no energy deposition into or temperature rise within the droplets. Finally, packaging reagents and analytes in discrete droplets remove the need for channels in order to transport materials of interest. Droplets may be manipulated arbitrarily and combined on a two-dimensional “reaction surface”. In this paper, we use dielectrophoresis to exert translational forces on uncharged aqueous droplets as a way to manipulate reagent- and analyte-bearing droplets along arbitrary pathways on a two-dimensional reaction surface as well as a way to introduce droplets onto the reaction surface using a no-moving-parts dielectrophoretic injection mechanism. This, in turn, leads to a programmable, and software-reconfigurable μ-TAS. We will describe the principles behind these new methods and illustrate them by demonstrating a simple example of droplet-based microchemistry.
Methods
PFP fabrication: We formed programmable fluidic processor (PFP) reaction spaces by patterning a two-dimensional array of electrodes using standard photolithographic techniques on glass substrates, electrically passivating the electrodes, forming an open fluidic reservoir, adhering a hydrophobic coating, and connecting the resulting device to a computer-controlled switching circuit.Conventional negative-mask photolithography was employed to fabricate electrodes from glass substrates on which a titanium adhesion layer (25 nm) and gold conduction layer (250 nm) had been vacuum deposited. Initial arrays consisted of eight-by-eight square electrodes, 30, 100, and 300 µm on a side with each electrode individually connected to a solder pad along two opposite edges of the substrate. A thin (∼0.5 µm) passivation layer, either vacuum-deposited Parylene, or spin-coated amorphous Teflon AF® was applied to the patterned electrode surface to prevent current flow across, and electro-chemistry on, the reaction surface. Although, PFPs will be fully sealed for clinical use, we used an open-face arrangement for laboratory experiments. A nitrile o-ring was secured to the substrate around the reaction surface's active region to form a reservoir for the suspending medium. Finally, since neither Parylene nor Teflon AF® were sufficiently hydrophobic, we applied a coating of Fluoro-Pel® (Cytonix Corporation, Beltsville, MD), to provide a non-conductive, optically transparent, and non-fluorescent surface. The finished electrode array is shown in Fig. 1. In operation, the reservoir was filled with 1-bromododecane, a low-permittivity (ε = 4.1), low-viscosity (η = 3.6 cSt), water-immiscible, hydrocarbon.
 | ||
| Fig. 1 Overview of an 8 × 8 substrate. Electrodes of the programmable fluidic processor (PFP) are controlled via gold leads individually connected to pads along the upper and lower edges of the substrate as shown. In order to access and view the reaction surface, experiments were carried out using an open chamber formed with an o-ring epoxied to the glass substrate. | ||
Individual electrodes on the reaction surface were energized with AC signals up to 180 Vp-p, and frequencies between 5 and 500 kHz33 generated by a programmable function generator (DS345, Stanford Research Systems, Sunnyvale, CA) and amplified by variable gain AC amplifiers (model 7500, Krohn-Hite Corp., Avon, MA). The AC signal was distributed to an array of solid-state switches (HV209, Supertex Inc., Sunnyvale, CA) operating under a microcontroller (BASIC stamp, Parallax Inc., Rocklin, CA) that executed a custom VisualBASIC® program from a laptop computer. Electrodes to be activated were manually selected by checking their graphical representations on the laptop screen. The sequence of activated electrodes was stored as a script, which the driver program would execute at a user-selectable rate.
The experimental apparatus illustrated in Fig. 2 was built around an upright microscope (Axioskop, Zeiss, Carl Zeiss, Inc., Thornwood, NY) mounting a motorized 3-axis platform controllable via either a joystick or computer interface (Ludl Electronic Products, Ltd., Hawthorne, NY). A chilled, 3-chip, colour CCD camera (Hamamatsu model C-5810) was mounted to the microscope and connected to a video frame counter (VC-81, For-A Company, Ltd.) used to label the recorded video sequences, and a videocassette recorder (AG-7350, Panasonic) used to record the experiments. The microscope was equipped with a trans-illuminating quartz-halogen lamp for most viewing applications and a xenon lamp for fluorescence studies. Two fluorescence filter sets (Chroma Technology Corp., Brattleboro, VT) were used: (1) Texas Red, excitation = 535–585 nm, emission = 605–680 nm for viewing experiments using Fluorescein; and (2) DAPI, excitation = 360 nm, emission = 440–490 nm for viewing experiments using o-phthalaldehyde.
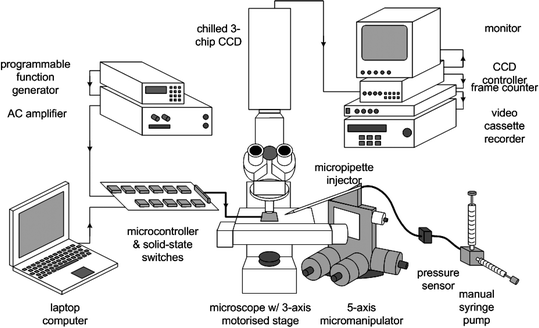 | ||
| Fig. 2 Experimental apparatus. The PFP was exercised on a motorised microscope stage. A programmable function generator and AC amplifier generated electrical signals controlled from the laptop computer and microcontroller board. A manual syringe pump delivered fluid to the PFP and controlled the hydrostatic pressure within the micropipette injector. Experiments were monitored by the CCD camera system and recorded on videotape for analysis. | ||
In addition to moving droplets from point-to-point, DEP was used to form droplets at pressurised orifices near electrodes. Hydrostatic pressure, and the interfacial tension between the aqueous/hydrocarbon surface34,35 act to “hold off” fluid flow from the orifice. This holdoff effect was utilised as a controllable check-valve to prevent spontaneous fluid flow. A DEP field applied near the orifice was used to form aqueous droplets within the less polarisable carrier fluid and inject them onto the reaction surface. A DEP force acting to overcome hydrostatic holdoff enables “no-moving-parts” valving, pumping, and metering of droplets that can then be manipulated. To this end, a fluid handling system consisting of a manual syringe pump, in-line pressure sensor, and micro-pipettes mounted to five-axis Huxley-Wahl micromanipulators (Sutter Instrument Co., Novato, CA) to position fluid injectors on the reaction surface.
Results
Controlled droplet motion
Aqueous droplets 20–500 µm in diameter were manoeuvred in two-dimensions across 8 × 8 two-dimensional electrode arrays using DEP forces. The movement of the droplets was controlled by switching a series of electrodes on and off in sequence. Energising an electrode adjacent to a droplet moved the local field energy minimum to that electrode, exerting a lateral force on the droplet in the direction of the new field minimum. The sequence was controlled from a custom, laptop computer-based graphical user interface. The high-permittivity droplet tended to move toward the adjacent electrode where the field lines converged and the E-field gradient was greatest due to the electrode geometry. Fig. 3 shows five frames from a videotape sequence in which a 0.18 nl and two 0.065 nl droplets are manoeuvred across an 8 × 8 array (30 µm electrodes) and sequentially combined with a 0.38 nl droplet. Fusion of individual droplets occurred spontaneously when they were brought into close proximity to each other. Fig. 3e shows the resulting 0.69 nl droplet, containing all of the original fluid volume, which has been manoeuvred to the edge of the array. A detailed discussion of droplet movement rate is beyond the scope of this paper, but is a function of the applied electric field, the diameter of the droplet relative to the electrode size, and the Stokes drag on the droplet. The droplets in Fig. 3 traversed the 60 µm inter-electrode distance in less than 1 video frame (1/30 s), yielding a speed of >1.8 mm s−1. | ||
| Fig. 3 Multiple droplet movement. Droplet motion and fusion on an 8 × 8 PFP with 30 µm electrodes. Frame (a) shows four droplets of 3 × H2O, three of which contain 0.065–0.18 nl each, have been manoeuvred into a line on the 2nd column of electrodes, and a 0.38 nl droplet that has been manoeuvred onto the 5th column. In frame (b) the middle droplet on the 2nd column has been manoeuvred toward the large droplet with which it has spontaneously fused. In frames (c) and (d) the upper and lower droplets have been fused, and in frame (e) the cumulative 0.69 nl droplet has been manoeuvred to the 8th column. | ||
Non-mechanical droplet metering
As demonstrated for the first time, in this study DEP was used to create a no-moving-parts mechanism for injecting discrete aliquots of fluid onto a reaction surface. Micropipette injectors, filled with de-gassed, triply-distilled water (3 × H2O), were immersed in the suspending fluid reservoir and manoeuvred adjacent to an electrode of the array. Injector height above the reaction surface was kept to 10–20 µm. The amplitude and frequency of the DEP voltage, VDEP and fDEP respectively, were controlled from the external DC power supply and function generator. The lateral distance from the injector orifice to the edge of the electrode, Z, was controlled by the Huxley-Wahl micromanipulator. A syringe pump was used to control the pressure, P, of the droplet fluid in the fluid handling system, which was monitored by a custom-built pressure sensor/amplifier. Each droplet injection sequence was videotaped, with each set of operational parameters referenced against a frame counter that recorded the experiment sequence number. Lateral distances and droplet diameters were determined from analysis of digitised videotape images for which the square electrodes provided an accurate metric.Droplet injection was initiated by energising the electrode nearest the injector, creating a DEP force on the fluid within the injector directed toward the edges of the energised electrode. Given an appropriate balance of applied VDEP, injector pressure and injector-electrode geometry, fluid would be drawn out of the injector, form a discrete droplet, then separate from the injector and move onto the energised electrode. A balance of forces produced by the applied DEP field drawing fluid from the injector at a given rate and the interfacial tension between the droplet and suspending fluids consistently yielded injected droplets of a uniform size. Fig. 4 shows an 18 µm diameter (3 pl) droplet in the process of being metered into an existing 42 µm diameter (39 pl) droplet which is situated on the energised electrode.
 | ||
| Fig. 4 Metering of small droplet into larger droplet. The image, captured from videotape, shows an 18 µm diameter (3 pl) droplet in the process of being metered into an existing 42 µm diameter (39 pl) droplet. The operational parameters for this experiment: VDEP = 120p–p, P/H = 0.72, fDEP = 150 kHz, d = 2.6 µm, Z = 28 µm, and e = 30 µm. | ||
Droplet fusion and chemical mixing
Fig. 5 shows two frames of videotape sequence that illustrates the spontaneous fusion of two droplets with passive diffusion and mixing of their contents. Frame (a) shows the two aqueous droplets suspended in liquid hydrocarbon situated on an array composed of individually addressable electrodes 30 µm on a side separated by 30 µm open spaces. The droplets were fused by activating intervening electrodes in order to bring them into close proximity where the droplets fused spontaneously as a result of the lower energy/higher entropy configuration afforded by a single large droplet (cf. frame (b)). The spontaneous fusing of discrete droplets lead not only to content mixing in strict stoichiometry of the fusing droplets, but in rapid diffusion of droplet contents as a result of the inward momentum generated by their fusion. From the video frame rate and transverse scale provided by the 30 µm electrodes it was deduced that the diffusion front moved across the fused droplet in Fig. 5 at ∼170 µm s−1. | ||
| Fig. 5 Spontaneous droplet fusion with rapid mixing of contents. Frame (a) shows two aqueous droplets suspended in liquid hydrocarbon on a 2 × 8 PFP. Illumination is via a mercury lamp; viewing is through a Texas Red fluorescence filter set. The 87 µm diameter, (0.34 nl), fluorescent droplet on the left contains 53 µM fluorescein in a 16 mM HCl solution. The 91 µm diameter, (0.39 nl), non-fluorescent transparent droplet on the right contains a 16 mM NaOH solution. Frame (b) shows the two droplets after fusion with the fluorescent/non-fluorescent diffusion front moving across the combined droplet. | ||
Droplet-based fluorescence assay
A fluorescence-based protein determination was performed to demonstrate a proof-of-concept for the use of the PFP to execute a droplet-based biochemical analysis. Fig. 6 is an enhanced image of a set of nine droplets distributed on an 8 × 8 electrode PFP. The droplets were formed using DEP injection to lay down droplets of o-phthalaldehyde (OPA) (Pierce, Rockford, Il) approximately 500 µm in diameter (65 nl) from a pipette manoeuvred into close proximity to the individually addressable electrodes. Varying amounts of a 0.5 mg ml−1 solution of bovine serum albumin (BSA) (Sigma Chemical Co., St. Louis, MO) (MW = 68 kD) were then metered into the OPA droplets from a second injector. Individual DEP-injected BSA droplets averaged ∼70 µm in diameter yielding repeatable aliquots of 0.18 nl. The resulting fused droplets contained protein concentrations that spanned three decades from 0.266–232 µg ml−1. One droplet, containing no added protein, served as a control for determining background fluorescence. Uniform illumination of the view field with a mercury source produced blue fluorescence by the protein-bound OPA which was observed through a DAPI filter set by a colour CCD camera with a controllable integration time. Digital images recorded with different integration times were compared to quantify the wide range of fluorescence observed. | ||
| Fig. 6 Enhanced image of a set of nine droplets distributed on an 8 × 8 PFP. The droplets contained a BSA concentration that increased geometrically from lower right to upper left. The droplet at the lower right contained no added protein and served as a control for determining the background fluorescence. Electrode features are visible as bright areas through the more fluorescent droplets. | ||
Discussion
Our work is based on understanding that a freely suspended dielectric object will move in such a way as to minimise applied electric field energy. For our purposes here it is sufficient to note that an uncharged, polarisable object in a spatially inhomogeneous electric field is attracted to a region of high electric field gradient (∇E) if its polarisability is greater than that of its surroundings.36,37The real part of the time-averaged DEP force 〈F(t)〉 acting on a particle due to an imposed electrical field, E(ω), can be approximated in terms of dipole effects by38
 | (1) |
 | (2) |
Expansion of the complex Claussius-Mossotti factor reveals that the force applied to a droplet changes only slightly over large ranges of electrical conductivity from 55.6 nS cm−1 (triply-distilled water) to 13.4 mS cm−1 (isotonic cell culture medium) for AC field frequencies in the range 5–500 kHz. Droplet transport and injection were modelled for a wide range of fluid properties using software developed specifically for this purpose by Coventor, Inc.39 Such modelling is able to cover the complete range of electrostatically-induced droplet force phenomena from dielectrophoresis to electrowetting. Since DEP does not depend on current flux, and indeed, since even a few microamperes across a micro-droplet results in hydrolysis, the surface electrodes must be passivated with a hydrophobic insulating layer such as Parylene, Teflon, or a fluorosilane. As a practical matter, many insulators tend to be polar, and thus wetting to aqueous solutions. Hence, a coating that renders the final surface hydrophobic is required.
Non-mechanical micro-fluidic pumping
Introduction of a dielectric material into a different dielectric medium alters the energy of the overall system. An applied electric field gradient imposed on the orifice of the injector will tend to alter the pressure at the fluid-suspending medium interface, and this pressure change will in turn alter the volume of a nascent droplet. That is, a change in the electrical energy of the system can be translated into a hydrostatic pressure change within the droplet forming system. Consequently, a force results from the dielectric energy change associated with the displacement of the suspending medium by the injected fluid. It should be stressed that this pressure change does not depend upon net charge on the droplet, which distinguishes this dielectric method from those that depend upon net electrostatic charging as a means for injection of droplets or for forming particulates or aerosols. Indeed, when AC fields are used for dielectric injection, the presence of net charge does not alter the pressure induced by the applied AC fields because the time-averaged magnitude of an AC field is zero. Thus, fluids spanning a wide range of electrical conductivities may be accommodated by a dielectrically actuated system.There are a great many factors that influence the droplet injection process, and a complete theoretical treatment is beyond the scope of this study. Several general observations, however, will give a sense of what is involved. The sensitivity of the injection process to the electric field gradient ∇E is manifested by control of the distance, Z, between the injector orifice and the energised electrode edge, and the lateral extent, e, of the energised electrode. The injector orifice diameter, d, in the context of a given interfacial tension between the injected fluid and the suspending medium influences the size of injected droplets by governing the point at which it is energetically favourable for a droplet to “pinch-off” from the injector and move through the suspending medium to an energised electrode. The hydrostatic pressure, P, applied to the fluid in the injector, acting against the interfacial tension at the injector orifice, or holdoff force, H, influences how much the DEP force is required to pull fluid out of the injector.
Our experiments demonstrated that injecting controllable aliquots of aqueous droplets into an immiscible dielectric medium is a function of: (1) injector orifice diameter, (2) square of the DEP voltage, V2DEP, (3) fluid system applied pressure: holdoff pressure ratio, P/H, (4) injector orifice-to-electrode edge distance, Z, and (5) electrode lateral edge length, e. Experiments also showed the relative independence of droplet diameter on pressure, but the linear dependence of droplet injection rate on P/H, that the injected droplet diameter diminishes with increasing VDEP, and that at higher voltages the injected droplet diameter is independent of injector/electrode separation. Control of pressure in the fluid handling system and of electric fields on the array permits the injection of droplets of uniform size onto the reaction surface. Larger droplets can be produced in discrete fashion by leaving the field on while metering out a series of droplets to build up a desired aggregate droplet. In Fig. 7 these factors are combined to summarise the interdependence of injector, electrode geometry, and pressure effects. Along the ordinate the diameter of the injected droplet is normalised by the sum of the injector-to-electrode distance and the electrode lateral edge length. Along the abscissa the square of the DEP field (from the applied voltage acting across a fixed distance) is scaled by the injector-to-electrode distance and normalised by the hydrostatic pressure expressed as a ratio to the static holdoff pressure. Droplets with diameters dia/(Z + e)>1 are drawn and spontaneously injected; droplets with diameters dia/(Z + e)<1 (below the red dashed line) are DEP-injected and ejected onto the reaction surface. Injection from larger 3.7 µm injectors (squares) is possible only at relatively high VDEP. Injection of small droplets is greatly facilitated by having the interior of the injector made hydrophobic by application of a fluorosilane, e.g., Sigmacote® or FluoroPel®. And, injected droplets' diameters scale with the electrode dimensions, implying that the electrode size determines the field gradient relative to the injector.
 | ||
| Fig. 7 Combined droplet injection data normalised by injector–electrode distance and electrode size. The droplet diameters have been normalised by the sum of Z and e. The square of the applied DEP voltage is scaled by Z and normalised by the hydrostatic pressure as a ratio to the holdoff pressure. In the figure legend, d refers to the injector orifice diameter in µm, e to the electrode edge length in µm, and n to the number of samples in each data set. | ||
Fusion
Droplet-based chemistry permits reagents to be quantised in discrete packets and mixed in strictly stoichiometric ratios. Additionally, droplets provide a way of obviating difficulties in mixing chemicals in channel-based systems where inherently low-Reynolds-number diffusional mixing of mutually miscible fluids slows to the point where special mixing chambers are frequently required.40Spontaneous fusion of droplets leads to the rapid mixing of the original droplets' contents via passive diffusion. This is because the immiscibility between aqueous and hydrocarbon fluids is related to the entropy associated with the polar water molecules' ability to form a minimum energy lattice structure. Non-polar liquids interrupt the aqueous lattice resulting in a difference in free energy at the water–hydrocarbon interface. A collection of small aqueous droplets will have fewer degrees of freedom to form a minimum-energy lattice than will a single large droplet, and hence, will possess lower entropy. Therefore, large droplets are thermodynamically favoured, and small droplets will spontaneously fuse into large droplets if brought into close proximity.
To illustrate, consider the increase in system energy resulting from the introduction of an immiscible droplet into a homogenous medium. From hydrostatics the pressure, P, across the surface of a droplet is a function of the interfacial tension, γ, and the droplet radius, r, or, equivalently, the energy per unit volume:
 | (3) |
 | (4) |
 | (5) |
 | (6) |
Fig. 8 graphs the change in system energy, ∂E, with respect to the change, ∂, in the final droplet radius. For example, when two droplets of the same radius fuse, the resulting droplet will have a radius 26% greater than the initial droplets, and system energy 21% less than the two-droplet state. For this reason droplets will spontaneously fuse on contact with the release of energy that may take the form of kinetic energy that tends to mix their contents. Note from eqn. (6) that this effect is a function of the droplet radii only, and does not take into account energy changes resulting from chemical reactions resulting from droplet content mixing. Since DEP forces scale with droplet volume (cf.eqn. (1)) it requires no more drive voltage to move large droplets than small ones. In addition, since the radius of a droplet increases with the cube root of its volume, a wide range of stoichiometries can be realised in parallel in droplets of similar size, as we have done in the OPA/BSA assay.
 | ||
| Fig. 8 Change in energy vs. radius as a result of droplet fusion: The fractional change in energy, ∂E, of a two-droplet system as a result of the fusion of the droplets is graphed against the change in radius, ∂r, of the larger of the initial droplets. At ∂r = 1 there is no second droplet to fuse, and hence, no change in energy. Fusion of the droplets shown in Fig. 4 results in ∂r = 1.23 and ∂E = 0.83 (dashed line). | ||
Droplet biochemistry
The no-moving-parts formation and manipulation of droplets on a two-dimensional reaction surface provides the physical basis for a programmable fluidic processor that can execute useful biochemical analyses autonomously. The protein concentration assay shown in Fig. 6 provides an illustration of one such analysis. Fig. 9 graphs the protein concentration vs. fluorescence intensity of the eight droplets from Fig. 6 (squares) plus seven additional droplets from a separate experiment (circles). A best-fit linear curve is superimposed over the data points, which are graphed on a log–log scale. For droplets that contained sufficient added protein to permit a measurable change in the overall droplet diameter, and hence, change in droplet volume, the diameter difference was measured, and then used to derive a volume change. For droplets that contained insufficient protein for the initial and final droplet diameters to be distinguishable, the added volume was derived from the number and diameter of protein droplets metered into the large droplets as recorded on videotape. Since the droplets could freely expand as fluid was added, the resulting fluorescence was distributed throughout a proportionally larger volume and observed cross-sectional area. Fluorescence values were determined by measuring the mean fluorescence of each droplet as observed by the video camera, subtracting a background value equivalent to the fluorescence from the control droplet, and multiplying this corrected mean fluorescence by the observed droplet cross-sectional area to obtain an integral fluorescence value for each droplet. In this simple assay the minimum observed fluorescence corresponded to a protein concentration of 0.266 µg ml−1, (3.9 nM) and the assay yielded a linear response (R = 0.99) to a protein concentration that spanned three decades from 0.266–232 µg ml−1. | ||
| Fig. 9 Protein concentration vs. fluorescence intensity: The figure graphs the relationship between the BSA concentration and the integrated fluorescence intensity for the eight droplets shown in Fig. 6 (squares) plus seven additional droplets from a previous experiment (circles). A best-fit linear curve is superimposed over the data points graphed on a log–log scale. The minimum observed fluorescence corresponded to a protein concentration of 0.266 µg ml−1, (3.9 nM). From the curve fit it is seen that the OPA assay is linear over at least three decades of protein concentration. | ||
This illustrates another consequence of doing droplet chemistry on a μ-array in that the quantity of reagents and analytes used are small; the experiment with the nine droplets of reagent consumed a total of ∼0.62 µl of OPA, and ∼0.5 µg (7.4 pmole) of BSA. Thus, 100 µl of OPA reagent and 80 µg of BSA would be sufficient to run 160 separate assays of this type.
Programmable droplet motion
The ability to manoeuvre droplets by energising individually addressable electrodes on a 2-dimensional array inherently confers the ability to move multiple droplets in sequence or simultaneously by the activation of multiple electrodes, and the ability to move an ensemble of droplets along arbitrary paths on the array. Though, with an increasing number of droplets to be manoeuvred, the “traffic control” issues, e.g., maintaining appropriate distances between droplets that it are not desired to fuse, are not trivial, it is possible to automate a sequence of movements under computer control by writing a software script to realise a fully programmable fluidic processor.Detection of reaction products
Since the DEP electrodes require only one surface of the PFP, the other surface is free to accommodate diagnostic and analysis hardware such as diode laser/photodiodes.41 The 60–600 µm pitch electrode arrays used in these experiments provide ample real estate for solid-state detectors to be incorporated at each electrode position. Since the PFP chamber need only be slightly thicker than the largest droplets, placing diode laser/avalanche photodiode pairs in close proximity opposite the PFP electrodes could potentially realise extremely sensitive fluorescence detection assays as well as droplet position monitoring.On-demand synthesis of toxic/unstable compounds
Detection and analysis problems frequently involve the use of toxic reagents or unstable precursors which are undesirable or impractical to transport and store. The ability to carry out a set of programmable reactions autonomously also implies the ability to synthesise necessary agents on-demand from a set of less toxic or reactive pre-loaded reagents.Oligo synthesis
Future work on a DEP PFP will involve oligonucleotide and protein assembly. As new genomic assays are discovered it will be advantageous to be able to synthesise oligonucleotides or proteins at the point of care. Current technology requires that a new genetic marker be synthesised and replicated on gene chips,42 then quickly distributed to interested consumers owing to their relatively short shelf lives. The ability to mix droplets containing individual nucleic acid bases capped with photolabile protection groups43,44 would enable oligonucleotides to be synthesised “on-the-fly” in situ and used immediately in a diagnostic or pathogen detection mode. The programmability of the PFP would make it possible to produce new oligos and proteins by merely updating the software on the PFP or downloading a sequence from the Internet.Conclusions
The results obtained here demonstrate that dielectrophoresis can be used as the basis of a droplet processor in which droplets of different volumes may be moved and fused on a non-wetting reaction surface without requiring contact with a second, conductive surface as required for transport by electrowetting phenomena. Furthermore, our data shows that droplets of different sizes may be injected by dielectrophoresis. For example, Fig. 4 shows the injection of 3 pl droplets into a larger droplet that can be as voluminous as 70 nl. This permits aliquot dilutions of up to 20![[thin space (1/6-em)]](https://www.rsc.org/images/entities/char_2009.gif) 000, allowing for exquisite control of titrations.
000, allowing for exquisite control of titrations.
The increasing number of diseases that can be identified with specific molecular or genetic markers demonstrates the need to be able to do molecular assays quickly and economically. In the near future, patients will need to be screened not only for the genetic markers for their disease, but for susceptibilities to side effects of prospective treatments. Eventually, this could mean the need to screen up to 1000 genes per patient in order to identify the range of gene targets and drug sensitivities.45 Considering just cancer: the 1.3 million-plus diagnoses in the US this year means that for this type of molecular biological analyses to be possible, a tremendous reduction in the complexity, cost, and time to do these analyses will have to be realised.
In this paper we have presented proof-of-concept experiments using DEP controlled droplet-based chemistry to demonstrate the feasibility of a no-moving-parts programmable fluidic processor, or PFP, that can execute biochemical assays using pico-litre to nano-litre quantities of reagents and analytes on a solid-state, two-dimensional reaction surface. Further development of the PFP, employing multiple injectors containing a wide variety of reagents and analytes, and integrated solid-state detectors will bring rapid, economical, molecular diagnostics to the point of care.
Acknowledgements
The authors gratefully acknowledge the contributions of Mr. Tom Anderson for materials and mechanical fabrication and Mr. Chris Bonnerup for electronic hardware and software development. The Defense Advanced Research Projects Agency (DARPA) under contract #DAAD19-00-1-0515 funds this project.References
- J. M. Ramsey, J. P. Alarie, S. C. Jacobson and N. J. Peterson, Micro Total Analysis systems 2002, Nara, Japan, 3–11–2002, pp. 314–316.
- Y. Takamura, T. Hayama, M. Ueda, Y. Baba and Y. Horiike, Nara, Japan, pp. 317–319.
- S.-H. Lee, S. I. Cho, D. S. Chung and Y.-K. Kim, Nara, Japan, pp. 320–322.
- P. C. Li and D. J. Harrison, Anal. Chem., 1997, 69(8), 1564–1568 CrossRef CAS.
- T. K. S. Ramachandran, S. H. Lee, Y. A. Abdelaziez, D. E. Starkey, H. B. Halsall, W. R. Heineman and C. H. Ahn, Nara, Japan, 7–11–0003, pp. 560–562.
- M. A. Unger, H. P. Chou, T. Thorsen, A. Scherer and S. R. Quake, Science, 2000, 288(5463), 113–116 CrossRef CAS.
- R. J. Jackman, S. T. Brittain, A. Adams, M. G. Prentiss and G. M. Whitesides, Science, 1998, 280(5372), 2089–2091 CrossRef CAS.
- M. Washizu, IEEE Trans. Ind. Appl., 1998, 34(4), 732–737 CrossRef CAS.
- R. Ahmed, D. Hsu and T. B. Jones, First International Conference on Microchannels and Minichannels, Rochester, NY.
- T. B. Jones, Langmuir, 2002, 18, 4437–4443 CrossRef CAS.
- S. K. Cho, H. J. Moon and C. J. Kim, J. Microelectromech. Syst., 2003, 12(1), 70–80 CrossRef.
- M. G. Pollack, A. D. Shenderov and R. B. Fair, Lab Chip, 2002, 2, 96–101 RSC.
- M. G. Pollack, R. B. Fair and A. D. Shenderov, Appl. Phys. Lett., 2000, 77(11) Search PubMed.
- J. S. Batchelder, Rev. Sci. Instrum., 1983, 54(3), 300–302 CrossRef.
- T. B. Jones, J. Electrostat., 2001, 51, 290–299 Search PubMed.
- T. Nisisako, T. Torii and T. Higuchi, Lab Chip, 2002, 2(1), 24–26 RSC.
- J. Vykoukal, J. A. Schwartz, F. F. Becker and p. R. C. Gascoyne, Fifth International Conference on Miniaturized Chemical and Biochemical Analysis Systems, 2001, 72–74 Search PubMed.
- P. R. Gascoyne and J. Vykoukal, Electrophoresis, 2002, 23(13), 1973–1983 CrossRef CAS.
- P. R. C. Gascoyne, Y. Huang, R. Pethig, J. Vykoukal and F. F. Becker, Meas. Sci. Technol., 1992, 3, 439–445 CrossRef.
- X.-B. Wang, P. R. C. Gascoyne and F. F. Becker, IEEE: Eng. Med. Biol. Soc., 1994, 16, 774–775 Search PubMed.
- X.-B. Wang, Biochim. Biophys. Acta, 1995, 1243, 185–194 CrossRef CAS.
- X.-B. Wang, Y. Huang, X. Wang, F. F. Becker and P. R. C. Gascoyne, Biophys. J., 1997, 72, 1887–1899 CAS.
- X.-B. Wang, Y. Huang, P. R. C. Gascoyne and F. F. Becker, IEEE Trans. Ind. Appl., 1997, 33(3), 660–669 CrossRef.
- M. Washizu, T. Nanba and S. Masuda, IEEE Trans. Ind. Appl., 1989, 25(4), 732–737 CrossRef.
- J. Suehiro and R. Pethig, J. Phys. D-Appl. Phys., 1998, 31(22), 3298–3305 CrossRef CAS.
- P. R. C. Gascoyne, Biochim. Biophys. Acta, 1993, 1149, 119–126 CrossRef CAS.
- P. R. C. Gascoyne, IEEE EMBS, 1994, 16, 772–773 Search PubMed.
- P. R. C. Gascoyne, X.-B. Wang, Y. Huang and F. F. Becker, IEEE Trans. Ind. Appl., 1997, 33(3), 670–678 CrossRef.
- J. Yang, Anal. Chem., 1998, 71(5), 911–918 CrossRef CAS.
- J. Yang, J. Vykoukal, J. Noshari, F. Becker and P. Gascoyne, IJAMS, 2000, 3(Issue 2), 1–12 Search PubMed.
- R. Gambari, M. Borgatti, L. Altomare, N. Manaresi, G. Medoro, A. Romani, M. Tartagni and R. Guerrieri, Technol. Cancer Res. Treat., 2003, 2(1), 31–39 Search PubMed.
- F. M. Moesner and T. Higuchi, IEEE Industry Applications Soc., 1997, 3, 2004–2011 Search PubMed.
- T. B. Jones, Langmuir, 2003, 19, 7646–7651 CrossRef CAS.
- W. R. Gillap, N. D. Weiner and M. Gibaldi, J. Am. Oil Chem. Soc., 1967, 44, 71–73 CAS.
- R. Aveyard and D. A. Haydon, Trans. Faraday Soc., 1965, 61, 2255–2261 RSC.
- R. Pethig, Dielectric and Electronic Properties of Biological Materials, John Wiley & Sons, 1979 Search PubMed.
- H. A. Pohl, Dielectrophoresis: the behavior of neutral matter in nonuniform electric fields, Cambridge University Press, Cambridge, New York, 1978, 1–579 Search PubMed.
- T. B. Jones and M. Washizu, J. Electrost., 1996, 37, 121 CrossRef.
- J. Zeng and T. Korsmeyer, 5th annual BioMEMS 2003, San Jose, CA.
- A. D. Stroock, S. K. Dertinger, A. Ajdari, I. Mezic, H. A. Stone and G. M. Whitesides, Science, 2002, 295(5555), 647–651 CrossRef CAS.
- E. P. Thrush, O. Levi, K. Wang, S. James and S. J. Smith, Proc. SPIE, 2003, 4982, 162–169 Search PubMed.
- B. Phimister, Nature Genet., 1999, 21(Supplement 1), 1–60 CrossRef CAS.
- S. P. A. Fodor, J. L. Read, M. C. Pirrung, L. Stryer, A. T. Lu and D. Solas, Science, 1991, 251, 767–773 CAS.
- A. C. Pease, D. Solas, E. J. Sullivan, M. T. Cronin, C. P. Holmes and S. P. A. Fodor, Proc. Natl. Acad. Sci. USA, 1994, 91, 5022–5026.
- D. Hanahan and R. A. Weinberg, Cell, 2000, 100(1), 57–70 CAS.
| This journal is © The Royal Society of Chemistry 2004 |