Structural study by transmission and scanning electron microscopy of the time-dependent structural change in M41S mesoporous silica (MCM-41 to MCM-48, and MCM-50)
Isabel
Díaz
*a,
Joaquin
Pérez-Pariente
a and
Osamu
Terasaki†
b
aInstituto de Catálisis y Petroleoquímica, CSIC, Campus Cantoblanco, 28049, -Madrid, Spain. E-mail: idiaz@icp.csic.es; Fax: +34-91-5854760; Tel: +34-91-5854795
bDepartment of Physics, Tohoku University, Sendai, 980-8577, Japan
First published on 2nd December 2003
Abstract
High resolution transmission electron microscopy and field emission scanning electron microscopy are used to provide direct evidence for the solid-state transformations from cubic MCM-48 to lamellar mesophases. The structural change from MCM-41 to MCM-48 and MCM-50 with temperature is described in this report. Initially, a meta-stable MCM-41 is formed at room temperature, which turns into MCM-48 after a few hours at 140 °C. Thermal treatment over longer periods of time leads to the formation of a lamellar phase. Thermogravimetric studies are presented for a better understanding of the surfactant–silica system and its modifications with temperature.
Introduction
Since the discovery of the M41S mesoporous materials family,1 major developments have been made in this field. Ordered mesoporous materials with various hexagonal, cubic and lamellar structures may be prepared by suitable adjustment of the synthesis conditions.2–4 All three phases in the M41S family can be synthesized by slightly varying the reaction conditions, but the energetic stability decreases following the order: lamellar phase, hexagonal MCM-41, cubic MCM-48. Important aspects regarding the systematic transformation of the surfactant–silicate meso-structure, for example, the synthesis conditions, as well as kinetic and structural issues, of the MCM-41/48 system, as well as the different binary combinations of phase transitions involving lamellar, MCM-48 and MCM-41 phases, have been widely studied in the last decade. Much effort has been devoted to increasing the understanding of the nature and behaviour of the surfactant–silica system and its effect on the final structure of the mesoporous material.5–7 Phase transformations from lamellar to MCM-41 mesophases based on pH modifications,8–10 as well as the transition from MCM-41 to MCM-48 with changes in temperature,11 have been claimed. However, the evidence for these claims is scarce and the basics underlying these transformations remain unclear. Only recently verification methods and experimental results from in situ X ray diffraction and high resolution transmission electron microscopy (HRTEM) have become available and these have allowed the mechanism of the mesoporous phase transformation to be explained. Landry et al. reported an in situ X-ray diffraction study of the temperature-dependent phase transformation of MCM-41 to MCM-48.12 However, this method doesn't solve the question of whether the transformation occurs via either a dissolution–reconstruction or a “solid-state” mechanism. On the other hand, Terasaki et al. have shown that 3d mesoporous structures could be solved by electron crystallography, and structure solutions for pure MCM-48,13 SBA-1, SBA-6 and SBA-16,14 and SBA-1215 phases have been reported. Very recently, the same researchers have also solved the epitaxial phase transformation from hexagonal p6mm to cubic Pm![[3 with combining macron]](https://www.rsc.org/images/entities/char_0033_0304.gif) n mesoporous phases by HRTEM.16,17
n mesoporous phases by HRTEM.16,17
In this report we describe the use of X-ray diffraction (XRD), high resolution transmission electron microscopy and field emission scanning electron microscopy (FE-SEM) in a study of the structural relationship between hexagonal MCM-41, cubic MCM-48 and lamellar mesophases synthesized in a “closed system” at 140 °C. Thermogravimetric (TG) studies are also presented for a better understanding of the surfactant–silica system and its modifications with changes in temperature.
Experimental
Sample preparation
The synthesis of MCM-48 was performed by a hydrothermal reaction using cetyltrimethylammonium bromide (CTAB) as the structure agent, ethanol as an auxiliary additive, and sodium silicate as the silica source. The initial composition of the gel was as follow: SiO2 ∶ 0.25 Na2O ∶ 0.65 CTAB ∶ 4.7 EtOH ∶ 120 H2O. The synthesis procedure has been described in detail elsewhere.18 First the sodium silicate was prepared from colloidal silica and NaOH at 80 °C, which was then added dropwise under continuous stirring, at room temperature, to the surfactant solution (CTAB + H2O + EtOH). After stirring the resultant mixture for 25 min, a small amount of gel was filtered off with no thermal treatment (labelled as the 0 h sample). The remaining gel was then introduced into 40 ml Teflon-lined stainless steel autoclaves and treated at 140 °C for 2, 6, 17, 20, 30, 48 and 68 hours. Thermal treatments lasting for more than 120 hours led to amorphous materials. The recovered white solids were cooled and filtered off quickly, washed with hot water and dried at room temperature overnight. Eventually, dried samples were calcined for 6 hours at 550 °C, under a flow of air, for comparison purposes. However, emphasis was placed on the characterization of the as-made materials (prior to calcination) by X ray diffraction, thermogravimetry, high resolution transmission electron microscopy and field emission scanning electron microscopy.Sample characterization
The X ray diffraction patterns were collected with a Philips X'Pert-MD in STEP/SCAN 2θ mode from 1.5 to 7° at 0.04 ° min−1 with 40 s step−1. Thermogravimetric analyses were performed in a Perkin-Elmer TGA7 instrument, by heating the samples from 30 to 800 °C at a heating rate of 10 °C min−1 under air flow. For the HRTEM experiments the samples were dispersed in acetone, without crushing, and dropped onto a holey carbon microgrid. Micrographs and selected area electron diffraction (SAED) patterns were recorded on a JEOL 3010 transmission electron microscope operating at 300 kV and a JEOL ARM 1250 microscope operating at 1250 kV. FE-SEM images were taken using a JEOL JSM 6335F at 2.0 kV with no metal coating.Results and discussion
X-Ray diffraction
Fig. 1 shows the X-ray diffraction patterns of the as-made samples obtained at different reaction times in the oven at 140 °C. The predominant mesophase initially formed in the synthesis gel, prior to the thermal treatment (0 h), is the hexagonal MCM-41 phase. Then, when the gel is treated at 140 °C the structure changes to the cubic Ia![[3 with combining macron]](https://www.rsc.org/images/entities/char_0033_0304.gif) d MCM-48 phase (20 h) and finally, after 48 hours, the lamellar structure becomes predominant. There are two different phase transitions. The first one, from MCM-41 to MCM-48 is not clear and not easy to follow because the hexagonal phase disappears in the oven (see 2 h in fig 1). The second phase transition from cubic to lamellar occurs between 20 and 48 h in the oven at 140 °C.
d MCM-48 phase (20 h) and finally, after 48 hours, the lamellar structure becomes predominant. There are two different phase transitions. The first one, from MCM-41 to MCM-48 is not clear and not easy to follow because the hexagonal phase disappears in the oven (see 2 h in fig 1). The second phase transition from cubic to lamellar occurs between 20 and 48 h in the oven at 140 °C.
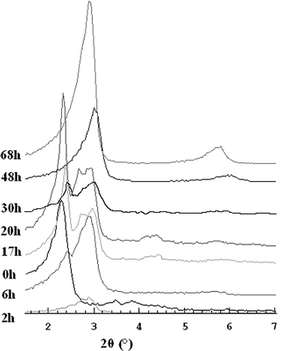 | ||
| Fig. 1 XRD patterns of the as-made materials synthesised at 140 °C. | ||
In contrast to the observation of Gallis and Landry,11 after 4 h of treatment at 140 °C only traces of MCM-48 were observed. According to their results, MCM-41 can be detected in the early stages of the synthesis at room temperature, as evidenced by an intense 100 reflection at a low angle and two weaker ones—110 and 200 reflections—at higher angles in the XRD pattern. But this hexagonal mesophase is not stable after calcination, probably due to little condensation of the silica at that stage in the reaction; a reaction time of less than half an hour at room temperature is not long enough to form strong silica walls even though the hexagonal phase is already formed when the CTAB is dissolved in water. Should the self-assembled mechanism be assumed, in the early stages weak silica walls cover the straight rods in a hexagonal arrangement and during the hydrothermal treatment, silica condensation takes place and more surfactant is incorporated forming a 3-D rod system. Fig. 2 shows the XRD pattern of the 20 h sample after calcination, which corresponds to a highly ordered MCM-48 (Ia![[3 with combining macron]](https://www.rsc.org/images/entities/char_0033_0304.gif) d) phase with a large unit cell (a
= 61/2
×
d211calc
= 84.8 Å) as Ryoo et al. predicted.18 In Fig. 2, the XRD pattern of the as-made 6 h sample can also be seen, which shows a broad peak with d-spacing centered at 30.7 Å and a weak but sharp shoulder at ca. 36 Å. Upon calcination, the broad peak disappears and the narrow peak is shifted to 33 Å overlapping with the 211 reflection of calcined MCM-48. On the other hand, after 20 h the as-made sample also shows extra peaks with d-spacings at 30–31 Å
(denoted with *), which disappear after calcination. This suggests that an equilibrium is reached between a meta-stable lamellar phase and the stable and highly ordered cubic Ia
d) phase with a large unit cell (a
= 61/2
×
d211calc
= 84.8 Å) as Ryoo et al. predicted.18 In Fig. 2, the XRD pattern of the as-made 6 h sample can also be seen, which shows a broad peak with d-spacing centered at 30.7 Å and a weak but sharp shoulder at ca. 36 Å. Upon calcination, the broad peak disappears and the narrow peak is shifted to 33 Å overlapping with the 211 reflection of calcined MCM-48. On the other hand, after 20 h the as-made sample also shows extra peaks with d-spacings at 30–31 Å
(denoted with *), which disappear after calcination. This suggests that an equilibrium is reached between a meta-stable lamellar phase and the stable and highly ordered cubic Ia![[3 with combining macron]](https://www.rsc.org/images/entities/char_0033_0304.gif) d one, prior to the phase transition to pure lamellar phase.19,20
d one, prior to the phase transition to pure lamellar phase.19,20
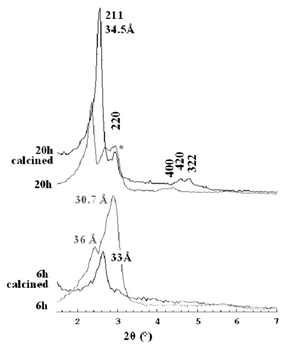 | ||
| Fig. 2 XRD patterns of the as-made and calcined materials, treated for 6 h (bottom diffractograms) and 20 h (top diffractograms). | ||
As the MCM-41 to MCM-48 phase transformation cannot be followed, we can only refer, as other authors have done, to the position of the most intense 100 reflection of MCM-41 and the 211 reflection of MCM-48, whose d-spacings coincide, suggesting some geometry-related family of planes.17 Gallis and Landry suggested that the generation of EtOH from TEOS (tetraethyl orthosilicate) is needed for the phase transformation to occur.11 Indeed, when sodium silicate is used as the silicon source, extra EtOH has to be added to produce the highly ordered and pure MCM-48.18
For the synthesis conditions described in the present work, the phase transformation from MCM-48 to lamellar occurs with time in the oven, without any co-solvent or pH adjustment. As time increases, the intensity of the 211 reflection of the cubic symmetry decreases significantly to the benefit of the 001 reflection of the lamellar structure (Fig. 1). Note that from the 30 h XRD pattern, it could be suggested that both phases coexist.20 Thus, we focused on a study of the internal structure of this material by electron microscopy.
Thermogravimetry
From the thermal analyses of the as-made samples it is possible to analyse the behaviour of the surfactant in the different solids. The large decrease in total weight loss of the samples analysed after hydrothermal treatment (e.g. 17% from the 0 h to the 6 h sample) is evidence of a higher degree of silica condensation in the solids (Table 1).| Sample | Weight loss (%) | |||
|---|---|---|---|---|
| I: T < 120 °C | II: 120 < T < 350 °C | III: 350 < T < 800 °C | Total | |
| 0 h | 5.8 | 60.8 | 6.6 | 67.4 |
| 2 h | 6.3 | 41.2 | 10.5 | 51.7 |
| 6 h | 6.3 | 38.8 | 11.1 | 49.9 |
| 17 h | 5.7 | 39.6 | 10.9 | 50.5 |
| 20 h | 6.5 | 39.5 | 10.4 | 49.9 |
| 30 h | 5.7 | 39.3 | 10.4 | 49.7 |
| 48 h | 5.8 | 41.5 | 7.8 | 49.3 |
| 68 h | 6.4 | 43.5 | 6.2 | 49.7 |
The data collected in Table 1 show that the total weight lost remains nearly constant after 6 h in the oven, which means that the suggested phase transformation takes place without changes in the amount of surfactant incorporated in the solid. However, trends in the different contributions of the weight losses can be observed. Three major weight loss regions have been quantified based on the derivative of the curves (DTG) shown in Fig. 3.
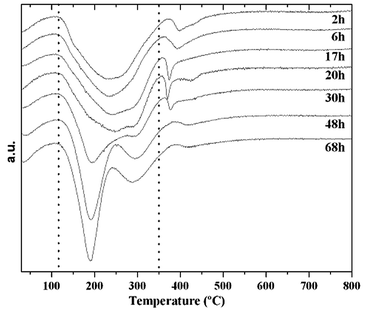 | ||
| Fig. 3 DTG curves of the as-made samples treated for different times at 140 °C. | ||
Table 1 shows that the first weight loss, below 120 °C, corresponding to water desorption, remains essentially constant (6%) for all the samples. The second and prominent weight loss, centred at ca. 200 °C, is due to the decomposition/desorption of the surfactant, and the structure undergoes modifications, probably related to the previously mentioned phase transformation of the meso-structure. Finally, the peak observed over 350 °C also shows variations in both shape and amount that can be attributed, to some extent, to some structural modifications as well as the well known desorption of water from silanol condensation.21 The weight loss related to peak II (120–350 °C) decreases from the early stages of synthesis until the MCM-48 structure is formed (20 h), with this trend reversing after 30 h when the lamellar phase becomes predominant. At the same time, the weight loss related to the higher temperature peak (350–800 °C) varies in the opposite way with a sharp peak in the 20 h DTG curve that decreases during the transformation to the lamellar phase.
Even though the decomposition and desorption of cetyltrimethylammonium cannot be fine-tuned by TG, the behaviour observed can be explained by variations in the surfactant–silica binding. At short times of hydrothermal treatment (2–20 h) the silica shrinkage increases producing a more stable silica–surfactant interface. This could be attributed to a stable structure (MCM-48) with the surfactant strongly bound within.21 As time progresses beyond the MCM-48 thermal stability threshold, the largest and most prominent well-defined peak shifts below 200 °C and a new smooth broad peak at 400 °C substitutes the sharp peak seen in the pure MCM-48 DTG curve. This increase in the amount of “weakly bound” surfactant accompanies the formation of a predominant meta-stable lamellar mesophase in the solid.
High resolution transmission electron microscopy
HRTEM has been used to determine whether the transformations occur via either solid–solid or dissolution–re-crystallization processes. Although these transformations strongly depend on the synthesis conditions and are not easy to reproduce, we focused on the crystallographic direction of the transformations. Therefore, as-made, and uncrushed samples were studied extensively by HRTEM. Evidence for the growth of the cubic phase in the early stages of the hydrothermal synthesis was found in the as-made 6 h sample (Fig. 4), whereas the MCM-41 structure was not found in either the 2 h or 6 h sample.![HRTEM image and electron diffraction pattern of the [111] orientation in the 6 h as-made sample, recorded with a JEOL JEM 3010.](/image/article/2004/JM/b310281e/b310281e-f4.gif) | ||
| Fig. 4 HRTEM image and electron diffraction pattern of the [111] orientation in the 6 h as-made sample, recorded with a JEOL JEM 3010. | ||
The most evident feature of the phase transformations comes from low magnification observations, i.e. the crystal shape. In Fig. 5 it is clearly seen that the perfectly shaped truncated octahedral crystals of MCM-48 (20 h) start to break and “open” in the 30 h sample. When the material is treated for 48 hours, the crystals are completely open with rod-shaped crystals where the lamellar mesostructure is observed.
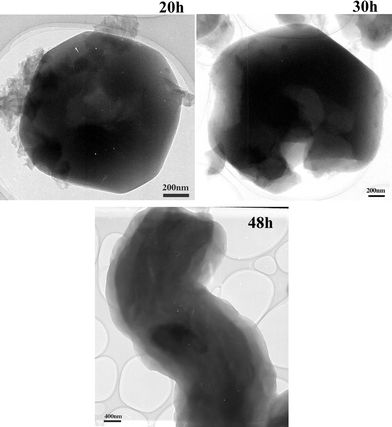 | ||
| Fig. 5 Low magnification transmission electron microscopy images of the 20 h, 30 h and 48 h as-made samples prepared without crushing. | ||
The meso-structure of these different shaped crystals has been investigated by tilting the crystals in a JEOL ARM 1250 electron microscope equipped with ±35° double tilt holder. HRTEM images and selected area electron diffraction patterns (SAED) of the as-made 20 h sample along the [100], [110] and [111] zone axes are shown in Fig. 6 and corroborate the Ia![[3 with combining macron]](https://www.rsc.org/images/entities/char_0033_0304.gif) d symmetry.
d symmetry.
![High resolution images and selected area electron diffraction patterns (SAED) of a crystal of the 20 h as-made sample. The crystal was tilted until the incident electron was parallel with the [100], [110] and [111] axes.](/image/article/2004/JM/b310281e/b310281e-f6.gif) | ||
| Fig. 6 High resolution images and selected area electron diffraction patterns (SAED) of a crystal of the 20 h as-made sample. The crystal was tilted until the incident electron was parallel with the [100], [110] and [111] axes. | ||
As time increases the intensity of the 211 reflection in the XRD pattern decreases significantly (Fig. 1), and the crystals start to break, however perfectly ordered and symmetric [100], [311], and [111] SAED patterns can be easily observed in the microscope for the 30 h sample (Fig. 7). Apparently, such SAED patterns can be indexed as Ia![[3 with combining macron]](https://www.rsc.org/images/entities/char_0033_0304.gif) d but slight deviations towards orthorhombic symmetry can be found in some SAED patterns measured along the [110] axes (data not shown).
d but slight deviations towards orthorhombic symmetry can be found in some SAED patterns measured along the [110] axes (data not shown).
![HRTEM images and SAED patterns of a crystal of the 30 h as-made sample. The crystal was tilted until the incident electron was parallel with the [100], [311] and [111] axes.](/image/article/2004/JM/b310281e/b310281e-f7.gif) | ||
| Fig. 7 HRTEM images and SAED patterns of a crystal of the 30 h as-made sample. The crystal was tilted until the incident electron was parallel with the [100], [311] and [111] axes. | ||
It is well known that the cubic MCM-48 structure contains a 3d rod-like system with channels running along the <110> direction. Furthermore, the [100] and [111] orientations are the most favoured for any structural crystallographic modification to orthorhombic symmetry to be observed. Thus, a given phase transformation would be expected to come from either of these two orientations. Conversely, a loss of symmetry is only observed in the [110] zone axis of the 30 h crystals. As an example, Fig. 8 shows an image of a crystal of the 30 h as-made sample, along the [110] orientation. In this image, the transition from 2-D crystalline along the [110] face to a 1-D lamellar structure can be seen due to the leaching of the material. The 1-D structure was confirmed by tilting the specimen. Furthermore, the d-spacing of these lattice fringes is ca. 20 Å, with its associated reflection included in the second, broad peak of the XRD pattern of the 30 h sample. This leaching, initially seen at the edges of the highly ordered crystals, developed with time, leading to the lamellar structure shown by the 48 h sample (Fig. 9). As is evidenced from the HRTEM images, the array of layers in this sample corresponds to a d-spacing of ca. 23 Å, in agreement with the occurrence of a rearrangement of the surfactant–silica system.
![[110] orientation of the 30 h as-made sample.](/image/article/2004/JM/b310281e/b310281e-f8.gif) | ||
| Fig. 8 [110] orientation of the 30 h as-made sample. | ||
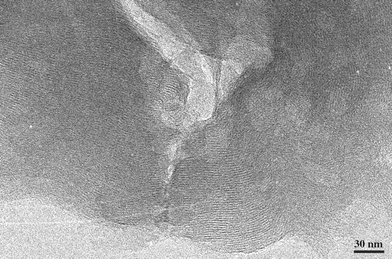 | ||
| Fig. 9 Image of a typical lamellar structure at the edges of the crystals of the 48 h as-made sample. | ||
Based on the calculations made by Alfredsson et al.,22 on the outer surface of the truncated octahedral geometry of MCM-48 crystals, only one of the channel systems is exposed to the exterior. By using the same approach, it could be possible to corroborate the hypothesis of phase transformations occurring along the [110] face.
Field emission scanning electron microscopy
The truncated octahedral shape of the MCM-48 particles has been widely studied.18,22 However, the growth mechanism of the particles is still under discussion. This issue can be solved nowadays thanks to the newly developed field emission scanning electron microscopy. To observe genuine pore structures on the external surface, the samples can be studied with no metal coating. By using a low accelerating voltage, selective information from the surface region can be obtained. In addition, the charging problems common for dielectric insulators are not serious. Terasaki et al. have successfully applied this technique to “see” the pore mouths of mesoporous SBA-15 and carbon pipes.23The samples synthesised in this work have been investigated by FE-SEM in order to obtain further information about the changes in the morphology of the bulky solids. As the images in Fig. 10 show, very small spherical particles rise up from the disordered surfactant–silica background after 6 h. However these small particles are not as well shaped as shown in a similar study by Ryoo and Kim.24 Such particles increase in size and their shapes improve up to 20 h, as the single crystal-like MCM-48 particles are formed, which can be easily distinguished from the amorphous background. In the high magnification FE-SEM image of the 30 h sample, it is possible to observe the phase transformation via leaching from truncated octahedral crystals to a layered morphology. These MCM-48 single crystals (20 h) eventually change to a lamellar structure (48 h) with fully developed lettuce-like morphology.
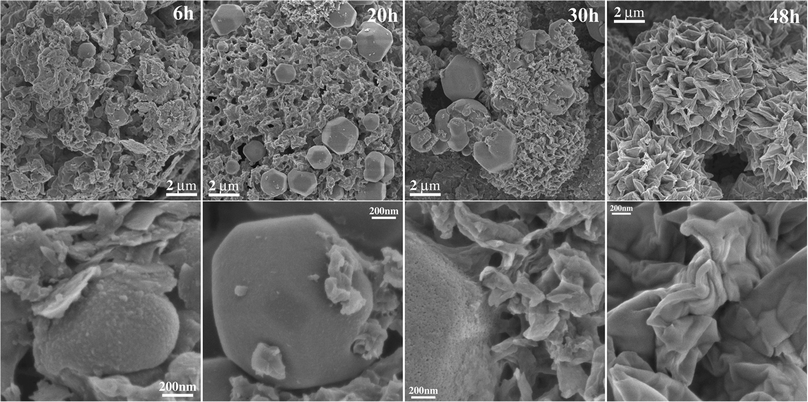 | ||
| Fig. 10 FE-SEM of as-made mesoporous solids synthesized at 140 °C for 6, 20, 30 and 48 hours. Samples were studied without coating and the images shown correspond to a magnification of ×5000 (upper) and ×50000 (lower). | ||
Therefore, the FE-SEM observations support the hypothesis that under the synthesis conditions described in this paper, the MCM-48 (cubic) to MCM-50 (lamellar) transformation occurs via a solid state mechanism and not by the dissolving–reconstructing route, the lamellar meso-structure being the thermodynamically most stable phase, and [110] the preferred face for the transformation.
Conclusions
Structural phase changes in the mesoporous family M41S were discussed in the work described herein. Although such transformations strongly depend on the synthesis conditions and are not easy to reproduce, interest was focused on the crystallographic direction of the transformations. The predominant mesophase initially formed in the synthesis gel prior to thermal treatment (0 h) is the hexagonal MCM-41. Then, when the gel is treated at 140 °C the structure changes to the cubic Ia![[3 with combining macron]](https://www.rsc.org/images/entities/char_0033_0304.gif) d MCM-48 phase (20 h) and finally, after 48 hours, the lamellar structure is predominant. There are two different phase transitions. The first one, from MCM-41 to MCM-48 is not clear and is not easy to follow because the hexagonal phase disappears in the oven, indicating a dissolving–reconstructing route. The second phase transition from cubic to lamellar occurs from 20 h to 48 h in the oven at 140 °C. High resolution transmission electron microscopy and field emission scanning electron microscopy have been used in this work to prove that the transformation from MCM-48 (cubic) to MCM-50 (lamellar) occurs via a solid state transition, rather than by the dissolving–reconstructing mechanism, the lamellar meso-structure being the thermodynamically most stable phase, and [110] the preferred face for the transformation.
d MCM-48 phase (20 h) and finally, after 48 hours, the lamellar structure is predominant. There are two different phase transitions. The first one, from MCM-41 to MCM-48 is not clear and is not easy to follow because the hexagonal phase disappears in the oven, indicating a dissolving–reconstructing route. The second phase transition from cubic to lamellar occurs from 20 h to 48 h in the oven at 140 °C. High resolution transmission electron microscopy and field emission scanning electron microscopy have been used in this work to prove that the transformation from MCM-48 (cubic) to MCM-50 (lamellar) occurs via a solid state transition, rather than by the dissolving–reconstructing mechanism, the lamellar meso-structure being the thermodynamically most stable phase, and [110] the preferred face for the transformation.
Acknowledgements
Part of this study was supported by the CREST program, Japan Science and Technology Corporation (O.T). I.D. acknowledges the Spanish Ministry of Education for a PhD travel-grant. Professor R. Ryoo and Dr A. E. Garcia-Bennett are also acknowledged for valuable discussions.References
- C. T. Kresge, M. E. Leonowicz, W. J. Roth, J. C. Vartulli and J. S. Beck, Nature, 1992, 359, 710 CrossRef CAS.
- A. Monnier, F. Schuth, Q. Huo, D. Margolese, R. S. Maxwell, G. D. Stucky, M. Krishamurty, P. Petroff, A. Firouzi, M. Janicke and B. F. Chmelka, Science, 1993, 261, 1299 CAS.
- S. A. Bagshaw, E. Prouzet and T. J. Pinnavaia, Science, 1995, 269, 1242.
- Q. Huo, R. Leon, P. M. Petroff and G. D. Stucky, Science, 1995, 268, 1324 CAS.
- J. C. Vartulli, K. D. Schmitt, C. T. Kresge, W. J. Roth, M. E. Leonowicz, S. B. McCullen, S. D. Hellring, J. S. Beck, J. L. Schlenker, D. H. Olson and E. W. Sheppard, Chem. Mater., 1994, 6, 2317 CrossRef CAS.
- Q. Huo, D. I. Marlogese and G. D. Stucky, Chem. Mater., 1996, 8, 1147 CrossRef CAS.
- M. T. Andersson, J. E. Martin, J. G. Odinek and P. P. Newcomer, Chem. Mater., 1998, 10, 311 CrossRef CAS.
- V. Alfredsson, M. Keung, A. Monnier, G. D. Stucky, K. K. Unger and F. Schuth, J. Chem. Soc., Chem. Comm., 1994, 921 RSC.
- C.-F. Cheng, D. H. Park and J. Klinowski, J. Chem. Soc., Faraday Trans., 1997, 93, 193 RSC.
- Z. Luan, H. He, W. Zhou and J. Klinowski, J. Chem. Soc., Faraday Trans., 1998, 94, 979 RSC.
- K. W. Gallis and C. C. Landry, Chem. Mater., 1997, 9, 2035 CrossRef CAS.
- C. C. Landry, S. H. Tolbert, K. W. Gallis, A. Monnier, G. D. Stucky, P. Norby and J. C. Hanson, Chem. Mater., 2001, 13, 1600 CrossRef CAS.
- A. Carlsson, M. Kaneda, O. Terasaki, R. Ryoo and H. Joo, J. Electron Microsc., 1999, 48, 795 Search PubMed.
- Y. Sakamoto, M. Kaneda, O. Terasaki, D. Y. Zhao, J. M. Kim, G. D. Stucky, H. J. Shin and R. Ryoo, Nature, 2000, 408, 449 CrossRef CAS.
- Y. Sakamoto, I. Díaz, O. Terasaki, D. Zhao, J. Pérez-Pariente, J. M. Kim and G. D. Stucky, J. Phys. Chem. B, 2002, 106, 3118 CrossRef CAS.
- S. Che, S. Kamiya, O. Terasaki and T. Tatsumi, J. Am. Chem. Soc., 2001, 123, 12089 CrossRef CAS.
- S. Kamiya, H. Tanaka, S. Che, T. Tatsumi and O. Terasaki, Solid State Sci., 2003, 5, 197 CrossRef CAS.
- J. M. Kim, S. K. Kim and R. Ryoo, Chem. Commun., 1998, 259 RSC.
- A. Corma, Q. Kan and F. Rey, Chem. Commun., 1998, 579 RSC.
- J. Xu, Z. Luan, H. He, W. Zhou and L. Kevan, Chem. Mater., 1998, 10, 3690 CrossRef CAS.
- M. Kruk, M. Jaroniec, R. Ryoo and S. H. Joo, Chem Mater., 2000, 12, 1414 CrossRef CAS.
- V. Alfredsson, M. W. Anderson, T. Ohsuna, O. Terasaki, M. Jacob and M. Bojrup, Chem. Mater., 1997, 9, 2066 CrossRef CAS.
- S. Che, K. Lund, T. Tatsumi, S. Iijima, S. H. Joo, R. Ryoo and O. Terasaki, Angew. Chem., Int. Ed., 2003, 42, 2182 CrossRef CAS.
- R. Ryoo and J. M. Kim, Proceedings of the 12th International Zeolite Conference, Materials Research Society, Warrendale, Pennsylvania, USA, 1999, p. 689 Search PubMed.
Footnote |
| † Current address: Arrhenius Laboratory, Stockholm University, S-106 91 Stockholm, Sweden. E-mail: terasaki@struc.su.se; Tel: +46 8 16 23 79. |
| This journal is © The Royal Society of Chemistry 2004 |
