Use of aqueous foams for the synthesis of gold nanoparticles of variable morphology
Saikat
Mandal
,
Sujatha K.
Arumugam
,
Suguna D.
Adyanthaya
,
Renu
Pasricha
and
Murali
Sastry
*
Materials Chemistry Division, National Chemical Laboratory, Pune–411 008, India
First published on 6th October 2003
Abstract
In this paper we describe the facile synthesis of gold nanocrystals of variable morphology using aqueous foam as a template. The aqueous foams are formed by bubbling an aqueous solution of AuCl−4 ions electrostatically complexed with the surfactant cetyltrimethylammonium bromide (CTAB). The gold ions in the stable foam are then reduced by hydrazine vapours, this process leading to the formation of gold nanoparticles of spherical, flat plate and flake-like structures. The variation in morphology of the gold nanoparticles derived from the foam is believed to arise from the complex spatial structure of reaction sites in the foam. The foam-derived gold nanoparticles were analysed by UV-vis spectroscopy, X-ray diffraction, Fourier transform infrared spectroscopy and transmission electron microscopy.
1. Introduction
Nanomaterials are now an important area of research, especially because their physical and chemical properties can be tuned by a single parameter such as particle size. It is now realized that nanoparticle shape plays an equally important role in defining their electrical and optical properties.1–3 Consequently, one of the challenges in advanced materials synthesis is developing synthesis methodologies that would enable control of the inorganic nanocrystal morphology. One can achieve nanoparticle shape control by the use of a static template, which enhances the growth rate of one crystallographic face over another. For example, two-dimensional films are obtained when there is favorable epitaxy on a substrate4 such as the growth of calcite on carboxy-terminated lipid bilayers.5 There are also many demonstrated cases of anisotropic inorganic nanocrystal growth in liquid media. The vapor–liquid–solid growth mechanism in which a solid rod grows out of a supersaturated droplet has been very successful in creating one dimensional materials.6 Structured reaction media such as regular or inverse micelles7–10 as well as electrochemical methods11,12 have also been used successfully for the synthesis of anisotropic gold nanoparticles. A pronounced effect of the surfactant or precursor ratio on particle shape was observed in the case of platinum nanocrystals.13 Recently Liz-Marzan's group have reported on the synthesis of silver nanoprisms in DMF using PVP as a stabilizer.14 Pileni and co-workers have reported on the synthesis of silver nanodisks by varying the ratio of surfactant (AOT) and reducing agent (hydrazine).15 Shirai et al. have prepared platinum nanosheets between graphite layers by reduction of platinum tetrachloride–graphite intercalated compounds under a hydrogen atmosphere.16 Nanorods of silver,17,18 gold,19–21 CdSe,22 tungsten sulfide,23 and nanoprisms of silver,24 gold,25 and CdS26 are some of the interesting nanocrystalline shapes that may now be routinely synthesized in the laboratory. Insofar as metal nanowires/rods are concerned, experimental protocols based on templating,27,28 photochemistry,19 seeding29,30 and electrochemistry11,12 have been developed. Sastry and co-workers have recently demonstrated the spontaneous reduction of chloroaurate ions present in the subphase by Langmuir monolayers of hexadecylaniline (HDA) leading to the formation of highly oriented, flat gold sheets and ribbon-like nanocrystals bound to the monolayer.31An exciting and hitherto considerably underexploited dynamic biomimetic template for crystal growth is foam lamellae.32 Davey and co-workers have shown that stabilizing surfactants at the air-bubble/solution interface in foams could be used as nucleation centers for the growth of glycine and CaCO3 crystals.32 The foam provides a high surface area of gas bubbles dispersed in a liquid. The stabilizing surfactant or other amphiphile is adsorbed at the gas/liquid interface and hence offers the possibility that the liquid lamellae might be used as a template for growing a range of inorganic materials by novel chemistry. Since the thickness of the liquid lamellae is controlled by the drainage within the plateau borders of the foam, it also follows that the size of the resulting inorganic crystals may be controlled via the drainage rate. In this paper we describe a simple procedure for the large-scale synthesis of anisotropic gold nanoparticles in aqueous foams stabilized by the surfactant cetyltrimethylammonium bromide (CTAB). This is accomplished in a two-step process involving the electrostatic binding of AuCl−4 ions with the cationic CTAB molecules populating the air-bubble/solution interface followed by the reduction with hydrazine vapors in the final step. A highlight of this study is our observation that gold nanoparticles of variable morphology are formed within different regions of the foam. We believe this is due to the variation in structure across the foam presenting reaction cavities of variable thickness. Presented below are details of the investigation.
2 Experimental details
2.1 Chemicals
Chloroauric acid (HAuCl4), cetyltrimethylammonium bromide (CTAB) and hydrazine (N2H4) were obtained from Aldrich Chemicals and used as received.2.2 Preparation of gold nanocrystals in aqueous CTAB foam
In a typical experiment, a rectangular column 50 cm in height and with a square base of 10 × 10 cm2 with sintered ceramic discs embedded in it was used for generation of the foam. An aqueous mixture of 100 ml of 2 × 10⁻³ M chloroauric acid and 100 ml of 2 × 10⁻² M CTAB was added to the rectangular column and the foam built up by injecting air at a pressure of 1–5 psi through a porous ceramic disc fixed to the bottom of the foam column. Stable foams 40 cm in height and with a bubble size of 1 mm could routinely be obtained. After carefully draining out the excess aqueous CTAB–HAuCl4 solution, the gold ions in the foam were subjected to reduction by exposure to hydrazine vapors. As the nanoparticle formation progressed the foam changed to a purple colour and gradually collapsed. The collapsed foam solution containing the gold nanoparticles was collected through an outlet provided at the bottom of the column (sample 1). This solution (sample 1) was then subjected to centrifugation at 5000 rpm for 30 minutes following which the supernatant (sample 2) and pellet (sample 3) were separated and characterized by different techniques. Please note that sample 3 for further analysis was prepared by redispersing the gold nanoparticle pellet in 10 ml of water. A control experiment was performed wherein gold nanoparticle synthesis was achieved directly in solution by the reduction of a 2 × 10⁻³ M aqueous chloroauric acid solution in which CTAB was present at a concentration of 2 × 10⁻² M (identical to the CTAB concentration in the foam experiments). Gold ion reduction was carried out using hydrazine vapor (sample 4).2.3 UV-vis spectroscopic studies
The optical properties of the CTAB-capped gold nanoparticle solutions, samples 1–4 were monitored on a Hewlett-Packard diode array spectrophotometer (model HP-8452) operated at a resolution of 2 nm.2.4 X-Ray diffraction measurements
X-Ray diffraction (XRD) analysis of drop-coated films on glass substrates from the CTAB-capped gold nanoparticles in sample 1 was carried out on a Phillips PW 1830 instrument operating at 40 kV and a current of 30 mA with Cu-Kα radiation.2.5 Fourier transform infrared (FTIR) spectroscopy measurements
FTIR spectra were recorded from the drop-coated films of gold nanoparticles in sample 1 deposited on a Si(111) substrate on a Perkin Elmer Spectrum-One Spectrometer operated in the diffuse reflectance mode at a resolution of 4 cm−1. The spectrum of pure CTAB was also recorded for comparison.2.6 Transmission electron microscopy (TEM) measurements
TEM measurements were performed on a JEOL model 1200EX instrument operated at an accelerating voltage at 120 kV. Samples for TEM studies were prepared by placing drops of the gold nanoparticles in samples 1–4 on carbon-coated TEM grids. The films on the TEM grids were allowed to dry for 2 min following which the remaining solution was removed using blotting paper.3. Results and discussion
Fig. 1(A) shows the UV-vis spectra of the CTAB-capped gold nanoparticle solutions from samples 1–4 (corresponding to curves 1, 3, 2 and 4 respectively). The inset of this figure shows pictures of the test tubes (labelled 1–4) corresponding to the gold nanoparticle solutions in samples 1–4 respectively. The red to pink colours observed are characteristic of gold nanoparticles in solution. Strong absorption bands are observed for curves 1, 2 and 4 at ca. 536 nm (samples 1, 3 and 4 respectively), this characteristic resonance corresponding to the excitation of surface plasmon vibrations in the gold nanoparticles. On the other hand, a significantly broadened absorption band is observed at ca. 555 nm for the gold nanoparticles of sample 2 (curve 3). We recollect that the gold nanoparticles in samples 1–3 correspond to the as-prepared CTAB-capped gold nanoparticles in the foam solution, the supernatant of solution 1 after centrifugation and the pellet obtained by centrifugation of solution 1 and redispersion respectively. The different gold nanoparticle solutions were extremely stable over time with no evidence of aggregation of the particles even after weeks of storage. This indicates significant stabilization of the particles, presumably through surface-capping of the gold nanoparticles by CTAB molecules in the foam. The differences in the optical properties of the nanoparticle solutions 1–4 clearly indicate significant variation in either the state of aggregation of the gold nanoparticles or the shape of the nanoparticles. This issue will be addressed during analysis of the TEM micrographs. Fig. 1B shows the XRD pattern recorded from a drop-cast film of the gold nanoparticles in sample 1. A number of strong Bragg reflections can be seen which correspond to the (111), (200), (220), (311) reflections of fcc gold. The XRD results thus show that the gold nanoparticles formed within the foam are crystalline. Similar diffraction patterns were recorded for samples 2, 3 and 4 and have not been shown for brevity.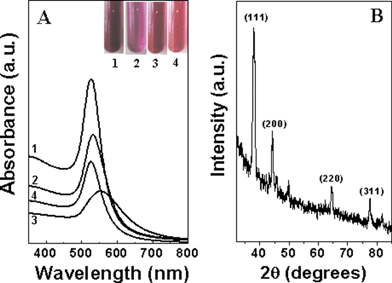 | ||
| Fig. 1 (A) UV-vis spectra of CTAB-capped gold nanoparticle solutions 1–4, corresponding to curves 1, 3, 2 and 4 respectively (see text for details). The inset shows pictures of test tubes of gold nanoparticle solutions in samples 1–4. (B) XRD pattern of a drop-coated film of CTAB-capped gold nanoparticles from sample 1 deposited on a glass substrate. | ||
Fig. 2A shows FTIR spectra of pure CTAB (curve 1) and CTAB-capped gold nanocrystals obtained from sample 1 (curve 2) in the spectral region 2500–3550 cm−1. The C–H symmetric and antisymmetric stretching vibration frequencies at 2850 and 2920 cm−1 are clearly seen for pure CTAB (curve 1) while these absorption bands appear at 2865 and 2944 cm−1 for gold nanocrystals prepared in the foam (sample 1). The presence of the methylene vibrational signatures in the gold nanoparticle sample (curve 2) clearly indicates the presence of CTAB and suggests a mechanism for the stabilization of the gold nanoparticles by a surface-bound layer of CTAB. The shift in the C–H symmetric and antisymmetric stretching vibrations of CTAB bound to the surface of the gold nanoparticles relative to pure CTAB indicates some disorder in the hydrocarbon chains of CTAB on the nanoparticle surface. In addition to the methylene vibration bands, resonances at 3390 cm−1 in curve 1 and at 3176 cm−1 and 3315 cm−1 in curve 2 are also seen in Fig. 2A.33 The broad band at 3390 cm−1 corresponds to N–H stretch vibrations from pure CTAB molecules and after binding to the gold nanoparticles this band is shifted to 3176 cm−1. The band at 3315 cm−1 in curve 2 (CTAB-capped gold nanoparticles) indicates the presence of a bilayer of CTAB on the nanoparticle surface wherein the secondary layer of CTAB exposes ammonium ions to water and stabilizes the particles. The band at 3435 cm−1 in curve 2 corresponds to the O–H stretching frequency of water solvating the surfactant CTAB. Fig. 2B shows the FTIR spectra of pure CTAB (curve 1) and CTAB-capped gold nanocrystals in sample 1 (curve 2) in the spectral region 1300–1700 cm−1. The doublet at 1462 and 1472 cm−1 in curve 1 (for pure CTAB) is attributed to the CH2 scissoring mode of vibration and indicates close-packing of the methylene chains. For the CTAB-capped gold nanocrystals, the splitting between the peaks in the doublet becomes smaller (in curve 2). This is due to loss in crystallinity of the hydrocarbon regions and may be due to the curvature of the nanoparticles. The band at 1600 cm−1 is assigned to the O–H bending mode of water around the bound headgroups. The FTIR data thus clearly indicates that the surfactant CTAB is bound to the gold nanoparticles synthesized in the foam and furthermore, that they stabilize the particles by forming an interdigitated bilayer structure. It is easy to see how such a structure could electrostatically stabilize the gold nanoparticles through exposure of ammonium ions on the surface. Recently, Sastry and co-workers demonstrated the formation of water-dispersible gold nanoparticles capped with surface-bound interdigitated bilayers of CTAB33 and it is likely that the gold nanoparticles of this study have a similar structure.
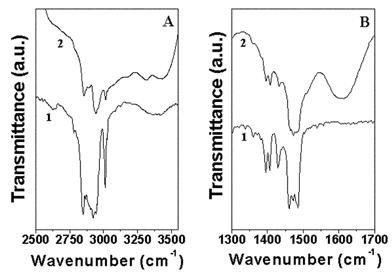 | ||
| Fig. 2 FTIR spectra recorded from drop-coated films of pure CTAB (curve 1) and CTAB-capped gold nanoparticles in sample 1 (curve 2) in the spectral ranges (A) 2500–3550 cm−1 and (B) 1300 –1700 cm−1 respectively. | ||
Figs. 3A and B show representative TEM micrographs recorded at different magnifications from a drop-cast film of CTAB-capped gold nanoparticles in sample 1. Highly anisotropic gold particles are seen that co-exist with a small percentage of nearly spherical particles. Another interesting observation is that the tape-like nanoparticles appear to originate from a flat surface (indicated by an arrow in Fig. 3A). Indeed, a number of flat gold particle assemblies exhibit this peculiar feature. This suggests a templating mechanism for the growth of the gold nanoparticles, a possibility being that the gold ions bind to CTAB monolayers at the bubble surface in the foams where gold nanocrystal nucleation and growth occur. The higher magnification image (Fig. 3B) shows the morphology of one aggregate of tape-like gold nanostructures in greater detail. The widths of the tapes are rather non-uniform and vary from 20–150 nm. An estimate of the thickness of the gold nanostructures could not be made but from the contrast in Fig. 3B, they appear to be thin. The inset in Fig. 3B shows the selected area electron diffraction (SAED) pattern of the gold nanoplates shown in Fig. 3B. The diffraction rings have been indexed in the figure and are clearly due to a face centered cubic (fcc) gold unit cell structure.
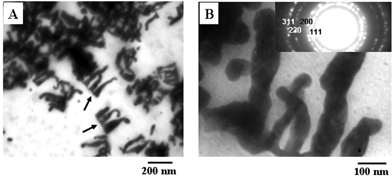 | ||
| Fig. 3 (A) and (B) Representative TEM micrographs recorded at different magnifications of drop-cast films of CTAB-capped gold nanoparticles in sample 1. The inset in (B) shows the selected area electron diffraction (SAED) pattern of the flat-gold nanoplates shown in the figure. | ||
Figs. 4A and B show representative TEM micrographs recorded at different magnification of a drop-cast film of gold nanoparticles in sample 2 (gold nanoparticles in the supernatant obtained by centrifuging the CTAB-capped gold nanoparticle solution formed in the foam). Highly irregular, flat gold nanoplates/flakes can be seen in these TEM micrographs. In comparison with the gold nanostructures of sample 1 (Fig. 3), the gold nanoparticles in the pellet appear to be thinner. The gold nanoflakes vary in size from 20 nm to 90 nm and appear to be made of triangular gold nanostructures. There was no evidence for the presence of spherical gold nanoparticles in this sample indicating that the centrifugation was successful in removing the spherical structures seen in the as-prepared CTAB-capped gold nanoparticles (Fig. 3). The inset in Fig. 4A shows the SAED pattern of the gold nanoflakes shown in Fig. 4. The diffraction rings in the figure are clearly due to a face centered cubic (fcc) gold unit cell structure. Further to the TEM measurements, the broadening of the plasmon resonance band observed in the UV-vis spectrum of the CTAB-capped gold nanoparticle solution 2 (Fig. 1A, curve 3) can be attributed to the flat, anisotropic structure of the nanoparticles and is not due to the aggregation of particles.
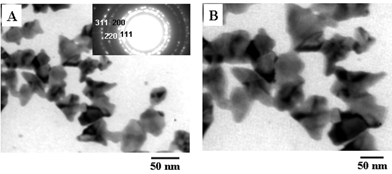 | ||
| Fig. 4 (A) and (B) Representative TEM micrographs recorded at different magnifications of drop-cast films of CTAB-capped gold nanoparticles in sample 2. The inset (A) shows the selected area electron diffraction (SAED) pattern of the gold nanostructures shown in the figure. | ||
Figs. 5A and B show representative TEM micrographs recorded at different magnification of a drop-cast film of CTAB-capped gold nanoparticles in sample 3. Only spherical gold nanoparticles are seen in these TEM micrographs. The spherical particles are fairly uniform and range in size from 8 nm to 70 nm. It is interesting to note that a fairly well-defined inter-particle separation exists in the assemblies and that they are not in direct physical contact. This provides further evidence for a protective CTAB sheath around the gold nanoparticles. Thus, centrifugation leads to the concentration of the relatively heavier spherical gold nanoparticles loosely bound to the nanoflakes/nanoplates in the pellet while the lighter gold nanoflake/nanoplate-like structures remain in the supernatant (Fig. 4).
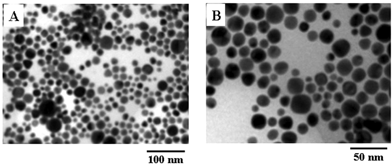 | ||
| Fig. 5 (A) and (B) Representative TEM micrographs recorded at different magnifications of a drop-cast film of gold nanoparticles in sample 3. | ||
Figs. 6A and B show representative TEM micrographs recorded at different magnifications of a drop-cast film of CTAB-capped gold nanoparticles obtained in the control experiment (sample 4). Only spherical gold nanoparticles are seen in these TEM micrographs. The spherical particles vary in size from 10 nm to 60 nm. It is interesting to note that a fairly well-defined inter-particle separation exists in the assemblies and that they are not in direct physical contact. This provides the evidence for a protective CTAB sheath around the gold nanoparticles. The inset in Fig. 6B shows the selected area electron diffraction (SAED) pattern of the gold nanoparticles shown in Fig. 6. The diffraction rings have been indexed in the figure and are clearly due to a face centered cubic (fcc) gold unit cell structure. It is thus clear from the TEM analysis of the gold nanoparticles synthesized in the foam (Figs. 3–5) and those synthesized in solution in the presence of CTAB (Fig. 6) that it is not the surfactant that plays a role in determining the morphology of the nanoparticles. Instead it is the unusual structure of the reaction regions in the foam that causes the interesting morphology variations observed.
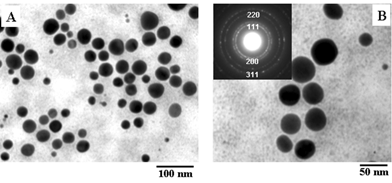 | ||
| Fig. 6 (A) and (B) Representative TEM micrographs recorded at different magnifications of drop-cast films of CTAB-capped gold nanoparticles in sample 4. The inset in Fig. 6B shows the selected area electron diffraction (SAED) pattern of the gold nanostructures shown in the figure. | ||
In Scheme 1 we illustrate a possible mechanism operative in the foam that could explain the differences in morphology of the gold nanoparticles grown. The liquid lamellae between bubbles in the foam may be considered to consist of two Langmuir monolayers of CTAB electrostatically complexed with AuCl−4 ions and therefore, the gold ions amenable to reduction by hydrazine are at the interface only. Region ‘a’ in Scheme 1 shows the liquid lamellae within the plateau borders of the foam wherein the thickness of this region is very small. It is likely that this is the nanoreactor where formation of flat gold nanoplates by hydrazine reduction of AuCl−4 ions occurs. Region ‘b’ shows the junction of four plateau borders where the reaction space for the formation of spherical gold nanoparticles is more extended and more isotropic. We believe the spherical gold nanoparticles form in this region of the foam. Much work is required before a full appreciation of the capabilities of the nanoreactors in foams is achieved. In the control experiment, the AuCl−4 ions were reduced by hydrazine vapors and capped with CTAB directly in bulk solution. TEM pictures of the control experiment show only spherical nanoparticles, with no indication of the presence of gold nanoflakes/nanotapes indicating that the complex geometry of reaction regions in foams as discussed above is crucial in directing the gold nanoparticle morphology variation.
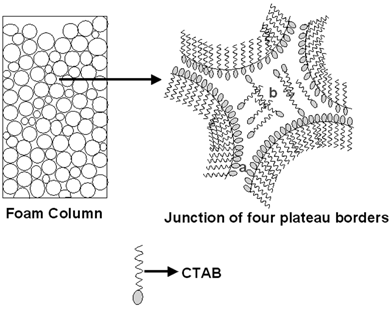 | ||
| Scheme 1 Scheme showing the different regions in the foam believed to be involved in the synthesis of gold nanocrystals of variable shape. The regions ‘a’ and ‘b’ are described in the text in detail. | ||
In conclusion, the formation of gold nanocrystals stabilized by the surfactant cetyltrimethylammonium bromide (CTAB) in liquid foam has been described. The process of ion entrapment in the foam and their reduction results in the formation of gold nanostructures of variable morphology. The gold nanoparticle morphology varies from spherical to flat plates/flakes and simple centrifugation enables separation of the different shapes. This morphology control is believed to occur due to differences in the structure of the foam, which varies from highly anisotropic (liquid lamellae between bubbles) to extended and isotropic (junction between plateau borders). The combination of an extremely large interfacial templating area provided by the liquid lamellae in foams and the dynamic nature of the foam bubbles makes this method potentially exciting for the large-scale synthesis of other inorganic materials (nanomaterials) and minerals which is currently being attempted.
Acknowledgements
SM thanks the University Grants Commission (UGC, Government of India) for a research fellowship. Useful discussions with Dr Bhagavatula Prasad are gratefully acknowledged.References
- P. V. Kamat, J. Phys. Chem. B., 2002, 106, 7729–7744 CrossRef CAS.
- T. Huang and R. W. Murray, J. Phys. Chem. B, 2001, 105, 12498–12502 CrossRef CAS.
- A. P. Alivisatos, Science, 1996, 271, 933–937 CAS.
- A. Y. Cho, J. Cryst. Growth, 1999, 202, 1–7 CrossRef.
- A. Berman, D. J. Ahn, A. Lio, M. Salmeron, A. Reichert and D. Charych, Science, 1995, 269, 515–518 CAS.
- J. T. Hu, T. W. Odom and C. M. Lieber, Acc. Chem. Res., 1999, 32, 435–445 CrossRef CAS.
- M. Li, H. Schnablegger and S. Mann, Nature, 1999, 402, 393–395 CrossRef CAS.
- L. M. Qi, J. M. Ma, H. M. Cheng and Z. G Zhao, J. Phys. Chem. B, 1997, 101, 3460–3463 CrossRef CAS.
- J. Tanori and M. P. Pileni, Langmuir, 1997, 13, 639–646 CrossRef CAS.
- C. C. Chen, C. Y. Chao and Z. H. Lang, Chem. Mater., 2000, 12, 1516–1518 CrossRef CAS.
- S. S. Chang, C. W. Shih, C. D. Chen, W. C. Lai and C. R. C. Wang, Langmuir, 1999, 15, 701–709 CrossRef CAS.
- Y. Y. Yu, S. Chang, C. J. Lee and C. R. C. Wang, J. Phys. Chem. B, 1997, 101, 6661–6664 CrossRef CAS.
- T. S. Ahmadi, J. L. Wang, T. C. Green, A. Henglein and M. A. El-Sayed, Science, 1996, 272, 1924–1925 CrossRef CAS.
- I. Pastoriza-Santos and L. M. Liz-Marzan, Nano Lett., 2002, 2, 903–905 CrossRef.
- M. Maillard, S. Giorgio and M. P. Pileni, J. Phys. Chem. B, 2003, 107, 2466–2470 CrossRef CAS.
- M. Shirai, K. Igeta and M. Arai, Chem. Commun., 2000, 623–624 RSC.
- S.-W. Chung, G Markovich and J. R. Heath, J. Phys. Chem. B, 1998, 102, 6685–6687 CrossRef CAS.
- N. R. Jana, L. Gearhart and C. J. Murphy, Chem. Commun., 2001, 617–618 RSC.
- K. Esumi, K. Matsuhisa and K. Torigoe, Langmuir, 1995, 11, 3285–3287 CrossRef CAS.
- K. R. Brown, D. G. Walter and M. J. Natan, Chem. Mater., 2000, 12, 306–313 CrossRef CAS.
- C. J. Johnson, E. Dujardin, S. A. Davis, C. J. Murphy and S. Mann, J. Mater. Chem., 2002, 12, 1765–1770 RSC.
- X. Peng, L. Manna, W. Yang, J. Wickham, E. Scher, A. Kadanavich and A. P. Alivisatos, Nature, 2000, 404, 59–61 CrossRef CAS.
- S. I. Nikitenko, Y. Koltypin, Y. Mastai, M Koltypin and A. Gedanken, J. Mater. Chem., 2002, 12, 1450–1452 RSC.
- R. Jin, Y. Cao, C. A. Mirkin, K. L. Kelly, G. C. Schatz and J. G. Zheng, Science, 2001, 294, 1901–1903 CrossRef CAS.
- N. Malikova, I. Pastoriza-Santos, M. Schierhorn, N. A. Kotov and L. M. Liz-Marzan, Langmuir, 2002, 18, 3694–3697 CrossRef CAS.
- N. Pinna, K. Weiss, J. Urban and M.-P. Pileni, Adv. Mater., 2001, 13, 261–264 CrossRef CAS.
- B. M. I. van der Zande, M. R. Bohmer, L. G. J. Fokkink and C. Schonenberger, J. Phys. Chem. B, 1997, 101, 852–854 CrossRef CAS.
- S. R. Nicewarner-Pena, R. G. Freeman, B. D. Reiss, L. He, D. J. Pena, I. D. Walton, R. Cromer, C. D. Keating and M. J. Natan, Science, 2001, 294, 137–141 CrossRef CAS.
- C. J. Murphy and N. R. Jana, Adv. Mater., 2002, 14, 80–82 CrossRef CAS.
- Y. G. Sun and Y. N. Xia, Adv. Mater., 2002, 14, 833–837 CrossRef CAS.
- A. Swami, A. Kumar, P R. Selvakannan, S. Mandal, R. Pasricha and M. Sastry, Chem. Mater., 2003, 15, 17–19 CrossRef CAS.
- B.-D. Chen, J. J. Cilliers, R. J. Davey, J. Garside and E. T. Woodburn, J. Am. Chem. Soc., 1998, 120, 1625–1626 CrossRef.
- A. Swami, A. Kumar and M. Sastry, Langmuir, 2003, 19, 1168–1172 CrossRef CAS.
| This journal is © The Royal Society of Chemistry 2004 |
