Structural determination of Li1−yNi0.5Mn0.5O2 (y = 0.5) using a combination of Rietveld analysis and the maximum entropy method
Hironori
Kobayashi
*a,
Yoshinori
Arachi
b,
Hiroyuki
Kageyama
a and
Kuniaki
Tatsumi
a
aSpecial Division of Green Life Technology, National Institute of Advanced Industrial Science and Technology (AIST), 1-8-31 Midorigaoka, Ikeda, Osaka 563-8577, Japan. E-mail: hironori-kobayashi@aist.go.jp; Fax: +81-72-751-9609; Tel: +81-72-751-9649
bUnit of Chemistry, Faculty of Engineering, Kansai University, 3-3-35 Yamate-chuo, Suita, Osaka 564-8680, Japan
First published on 1st December 2003
Abstract
The crystal structures and electron density distributions of the layered oxide Li1−yNi0.5Mn0.5O2 (y = 0.5) were studied using a combination of Rietveld analysis of high-resolution synchrotron powder X-ray diffraction data and the maximum entropy method (MEM). Structural analysis revealed that Li1−yNi0.5Mn0.5O2 (y = 0.5) has the lattice parameters a = 4.934 Å, b = 2.852 Å, c = 5.090 Å, β = 108.8° and adopts the space group C2/m. The chemical formula can be expressed as [Ni0.0815]2a{Li0.5Ni0.0115}4i[Mn0.5Ni0.407□0.093]2dO2. The electron density map obtained using MEM clearly shows that most of the Li ions migrate from the octahedral 2a site to the tetrahedral 4i site during Li de-intercalation.
Recent reports have shown that the layered oxides LiNi0.5Mn0.5O2 and LiCo1/3Ni1/3Mn1/3O2 are promising cathode materials.1–5 Both LiNi0.5Mn0.5O2 and LiCo1/3Ni1/3Mn1/3O2 adopt the rhombohedral structure of LiCoO2 and LiNiO2 and possess reversible capacities of 150 mAh g−1 in the voltage range 2.5 to 4.3 V and of 200 mAh g−1 in the voltage range 2.5 to 4.6 V, respectively. They show the superior characteristics of larger capacities compared to LiMn2O4 and better thermal stability compared to LiNiO2. We have previously studied the structural change of LiNi0.5Mn0.5O2 taking place during the electrochemical de-intercalation process and we have demonstrated that Li1−yNi0.5Mn0.5O2 (y = 0.5) has a monoclinic lattice.6 However, the precise nature of the structural changes taking place in the solid solution Li1−yNi0.5Mn0.5O2 remained unclear. Detailed information on the phase transition of Li1−yNi0.5Mn0.5O2 is very important in order to improve the electrochemical properties of not only this solid solution but also of related materials.
It is well known that the maximum entropy method (MEM) can be used to produce an electron density distribution map from a set of X-ray structure factors without the use of any structural model, and that the MEM map is consistent with the observed structural factors and least biased with respect to unobserved structure factors;7,8 in MEM analysis, any kind of deformation of electron densities is allowed as long as the symmetry requirements are satisfied. Here we report the crystal structures and electron density distributions of the layered oxides Li1−yNi0.5Mn0.5O2 (y = 0 and 0.5), which we have studied using a combination of Rietveld analysis of high-resolution synchrotron powder X-ray diffraction (XRD) data and the MEM.
LiNi0.5Mn0.5O2 was prepared using appropriate molar ratios of LiOH·H2O, Mn(NO3)2·6H2O, and Ni(NO3)2·6H2O.5 Metal oxalate precipitates were obtained by the coprecipitation method, mixing Mn(NO3)2·6H2O and Ni(NO3)2·6H2O with (NH4)2C2O4. The dried precipitates were calcined in air at 873 K for 12 h to convert the metal oxalates to oxides. The resulting oxides were weighed with LiOH·H2O, mixed, pelletized, and fired in air at 1273 K for 12 h. Li1−yNi0.5Mn0.5O2 (y = 0.5) was prepared electrochemically using a coin-type cell comprised of Li/1 M LiPF6 in EC : DEC (1 ∶ 1) solution/LiNi0.5Mn0.5O2 with a BTS2004 (Nagano Co. Ltd.) apparatus.
High-resolution synchrotron XRD data were collected at room temperature using the powder diffractometer on the BL02B2 beamline at SPring-8 with the approval of the Japan Synchrotron Radiation Research Institute (JASRI) (Proposal No. 2002A0370-ND1-np). A large Debye–Scherrer camera with radius 286.5 mm is installed in the experimental hutch and it has an Imaging Plate (IP) on the 2θ–θ arm as a detector. The pixel size of the IP was selected to be 50 µm. The wavelength of the incident synchrotron radiation was fixed at 0.4998 Å. The crystal structure and electron density distributions were studied by Rietveld analysis using the software packages RIETAN20009 and MEED10/PRIMA,11 respectively.
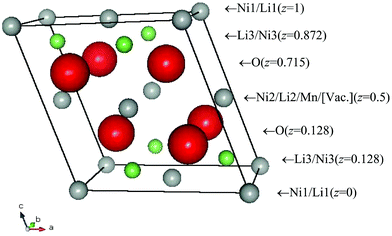
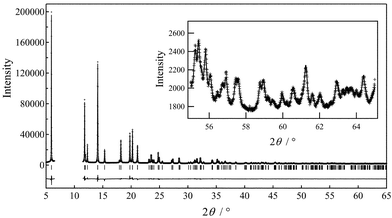
We have previously reported that the structure of Li1−yNi0.5Mn0.5O2 (y = 0.5) has a monoclinic lattice, as determined by electron diffraction patterns observed using high-resolution TEM.6 In the present XRD study, the structural model of Li0.5NiO212 was used as the starting point for refinements. This material adopts the space group C2/m and Li1/Ni1 is situated at 2a(0, 0, 0), Li2/Ni2/Mn at 2d(0, 1/2, 1/2), and O at 4i(x, 0, z) where x ∼ 0.25 and z ∼ 0.75. Firstly, the structural parameters were refined according to this initial model and the MEM electron density map was calculated for 64 × 64 × 64 pixels using the Fo(Rietveld) structure factors obtained from the refinement results. The occupancies of M (M = Ni, Mn, Li) ions at the 2a and 2d sites were fixed to the corresponding values at the 3a and 3b sites of LiNi0.5Mn0.5O2,5 except for the Li1 site where the occupancy was calculated from the lithium content y. The MEM analysis revealed distinct electron density features near the 2a sites, suggesting that a fraction of the Li or Ni ions migrate from the 2a site. Therefore, we added a 4i site for Li3 and Ni3 to the initial structural model, as shown in Fig. 1. The second stage of the procedure was to refine the structural parameters on the basis of this revised model. The occupancy of the 4i Li3/Ni3 site was refined and the sums of the Li1/Li3 and Ni1/Ni3 occupancies were fixed to the values required by the sample stoichiometry. Thirdly, the structural parameters were refined on the basis of the 6Li MAS NMR results for Li1−yNi0.5Mn0.5O2 (y = 0.6),13 which suggested that all the Li ions in the transition metal layers are removed on charging. This refinement yielded a significantly lower R value. Finally, the MEM electron density map was recalculated for 64 × 64 × 64 pixels using the obtained Fo(Rietveld) structure factors and whole-pattern fitting was carried out using the calculated Fc(MEM) data during the final Rietveld refinement. The structural refinement results revealed that the chemical formula of Li1−yNi0.5Mn0.5O2 (y = 0.5) can be represented as [Ni0.0815]2a{Li0.5Ni0.0115}4i[Mn0.5Ni0.407□0.093]2dO2. Fig. 2 shows the observed, calculated and difference diffraction profiles for the Rietveld refinement of Li1−yNi0.5Mn0.5O2 (y = 0.5), and the structural parameters are summarized in Table 1.
 | ||
| Fig. 1 Schematic representation of the structure of Li1−yNi0.5Mn0.5O2 (y = 0.5). | ||
 | ||
| Fig. 2 Observed, calculated and difference diffraction profiles obtained by Rietveld refinement of high-resolution synchrotron powder XRD data. | ||
| Atom | Site | g a | x a | y a | z a | B/Å2a |
|---|---|---|---|---|---|---|
| a Here g is an occupation factor and x, y, and z are fractional coordinates. B means an isotropic atomic displacement parameter. b a = 4.9342(3) Å, b = 2.85220(14) Å, c = 5.09011(15) Å, β = 108.817(5)°, V = 67.807(6) Å3 c R wp = 4.17%, Re = 1.67%, RI = 3.34%, RF = 1.22%. | ||||||
| Ni1 | 2a | 0.0815(2) | 0 | 0 | 0 | = B(Mn) |
| Ni2 | 2d | 0.4069 | 0 | 1/2 | 1/2 | = B(Mn) |
| Mn | 2d | 0.5 | 0 | 1/2 | 1/2 | 0.374(7) |
| Li3 | 4i | 0.25 | 0.378(12) | 0 | 0.1280(16) | = B(Mn) |
| Ni3 | 4i | 0.0058(2) | = x(Li3) | 0 | = z(Li3) | = B(Mn) |
| O | 4i | 1 | 0.2386(15) | 0 | 0.71472(19) | 0.789(18) |
Gummow et al.14 carried out a neutron diffraction study of the low-temperature-synthesised variant of LiCoO2 and the Li-extraction process from this material to form Li0.4CoO2. They proposed a different structural model for Li0.4CoO2, in which most of the Li ions move to the tetrahedral 6c site (0, 0, 3/8) from the octahedral 3a site in the lithium layer. A similar mechanism has been reported when Al and Li ions occupy the 6c interstitial tetrahedral sites in LiAl0.8Co0.2O2 and Li1−yCo0.85Fe0.15O215,16 and when Ir ions occupy the 6c interstitial tetrahedral sites in Li1.8−yIr0.6Fe0.6O2.17 From the viewpoint of monoclinic symmetry, the 4i site in the space group C2/m is equivalent to the 6c site in the space group R![[3 with combining macron]](https://www.rsc.org/images/entities/char_0033_0304.gif) m. In the highly ordered layered Li1−yCoO2 and Li1−yNiO2 systems, no migration of the Li ions from the 3a site to the 6c site has been reported, whereas migration of the Li ions from the 2a site to the 4i site is clearly observed in the present study. These results indicate that disorder of the MO6
(M = transition metal ions) octahedra causes the migration of the Li ions from the octahedral to the tetrahedral site.
m. In the highly ordered layered Li1−yCoO2 and Li1−yNiO2 systems, no migration of the Li ions from the 3a site to the 6c site has been reported, whereas migration of the Li ions from the 2a site to the 4i site is clearly observed in the present study. These results indicate that disorder of the MO6
(M = transition metal ions) octahedra causes the migration of the Li ions from the octahedral to the tetrahedral site.
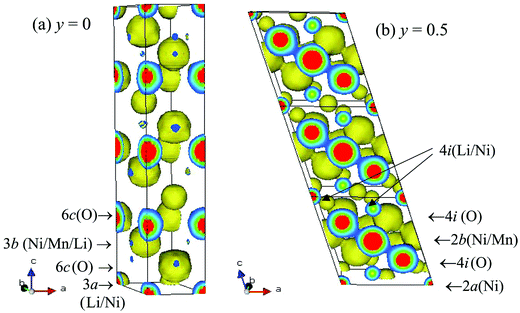
Fig. 3 shows the electron density maps for Li1−yNi0.5Mn0.5O2 (y = 0 and 0.5). No electron density feature near the 6c site was observed for Li1−yNi0.5Mn0.5O2 (y = 0), while it was unmistakeably present around the 4i site in Li1−yNi0.5Mn0.5O2 (y = 0.5). Furthermore, bonding electron density between the 2d and 4i sites was clearly apparent. In the Li-containing layered systems, the cationic distribution of Li ions can usually only be probed using neutron diffraction measurements, due to the negative coherent scattering length (bc(Li) = −0.19 × 10⁻¹² cm) and large scattering factor of Li. However, our results indicate that the electron distribution corresponding mainly to the Li ion is visually observed using the MEM. The detailed structural changes occurring in the Li1−yNi0.5Mn0.5O2 system will be reported in the near future.
 | ||
| Fig. 3 Three-dimensional electron density distribution of Li1−yNi0.5Mn0.5O2 (y = 0 (a) and 0.5 (b)) obtained by the maximum entropy method. Iso-surface density level is equal to 0.5 e Å−3. | ||
In conclusion, the layered oxide Li1−yNi0.5Mn0.5O2 (y = 0.5) was synthesized electrochemically and structural analysis revealed that the chemical formula can be expressed as [Ni0.0815]2a{Li0.5Ni0.0115}4i[Mn0.5Ni0.407□0.093]2dO2. The combination of Rietveld analysis using synchrotron X-ray diffraction data and the MEM is an effective method of investigating the structural changes in this system.
Acknowledgements
The authors would like to thank Mr. Y. Fujii of TOSOH Company for providing the powder samples used in this research. In addition, Fig. 1 and 3 were drawn with the VENUS software developed by Dilanian and Izumi.11Notes and references
- T. Ohzuku and Y. Makimura, Chem. Lett., 2001, 744–745 CrossRef CAS.
- Z. Lu, D. D. MacNeil and J. R. Dahn, Electrochem. Solid State Lett., 2001, 4, A191–A194 CrossRef CAS.
- L. Zhang, H. Noguchi and M. Yoshio, J. Power Sources, 2002, 110, 57–64 CrossRef CAS.
- N. Yabuuchi and T. Ohzuku, J. Power Sources, 2003, 119–121, 171–174 CrossRef CAS.
- H. Kobayashi, H. Sakaebe, H. Kageyama, T. Kuniaki, Y. Arachi and T. Kamiyama, J. Mater. Chem., 2003, 13, 590–595 RSC.
- Y. Arachi, H. Kobayashi, S. Emura, Y. Nakata, M. Tanaka and T. Asai, Chem. Lett., 2003, 32, 60–61 CrossRef CAS.
- M. Sakata and M. Sato, Acta Crystallogr., 1990, A46, 263–270 CrossRef.
- M. Takata, B. Umeda, E. Nishibori, M. Sakata, Y. Saito, M. Ohno and H. Shinohara, Nature, 1995, 377, 46–49 CrossRef CAS.
- F. Izumi, inThe Rietveld Method, ed. R. A. Young, Oxford Univ. Press, Oxford, 1993, ch. 13 Search PubMed.
- S. Kumazawa, Y. Kubota, M. Takata, M. Sakata and Y. Ishibashi, J. Appl. Crystallogr., 1993, 26, 453–457 CrossRef.
- F. Izumi and R. A. Dilanian, Recent Research Developments in Physics, Vol. 3, Transworld Research Network, Trivandrum, 2002, pp. 699–726 (ISBN 81-7895-046-4) Search PubMed.
- A. Hirano, R. Kanno, Y. Kawamoto, Y. Nitta, K. Okamura, T. Kamiyama and F. Izumi, Solid State Ionics, 1995, 78, 123–131 CrossRef CAS.
- W.-S. Yoon, Y. Paik, X.-Q. Yang, M. Balasubramanian, J. McBreen and C.-P. Grey, Electrochem. Solid State Lett., 2002, 5, A263–266 CrossRef CAS.
- R. J. Gummow, M. M. Thackeray, W. I. F. David and S. Hull, Mater. Res. Bull., 1992, 27, 327–337 CrossRef CAS.
- R. Alcántara, P. Lavela, P. L. Relaño, J. L. Tirado, E. Zhecheva and R. Stoyanova, Inorg. Chem., 1998, 37, 264–269 CrossRef CAS.
- H. Kobayashi, H. Shigemura, M. Tabuchi, H. Sakaebe, K. Ado, H. Kageyama, A. Hirano, R. Kanno, M. Wakita, S. Morimoto and A. Nasu, J. Electrochem. Soc., 2000, 147, 960–969 CrossRef CAS.
- H. Kobayashi, Y. Uebou, M. Tabuchi, H. Kageyama, Y. Yamamoto, M. Matsuoka and J. Tamaki, J. Electrochem. Soc., 2003, 150, A1408–A1415 CrossRef CAS.
| This journal is © The Royal Society of Chemistry 2004 |
