Characterization of metal complexes with metallothioneins in the liver of the carp Cyprinus carpio by reversed-phase HPLC with ICP-MS and electrospray ionization (ESI)-MS
Heidi Goenaga Infantea, Filip Cuyckensb, Karen Van Campenhoutc, Ronny Blustc, Magda Claeysb, Luc Van Vaecka and Freddy C. Adams*a
aUniversity of Antwerp (UA), Micro and Trace Analysis Centre, Universiteitsplein 1, B–2610 Wilrijk, Belgium. E-mail: adams@uia.ua.ac.be
bUniversity of Antwerp (UA), Department of Pharmaceutical Sciences, Universiteitsplein 1, B–2610 Wilrijk, Belgium
cUniversity of Antwerp (UA), Department of Biology, Groenenborgerlaan 171, B-2020 Antwerp, Belgium
First published on 26th September 2003
Abstract
Inductively coupled plasma time-of-flight mass spectrometry (ICP-TOFMS) and electrospray ionization mass spectrometry (ESI-MS) were used in parallel in combination with two-dimensional chromatography (size-exclusion followed by reversed-phase HPLC) for the characterization of metal complexes with metallothionein (MT) isoforms in hepatic cytosols of Cd exposed carp. The cytosolic MT fraction was partially purified by size-exclusion (SE) HPLC, preconcentrated and de-salted by centrifugal microfiltration. The separation of the metal complexes with MT isoforms was performed by reversed-phase (RP) HPLC using a gradient up to 30% methanol in acetate buffer (pH 7.4). Two major and several minor chromatographic peaks were distinguished by RP-HPLC-ICP-TOFMS within a chromatographic run of 20 min. Applying ESI-MS as a detector for RP HPLC allowed the identification of the two major signals detected by ICP-MS on the basis of the molecular mass determined on-line for the metallocomplex(es) and for the ligand. Mass spectra taken at the peak apices indicated the co-elution of different metal (Cd, Cu, Zn and Pb) complexes with MT isoforms within each peak. A simple “in-source” protein oxidation procedure was used to obtain the ligand of the complexes (oxidized form) on arrival at the detector; direct information was obtained on the molecular mass of two MT isoforms in carp liver, allowing their identification. The efficiency and robustness of this method were demonstrated using a rabbit liver MT1 standard as test sample.
Introduction
The development of analytical approaches to studying the bioavailability and the environmental impact of metal(loids) on living organisms offers a continuing challenge for environmental analytical chemistry and eco- and clinical toxicology. To elucidate the mechanisms that control the uptake of metal(loids) by organisms exposed to environmental metal pollution as well as metal transport, metabolism and detoxification processes, reliable information is needed about trace-element speciation of biomolecules with specific functions in the cell. New analytical methodologies for detection, quantitation, identification and characterization of metal(loids) complexed with or incorporated into biomolecules are therefore required.1–3Metallothioneins (MT) are low-molecular weight proteins capable of binding trace metals in the cells of a wide range of prokaryotes and eukaryotes, including plants, invertebrates and vertebrates. Environmental studies involving metallothioneins in aquatic organisms show the potential use of these biomolecules as specific biomarkers of trace metal exposure.4–9 The affinity of MT for heavy metals such as Zn, Cd, Hg, Pb and Cu, and their capacity for bioaccumulation in aquatic organisms, is well known. The exposure of aquatic organisms to excess essential and non-essential metals induces MT expression in different species and tissues. The additional fact that MT are intrinsic to most species makes them a possible candidate to serve as an indicator of environmental exposure to metals and also as a biomarker of metal pollution.4
Most fish populations are considered less suitable candidates as bioindicators of environmental contamination gradients than many invertebrates because of their mobility and the strong influence of other conditions (e.g., water temperature and pH) besides metals, that could potentially result in MT induction in fish. However, the benefits of increased sensitivity and more readily measured responses to metals, in fish, outweigh these features.7
The number of investigations on the applicability of MT induction in fish species to assess the environmental toxicity of metals has aroused increasing interest in ecotoxicology and environmental monitoring during the last 10 years.5,7,11,12 Ideally, information about indicator species could be used to assess adverse effects on the species themselves, on other components of the ecosystem and on humans. Unfortunately, the information on multi-element metal speciation of MT and MT isoform composition in fish is still scarce, limiting the study of the function and metal binding capacity of the different MT isoforms.
The on-line coupling of size-exclusion liquid chromatography with inductively coupled plasma mass spectrometry (ICP-MS) for real-time element-specific detection of different molecular weight fractions in animal cytosols, together with further fractionation/purification of the MT fraction by complementary separation techniques (anion-exchange, reversed-phase (RP) HPLC or capillary electrophoresis (CE)), coupled with ICP-MS, has become a popular approach to detect and verify the chromatographic purity of MT species.1,10,13–15 On-line isotope dilution in combination with the hyphenation of CE or reversed phase HPLC to ICP-MS has proved to be a reliable method for quantitative metal speciation of rat liver and standard rabbit liver MT isoforms.15–17 Quantification of MT via sulfur measurements is possible with this approach when using ICP-sector field (SF) MS instruments.15,16 Identification and characterization of the metal complexes with MT isoforms detected by ICP-MS have been mostly performed by using electrospray ionization mass spectrometry (ESI-MS) as a molecule-specific detector for chromatography (CE or reversed-phase HPLC).15,18–21
Most research on the characterization of MT polymorphism has been devoted to MT standard preparations and mammalian cytosols for which standards of MT are commercially available. Despite several works using the powerful combination of element- and molecule-specific MS detectors with chromatography for investigations of MT and its isoforms in mammals, the characterization of MT isoforms in fish remains a challenging issue. The characterization of MT isoforms is a difficult task because of (i) problems regarding the conservation of MT expression and the purification of this metalloprotein in the presence of other metal-binding ligands, and (ii) the possible influence of biotic and abiotic factors that are likely to interfere with MT synthesis in fish in response to metal exposure which should be controlled. Moreover, the amount of sample obtained from target organs in fish is often very limited in comparison to mammals. Therefore, a larger preconcentration than in the latter case may be required to prepare fish samples for LC-ESI-MS analysis.
In this paper the complementarity of ICP-time-of-flight (TOF)MS and ESI-MS combined with two-dimensional chromatography (size-exclusion followed by reversed-phase HPLC) is investigated for the characterization of metal complexes with MT isoforms in hepatic cytosols of carp exposed to waterborne Cd. The investigation of the origin of signals in chromatograms of fish cytosols (containing Cd, Zn, Cu and Pb) obtained by LC-ICP-MS was for the first time attempted using complementary ESI-MS detection. A simple “in-source” oxidation procedure using a Cs-coated electrospray capillary allowed the ligand of the complexes (the oxidized form) to be obtained on arrival at the detector. The efficiency and robustness of this approach were tested through the identification of metal complexes with MT1 standard from rabbit liver.
Experimental
Instrumentation
HPLC was performed with a Shimadzu (Kyoto, Japan) PEEK solvent delivery module LC-10Ai equipped with a FCV-10AL quaternary valve and a Rheodyne Model 7125 PEEK sample injector (Rohnert Park, CA, USA) fitted with a 50 µl eluent loop. Size-exclusion HPLC was performed with a SUPELCO (Bornem, Belgium) TSK gel G 3000 PWxL gel-filtration column (7.8 mm id × 30 cm, 6 µm particle size). Reversed-phase HPLC was performed with a Spherisorb ODS 2 column (250 mm × 4.6 mm, 5 µm particle size: type PEEK) (Alltech, Lokeren, Belgium). The reversed-phase HPLC column was directly connected to the nebulizer of the ICP-MS instrument via PEEK tubing (0.5 mm id × 7 cm). The effluent of the RP HPLC column (0.6 ml min−1) was split by a laboratory-made splitter (split ratio 1 ∶ 50) and fed into the electrospray source.ESI-MS experiments were performed using an Autospec-oa-TOF mass spectrometer (Micromass, Manchester, UK) of SF/TOF configuration, equipped with an ESI source. For direct analysis, analyte solutions were introduced into the source by means of a 100 µl syringe (Hamilton, Reno, NV, USA) and a Harvard Apparatus (South Natick, MA, USA) Model 22 syringe infusion pump at a constant flow rate of 5 µl min−1. Data acquisition and processing were performed using OPUS V3.6X Software (Micromass).
An axial ICP-TOFMS (Renaissance, LECO, St. Joseph, MI, USA), fitted with a Meinhard nebulizer, was used as the element-specific detector. The optimal ICP-TOFMS, ESI-MS and chromatographic separation conditions are summarized in Table 1.
| Element-specific detection— | |
| Leco Renaissance ICP-TOFMS | |
| Rf power: 1.45 kW | |
| Rf frequency: 40.68 MHz | |
| Spectral frequency: 20 kHz | |
| Integration time: 0.5 s | |
| Scanning mode: peak transient | |
| Isotopes: 63Cu, 64Zn, 65Cu, 66Zn, 111Cd, 114Cd, 208Pb | |
| Molecule-specific detection— | |
| Micromass Autospec ESI SF-TOFMS | |
| Accelerating voltage: 4 kV | |
| Bath gas (N2) flow rate: 250 l h−1 | |
| Nebuliser gas (N2) flow rate: 15 l h−1 | |
| Mass range (m/z): 800–1800 | |
| Split ratio: 1 ∶ 50 | |
| Scan speed: 1 decade s−1 | |
| Chromatographic conditions— | |
| Shimadzu LC-10Ai PEEK HPLC system with FCV-10AL quaternary valve | |
| Analytical column: Spherisorb ODS 2 (250 mm × 4.6 mm, 5 µm: type: PEEK) | |
| Injection loop: 50 µl | |
| Flow rate: 0.6 ml min−1 | |
| Mobile phase: concentration gradient methanol (pH 7.4) | |
| A: 30 mmol l−1 NH4Ac in 1% (v/v) methanol | |
| B: 30 mmol l−1 NH4Ac in methanol | |
| Time/min | Buffer B (%) |
| 0 | 0 |
| 15 | 30 |
| 25 | 30 |
| 30 | 0 |
Microcon centrifugal filters (3000 Da membranes) (Millipore, Brussels, Belgium) and an Eppendorf centrifuge Model 5804 R (VWR International, Leuven, Belgium) were used for sample preconcentration and desalting.
The instrumentation for preparation of cytosols was as described in a previous paper.10
Reagents and standards
Methanol (Merck, Darmstadt, Germany) was of LC gradient grade. Doubly de-ionized water (18.2 MΩ cm) obtained from a Milli-Q water system (Millipore, Bedford, MA, USA) was used throughout. All the reagents used were of the highest available purity.Metallothionein 1 (80K7012) and metallothionein 2 (052K7002) preparations (isolated from rabbit liver and essentially salt-free; Cd content 7.9 and 6.5%; Zn content 1.4 and 1.6%) were purchased from Sigma (St. Louis, MO, USA). The sample vial contents were dissolved in ultra-pure water (to prepare 1 mg ml−1 MT solution), kept in a refrigerator at 4 °C and filtered using 0.45 µm cellulose acetate syringe filters (Alltech) just before use. Ammonium acetate, used for preparation of the mobile phase, and phenylmethanesulfonylfluoride (PMSF; protease inhibitor) and 2-mercaptoethanol (antioxidant), used for preparation of cytosols, were purchased from Sigma.
The buffer solution was prepared by dissolving 30 mmol l−1 of ammonium acetate in water containing 1% (v/v) methanol (buffer A) and in methanol (buffer B), adjusting the pH to 7.4 with concentrated ammonia and acetic acid and degassing with helium for 20 min before use. Suprapur acetic acid (100% m/m) and ammonia (25% m/m) used for pH adjustment of the mobile phases were purchased from Merck.
A 0.1% (v/v) trifluoroacetic acid (TFA) solution, used for obtaining the apo-MT by off-line acidification, was prepared by dissolving concentrated TFA (Spectroscopy grade, Uvasol, Merck) in water–methanol (1 + 1, v/v).
For mass calibration of the ESI-MS instrument and for “in-source” oxidation of the MT species, a 10 mg l−1 caesium iodide (CsI) solution was prepared by dissolving an appropriate aliquot of CsI (Merck) in water–methanol (1 + 1, v/v).
For the daily optimization of the ICP and TOFMS parameters a mass calibration solution of 100 µg l−1 Li, Mg, Sc, Co, Y, In, Ce, Ba, Pb, Bi and U, prepared from a 1000 mg l−1 multielement stock standard solution (Z-TEK, Amsterdam, The Netherlands), was used.
Procedures
500 µl of the MT cytosolic fraction (isolated by SE HPLC) were pipetted into the sample reservoir (containing a 3000 Da membrane) of a Microcon centrifugal filter device. The reservoir, inserted into a vial, was sealed with a cap and the assembly was then centrifuged at 13![[hair space]](https://www.rsc.org/images/entities/char_200a.gif) 000 g for 60 min at 4 °C. With the reservoir placed upside down in a new vial, centrifugation at 100 g for 5 min at 4 °C was performed to transfer the concentrate to the vial. Different concentrates were pooled and the centrifugal filtration procedure was repeated to achieve a maximum of 20-fold sample preconcentration.
000 g for 60 min at 4 °C. With the reservoir placed upside down in a new vial, centrifugation at 100 g for 5 min at 4 °C was performed to transfer the concentrate to the vial. Different concentrates were pooled and the centrifugal filtration procedure was repeated to achieve a maximum of 20-fold sample preconcentration.
RP HPLC-ESI-MS analysis
For analysis of both the metallated isoforms and the oxidized MT, 50 µl of the concentrate were injected and the separation and elution of the MT fractions was achieved by using a concentration gradient (1–30%) of methanol within 20 min (see conditions in Table 1). A m/z range of 800–1800 was scanned, which allowed the observation of the +4 and +5 ionization states. Mass spectra were acquired with an accelerating voltage of 4000 V, a cone voltage of 40 V and using the magnetic sector at a scan speed of 1 decade s−1. Nitrogen was used as bath gas (flow 250 l h−1) and as nebulizer gas (flow 15 l h−1). After analysis, buffer A was switched off for 20 min in order to re-equilibrate the column and the ESI source was rinsed with a water–methanol (1 + 1, v/v) solution before the next injection.
Results and discussion
The common carp (Cyprinus carpio) was chosen as the test organism because of its abundance and wide distribution in Europe and its economic importance. Furthermore, the common carp has been approved as a test organism by the Environmental Protection Agency (EPA), allowing the use of this fish species as “sentinel” organisms in monitoring programs.The toxic metal cadmium, which has been recognized as one of the most deleterious heavy metals, has proved to be one of the most potent MT inducers in carp. Previous investigations of the importance of MT in the detoxification of Cd in common carp (Cyprinus carpio) after waterborne Cd exposure have demonstrated that the role of this protein in the detoxification process is clearly both organ- and isoform-specific.10,22 Quantitative and qualitative speciation differences that were encountered between control and Cd exposed fish and the correlation of the speciation data with (i) MT concentrations in tissue and (ii) total Cd concentrations in water and tissue led to the conclusion that kidney is a more important organ than liver to be studied when using MT de novo synthesis in carp as an indicator of Cd exposure; the concentration of Cd bound to MT increases earlier in kidney than in the liver.5,10,22 However, the induction of MT–metal complexes occurs at a significantly higher level in liver (after short-term exposure to 1 mg l−1 Cd) since this organ is more capable of sequestering the incoming Cd to MT than the kidney.
The full elucidation of the role that this metal-complexing metabolite plays in the cell requires, however, the identification of the MT isoforms that are specifically induced in carp tissue owing to metal stress. In this paper, identification of metal complexes with MT in hepatic cytosols of carp exposed to waterborne Cd was for the first time attempted using the combination of reversed-phase HPLC in parallel with ICP-TOFMS and ESI-MS. Previous size-exclusion HPLC-ICP-TOFMS analysis of control fish cytosols allowed checking for non-induced Cd–MT levels in liver; a very small amount of Cd appears to be associated to the MT fraction of control cytosols as found elsewhere.10 The analysis of kidney concentrates by RP HPLC-ESI-MS was not undertaken due to the lack of sensitivity for detection of the metallofractions. The significantly lower concentration of MT in kidney compared with liver along with the poorer sensitivity of ESI-MS in comparison with ICP-MS did not allow the identification of MT–metal complexes in carp kidney.
RP HPLC-ICP-TOFMS of carp liver MT
MT cytosolic samples of 50 µl were chromatographed immediately after being isolated by SE-HPLC and preconcentrated and desalted by centrifugal microfiltration. To find compatibility between the ICP-TOFMS and the ESI-MS as detection systems, the conditions for separation and elution of the MT fractions were selected as summarized in Table 1.The effect of the pH of the mobile phases on the retention time of the MT isoforms was investigated at varying pH values between 6.0 and 7.4. This pH interval was selected to avoid possible changes of in vivo species of Cd and Zn by dissociation of these metals from the MT–metal complexes.14,19–21 A dependence of the solutes’ retention times on the pH of the mobile phases was observed: an increase in the pH resulted in a decrease in the retention times of the MT fractions. Higher pH values than 7.4 were not tried following instructions for the use of the column as given by the manufacturer. A physiological pH of 7.4 was finally selected for their speciation.
The use of ammonium acetate and Tris–HCl buffers both with buffering capacity in the pH range studied led to similar ICP-TOFMS metal profiles for the liver samples under similar chromatographic conditions. However, ammonium acetate buffer was preferred because of its higher compatibility with electrospray ionization. Concentrations of methanol of up to 30% (v/v) were well tolerated by the ICP-TOFMS system with no significant changes in sensitivity or occurrence of serious plasma instability. This was achieved after a careful optimization of the ICP parameters (e.g., using a high Rf power as shown in Table 1) without need for a cooled spray chamber or addition of oxygen to the auxiliary gas.
We investigated Cd, Zn, Cu and Pb profiles by RP HPLC-ICP-TOFMS for carp liver MT under different elution gradients. Fig. 1 shows the presence of two major and several minor chromatographic peaks separated within a chromatographic run of 20 min under the conditions given in Table 1. The two main species with retention times of 14.4 min (peak 1) and 16.6 min (peak 2) apparently contain the four metals as indicated by the simultaneous mass spectra obtained with the ICP-TOFMS instrument. The Pb elution profile clearly shows that only a very small amount of Pb appears to be associated to these fractions in comparison with the Zn, Cd and Cu profiles. The next step is the identification of these ICP-MS signals. For this purpose, application of electrospray ionization MS as detector for RP HPLC was addressed.
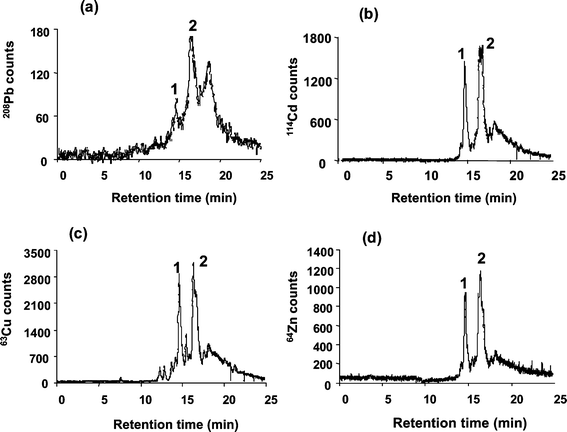 | ||
| Fig. 1 Elution profiles of Pb (a), Cd (b), Cu (c) and Zn (d) by RP HPLC-ICP-TOFMS for the liver cytosol of carp exposed to Cd. | ||
Identification of the HPLC-ICP-MS signals using ESI-MS detection
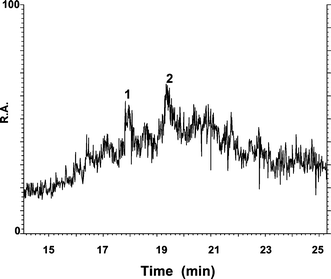 | ||
| Fig. 2 Total ion current (TIC) obtained by RP HPLC-ESI-MS for metal–MT complexes of carp liver (pH 7.4). R.A: relative abundance. | ||
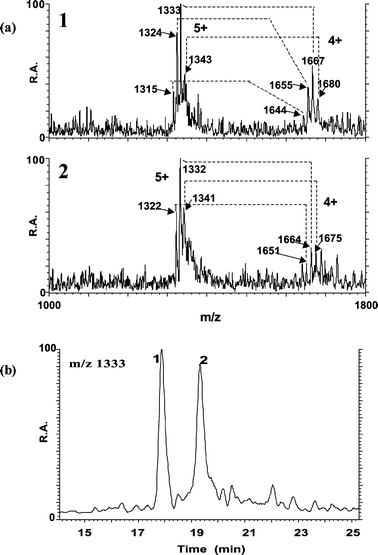 | ||
| Fig. 3 Analysis of carp liver MT complexes by RP HPLC-ESI-MS. ESI mass spectra taken at the apices of peaks 1 and 2 (as detected by ICP-MS) (a) and mass chromatogram of the ion at m/z 1333 (b). | ||
The three signal pairs at m/z (1324, 1655), (1333, 1667) and (1343, 1680) present in the mass spectrum of peak 1 and those indicated for peak 2 (Fig. 3(a)) show a mass difference between two consecutive peaks within each charge state envelope that likely originates from the substitution of one Cu or Zn atom by Cd. Note that it is difficult to distinguish between Cu and Zn because their atomic masses are very similar and the ESI (SF)MS instrument is operated at low resolution to increase sensitivity. Assumptions on the identification of these mixed metal complexes cannot be based exclusively on the mass spectra obtained since no data on the molecular masses of the common carp hepatic MT isoforms (e.g., masses of apo–MT and metal–MT complexes calculated according to the sequence) were previously reported. Besides, preliminary information on the molecular mass of the apo-forms by direct ESI-MS analysis (after acidification off-line with 0.1% TFA) could not be obtained due to the lack of sensitivity which makes it difficult to differentiate their signal from the noise along with the insufficient resolution of the mass spectra and the presence of impurities. Previous work has shown that the stoichiometry of mixed metal complexes may be elucidated with repeated analyses at varying pH values; unfortunately, we had insufficient sample to attempt such analyses.20
Proof of direct correlation of the molecular mass of the complex and the molecular mass of the demetallated isoform obtained for independent chromatographic signals has been used by other authors for identification of mammalian MT–metal complexes of ambiguous stoichiometry.19–21 The on-line molecular mass determination of the demetallated MT isoforms was then attempted.
Following these previous studies, demetallation of MT–metal complexes with rabbit liver MT1 by post-column acidification was first investigated by mixing a flow of a TFA solution at 0.1 ml min−1 with the HPLC effluent (flow 0.8 ml min−1) via a zero-dead-volume T-piece (PEEK, Alltech). A PEEK mixing coil (250 mm × 250 µm id) was placed behind the T-piece and the pH of the solution was measured to guarantee a final value of 1.9. As a result, Cd4–MT complexes were still detected by ESI-MS, pointing to a low efficiency of post-column formation of the apo-form. The acidic solution-to-eluate flow ratio is similar to that used in previous studies but, in this work, the efficiency of the demetallation process is probably affected by the shorter time and lower velocity of mixing (due to a 15-fold higher HPLC flow rate). After this result, all efforts were directed to finding an alternative method that allows an efficient on-line demetallation of MT without affecting the conformation of the ligand.
“In-source” oxidation of MT. The thiol groups of MT, normally involved in metal binding, are highly reactive and render the protein particularly sensitive to oxidation. Oxidation of MT (by formation of disulfide bonds) may also allow the determination of the molecular mass of the demetallated MT isoforms by ESI-MS, subject to retaining the conformation of the ligand. However, no data on the identification of demetallated MT isoforms based on protein oxidation procedures were previously reported.
Direct analysis of rabbit liver MT2. After introduction of a 10 mg l−1 CsI solution into the electrospray source and rinsing the system with water–methanol (1 + 1, v/v) as described in procedures, a 0.1 mg ml−1 MT2 standard solution (pH 6.0) was fed into the ESI-MS instrument by direct infusion. The mass spectrum obtained under the conditions of Table 1 is shown in Fig. 4(a).
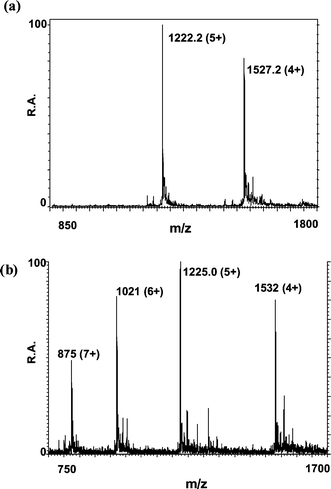 | ||
| Fig. 4 ESI mass spectra obtained for a rabbit liver MT2 standard introduced by direct infusion after (a) oxidation with Cs and (b) acidification with 0.1% TFA dissolved in 30% aqueous methanol (pH 1.9). | ||
Fig. 4(b) shows the mass spectrum of the apo-MT2 obtained by acidification off-line with 0.1% (v/v) TFA dissolved in methanol–water (30 + 70, v/v). Prior to analysis of the apo-form the system was checked for the presence of remaining Cs and all precautions were taken to avoid it. This mass spectrum shows many similarities with those obtained for apo-MT2 in previous studies.23,24
The signals at m/z 1222.2 (for the 5+ ionization state) and m/z 1527.2 (for the 4+ ionization state) in Fig. 4(a) do not correspond with those of the apo-form (Fig. 4(b)) but with those of the oxidised MT2. The apo-form for a Cd7–MT is formed by substitution of the divalent metal atom by two protons. Based on this knowledge, and in order to further verify results, the difference in terms of m/z for the 5+ ionization state between the two mass spectra was calculated (m/z 1225.0 − 1222.2 = m/z 2.8). The resultant m/z 2.8 corresponds with that calculated for 14 protons that substitute 7 divalent metal atoms (14 H/5 = 2.8). This result suggests that the oxidation of MT that involves formation of disulfide bonds is favoured by the presence of CsI in the system.
Research has been devoted to studying the electron acceptor properties of Cs coatings. The capabilities of Cs films coating different surfaces (including metals) for taking up electrons regardless of the electron donor and for electron exchange with the local surface area have been demonstrated previously.25,26 This effect certainly favours the oxidation of the electron donor. It could, in principle, be assumed that the contact of the MT solution with the Cs-coated electrospray capillary is responsible for MT oxidation. Other possibilities of how the Cs adsorbed on the capillary could influence the analyte in the sprayed solution were pointed out by Cech and Enke.27 For instance, the electrochemical oxidation/reduction processes at the conductive electrospray probe tip can provide an alternative explanation for our observations. Further studies should be pursued to elucidate the mechanisms that control the overall oxidation process.
The efficiency and robustness of the “in-source” oxidation method were tested through the identification of metal complexes with MT1 standard from rabbit liver before analyzing carp liver.
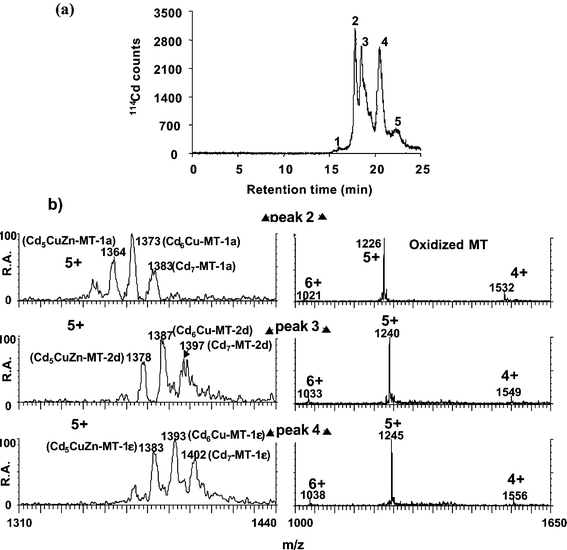 | ||
| Fig. 5 RP HPLC-ICP-TOFMS (a) and RP HPLC-ESI-MS (b) analysis of rabbit liver MT1. The ES mass spectra were taken at the apices of the peaks 2, 3 and 4 (detected by ICP-MS) for the metal–MT complexes (pH 7.4) and for the "in-source" oxidized MT isoforms. | ||
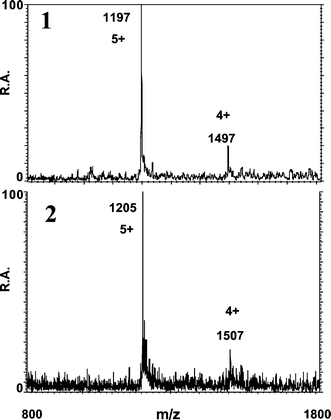 | ||
| Fig. 6 ESI mass spectra taken at the apices of peaks 1 (1) and 2 (2) observed for oxidized MT isoforms of carp liver. | ||
| Peak number | m/z (+5 state) | m/z (+4 state) | Molecular mass/Da | Identificationa |
|---|---|---|---|---|
| a CL: carp liver MT. | ||||
| 1 | 1315 | 1644 | 6575.5 ± 0.5 | Cd3Cu3Zn–CL |
| 1324 | 1655 | 6620.0 ± 0.2 | Cd2Cu2ZnPb–CL | |
| 1333 | 1667 | 6666.5 ± 1.5 | Cd3CuZnPb–CL | |
| 1343 | 1680 | 6718.0 ± 1.9 | Cd4ZnPb–CL | |
| 2 | 1322 | 1651 | 6608 ± 2 | Cd3Cu3Zn–CL |
| 1332 | 1664 | 6658.5 ± 1.5 | Cd4Cu3–CL | |
| 1341 | 1675 | 6702.5 ± 0.5 | Cd5Cu2–CL | |
To the best of our knowledge, Pb was found here for the first time associated with MT isoforms in animal cytosols. Although traces of Pb associated with peak 2 were found by ICP-TOFMS, the electrospray results did not allow the identification of complexes of Pb other than the compounds present in peak 1.
Conclusions
The use of two-dimensional chromatography (size-exclusion followed by reversed phase HPLC) with parallel detection by ICP-MS and ESI-MS is an attractive approach for preliminary identification of metal complexes with MT isoforms induced in fish tissue owing to metal stress.An efficient, robust and simple “in-source” oxidation method in combination with RP HPLC-ESI-MS permits one to obtain information on the molecular mass of the ligand (oxidized form) without post-column sample dilution and formation of artefacts that frequently occur due to the existence of several mixed metallocomplexes of the same isoform. Using this method, direct information is, for the first time, obtained on the molecular mass of two MT isoforms in carp liver, allowing their identification. Further studies should be pursued to elucidate the mechanism of the “in-source” oxidation observed for MT.
The mass difference between co-eluted MT complexes with MT isoforms, pointing to the substitution of one Cu or Zn atom by Cd, is indicative of the significant role that MT in hepatic carp cytosols play in Cd sequestration after short term exposure to high levels of this toxic metal (1 mg l−1 Cd) in water. Distinction between Cu and Zn, both present in the complexes detected, could not be accomplished. It would require a higher accuracy and sensitivity in the molecular mass measurement by ESI-MS, achieved by using, for example, a TOF mass analyzer.
Acknowledgements
This work is financially supported by the FWO-Flanders/Brussels, Belgium. F. Cuyckens thanks the Vlaams Instituut voor de Bevordering van het Wetenschappelijk-Technologisch Onderzoek in de Industrie (IWT) for a doctoral fellowship. K. Van Campenhout thanks the FWO-Flanders for a doctoral grant.References
- J. Szpunar and R. Lobinski, Anal. Bioanal. Chem., 2002, 373, 404–411 CrossRef CAS.
- C. N. Ferrarelo, M. R. Fernández de la Campa and A. Sanz-Medel, Anal. Bioanal. Chem., 2002, 373, 412–421 CrossRef CAS.
- M. B. de la Calle Guntiñas, G. Bordin and A. R. Rodríguez, Anal. Bioanal. Chem., 2002, 374, 369–378 CrossRef CAS.
- M. Dabrio, A. R. Rodríguez, G. Bordin, M. J. Bebianno, M. De Ley, I. Šestáková, M. Vašák and M. Nordberg, J. Inorg. Biochem., 2002, 88, 123–134 CrossRef CAS.
- H. Goenaga Infante, K. Van Campenhout, D. Schaumlöffel, R. Blust and F. C. Adams, Analyst, 2003, 128, 651–657 RSC (special issue).
- K. A. High, V. J. Barthet, J. W. McLaren and J. S. Blais, Environ. Toxicol. Chem., 1997, 16, 1111–1118 CAS.
- W. J. Langston, B. S. Chesman, G. R. Burt, N. D. Pope and J. McEvoy, Mar. Environ. Res., 2002, 53, 263–293 CrossRef CAS.
- C. N. Ferrarelo, M. R. Fernández de la Campa, J. F. Carrasco and A. Sanz-Medel, Anal. Chem., 2000, 72, 5874–5880 CrossRef.
- W. J. Langston, M. J. Bebianno and G. Burt, Metal Metabolism in Aquatic Environments, eds. W. J. Langston and M. J. Bebianno, Chapman and Hall, London, 1998, 219–284 Search PubMed.
- H. Goenaga Infante, K. Van Campenhout, R. Blust and F. C. Adams, J. Anal. At. Spectrom., 2002, 17, 79–87 RSC.
- N. Muto, H. W. Ren, G. S. Hwang, S. Tominaga, N. Itoh and K. Tanaka, Comp. Biochem. Physiol. C, 1999, 122, 75–82 Search PubMed.
- H. W. Ren, N. Itoh, M. Kanekiyo, S. Tominaga, J. Kohroki, G. S. Hwang, T. Nakanishi, N. Muto and K. Tanaka, Biol. Pharm. Bull., 2000, 23, 145–148 Search PubMed.
- V. Nischwitz, B. Michalke and A. Kettrup, Anal. Bioanal. Chem., 2003, 375, 145–156 CAS.
- A. Prange and D. Schaumlöffel, Anal. Bioanal. Chem., 2002, 373, 441–453 CrossRef CAS.
- K. Polec, M. Perez-Calvo, O. Garcia-Arribas, J. Szpunar, B. Ribas-Ozonas and R. Lobinski, J. Inorg. Biochem., 2002, 88, 197–206 CrossRef CAS.
- D. Schaumlöffel, A. Prange, G. Marx, K. G. Heumann and P. Brätter, Anal. Bioanal. Chem., 2002, 372, 155–163 CrossRef CAS.
- C. N. Ferrarelo, J. Ruiz Encinar, G. Centineo, J. I. García Alonso, M. R. Fernández de la Campa and A. Sanz-Medel, J. Anal. At. Spectrom., 2002, 17, 1024–1029 RSC.
- X. Yu, M. Wojciechowski and C. Fenselau, Anal. Chem., 1993, 65, 1355–1359 CrossRef CAS.
- H. Chassaigne and R. Lobinski, Analyst, 1998, 123, 2125–2130 RSC.
- H. Chassaigne and R. Lobinski, Talanta, 1999, 48, 109–118 CrossRef CAS.
- S. Monicou, K. Polec, H. Chassaigne, M. Potin-Gautier and R. Lobinski, J. Anal. At. Spectrom., 2000, 15, 635–642 RSC.
- H. De Smet, B. De Wachter, R. Lobinski and R. Blust, Aquat. Toxicol., 2001, 52, 269–281 CrossRef CAS.
- H. Chassaigne and R. Lobinski, Anal. Chem., 1998, 70, 2536–2543 CrossRef CAS.
- H. Chassaigne and R. Lobinski, Fresenius’ J. Anal. Chem., 1998, 361, 267–273 CrossRef CAS.
- G. V. Benemanskaya, D. V. Daineka and G. E. Frank-Kamenetskaya, J. Exp. Theor. Phys., 2001, 92, 297–303 CrossRef CAS.
- P. Piromreun, H. Oh, Y. L. Shen, G. G. Malliaras, J. C. Scott and P. J. Brock, Appl. Phys. Lett., 2000, 77, 2403–2405 CrossRef CAS.
- N. B. Cech and C. Enke, Mass Spectrom. Rev., 2001, 20, 362–387 CAS.
| This journal is © The Royal Society of Chemistry 2004 |
