The S1 neutral and D0 cationic states of fluorobenzene and fluorobenzene–argon probed by ZEKE spectroscopy with partial rotational resolution
Mark S.
Ford
and
Klaus
Müller-Dethlefs
Department of Chemistry, University of York, Heslington, York, UK YO10 5DD
First published on 3rd December 2003
Abstract
Rotationally resolved zero electron kinetic energy (ZEKE) spectra of fluorobenzene and fluorobenzene–argon have been investigated using a spectator orbital model to interpret the rotational structure. Unlike a frozen core model this model relates to the electronic structure in both final and initial states. A new ZEKE electron detection scheme was employed to record ZEKE excitation spectra as a function of the S1![[thin space (1/6-em)]](https://www.rsc.org/images/entities/char_2009.gif) ←
←![[thin space (1/6-em)]](https://www.rsc.org/images/entities/char_2009.gif) S0 excitation laser photon energy, with fixed photon energy of the ionization laser. These ZEKE excitation spectra are a sensitive probe of the rotational constants of all three states involved, the S0 and S1 of the neutral and the D0 of the cation. The rotational constants of the fluorobenzene cation were found to be A+
S0 excitation laser photon energy, with fixed photon energy of the ionization laser. These ZEKE excitation spectra are a sensitive probe of the rotational constants of all three states involved, the S0 and S1 of the neutral and the D0 of the cation. The rotational constants of the fluorobenzene cation were found to be A+![[thin space (1/6-em)]](https://www.rsc.org/images/entities/char_2009.gif) =
=![[thin space (1/6-em)]](https://www.rsc.org/images/entities/char_2009.gif) 5406.8
5406.8![[thin space (1/6-em)]](https://www.rsc.org/images/entities/char_2009.gif) ±
±![[thin space (1/6-em)]](https://www.rsc.org/images/entities/char_2009.gif) 5.3 MHz, B+
5.3 MHz, B+![[thin space (1/6-em)]](https://www.rsc.org/images/entities/char_2009.gif) =
=![[thin space (1/6-em)]](https://www.rsc.org/images/entities/char_2009.gif) 2689.7
2689.7![[thin space (1/6-em)]](https://www.rsc.org/images/entities/char_2009.gif) ±
±![[thin space (1/6-em)]](https://www.rsc.org/images/entities/char_2009.gif) 3.5 MHz, and C+
3.5 MHz, and C+![[thin space (1/6-em)]](https://www.rsc.org/images/entities/char_2009.gif) =
=![[thin space (1/6-em)]](https://www.rsc.org/images/entities/char_2009.gif) 1812.1
1812.1![[thin space (1/6-em)]](https://www.rsc.org/images/entities/char_2009.gif) ±
±![[thin space (1/6-em)]](https://www.rsc.org/images/entities/char_2009.gif) 1.8 MHz. The rotational constants for the argon complex were found to be A′
1.8 MHz. The rotational constants for the argon complex were found to be A′![[thin space (1/6-em)]](https://www.rsc.org/images/entities/char_2009.gif) =
=![[thin space (1/6-em)]](https://www.rsc.org/images/entities/char_2009.gif) 1773.3
1773.3![[thin space (1/6-em)]](https://www.rsc.org/images/entities/char_2009.gif) ±
±![[thin space (1/6-em)]](https://www.rsc.org/images/entities/char_2009.gif) 1.7 MHz, B′
1.7 MHz, B′![[thin space (1/6-em)]](https://www.rsc.org/images/entities/char_2009.gif) =
=![[thin space (1/6-em)]](https://www.rsc.org/images/entities/char_2009.gif) 1148.9
1148.9![[thin space (1/6-em)]](https://www.rsc.org/images/entities/char_2009.gif) ±
±![[thin space (1/6-em)]](https://www.rsc.org/images/entities/char_2009.gif) 1.4 MHz, and C′
1.4 MHz, and C′![[thin space (1/6-em)]](https://www.rsc.org/images/entities/char_2009.gif) =
=![[thin space (1/6-em)]](https://www.rsc.org/images/entities/char_2009.gif) 996.83
996.83![[thin space (1/6-em)]](https://www.rsc.org/images/entities/char_2009.gif) ±
±![[thin space (1/6-em)]](https://www.rsc.org/images/entities/char_2009.gif) 0.98 MHz in the intermediate S1 state, and A+
0.98 MHz in the intermediate S1 state, and A+![[thin space (1/6-em)]](https://www.rsc.org/images/entities/char_2009.gif) =
=![[thin space (1/6-em)]](https://www.rsc.org/images/entities/char_2009.gif) 1848.8
1848.8![[thin space (1/6-em)]](https://www.rsc.org/images/entities/char_2009.gif) ±
±![[thin space (1/6-em)]](https://www.rsc.org/images/entities/char_2009.gif) 1.8 MHz, B+
1.8 MHz, B+![[thin space (1/6-em)]](https://www.rsc.org/images/entities/char_2009.gif) =
=![[thin space (1/6-em)]](https://www.rsc.org/images/entities/char_2009.gif) 1076.6
1076.6![[thin space (1/6-em)]](https://www.rsc.org/images/entities/char_2009.gif) ±
±![[thin space (1/6-em)]](https://www.rsc.org/images/entities/char_2009.gif) 1.4 MHz, and C+
1.4 MHz, and C+![[thin space (1/6-em)]](https://www.rsc.org/images/entities/char_2009.gif) =
=![[thin space (1/6-em)]](https://www.rsc.org/images/entities/char_2009.gif) 908.37
908.37![[thin space (1/6-em)]](https://www.rsc.org/images/entities/char_2009.gif) ±
±![[thin space (1/6-em)]](https://www.rsc.org/images/entities/char_2009.gif) 0.89 MHz in the cationic D0 state. Two structural parameters of the complex were derived from these rotational constants, the distance between the argon atom and the aromatic ring, rz and the distance in the plane of the aromatic ring between the centre of mass and the argon atom rx. These two parameters were determined as rx
0.89 MHz in the cationic D0 state. Two structural parameters of the complex were derived from these rotational constants, the distance between the argon atom and the aromatic ring, rz and the distance in the plane of the aromatic ring between the centre of mass and the argon atom rx. These two parameters were determined as rx![[thin space (1/6-em)]](https://www.rsc.org/images/entities/char_2009.gif) =
=![[thin space (1/6-em)]](https://www.rsc.org/images/entities/char_2009.gif) 0.78 Å and rz
0.78 Å and rz![[thin space (1/6-em)]](https://www.rsc.org/images/entities/char_2009.gif) =
=![[thin space (1/6-em)]](https://www.rsc.org/images/entities/char_2009.gif) 3.33 Å in the S1 state and rx
3.33 Å in the S1 state and rx![[thin space (1/6-em)]](https://www.rsc.org/images/entities/char_2009.gif) =
=![[thin space (1/6-em)]](https://www.rsc.org/images/entities/char_2009.gif) 0.36 Å and rz
0.36 Å and rz![[thin space (1/6-em)]](https://www.rsc.org/images/entities/char_2009.gif) =
=![[thin space (1/6-em)]](https://www.rsc.org/images/entities/char_2009.gif) 3.76 Å in the D0 state.
3.76 Å in the D0 state.
1. Introduction
In many studies of the rotational structure of electronic excitations, it has not been possible to resolve individual rotational transitions. Despite this, the band profile for these transitions has often proved sufficient to obtain reliable rotational constants. A prime example comes from early rotational analyses of the S1![[thin space (1/6-em)]](https://www.rsc.org/images/entities/char_2009.gif) ←
←![[thin space (1/6-em)]](https://www.rsc.org/images/entities/char_2009.gif) S0 spectrum of benzene1 that were successfully carried out using rotational band contour analysis. This study was able to demonstrate some of the effects of the high symmetry of benzene on the observed spectra. Presently, the use of rotational band contour analysis to obtain rotational constants from S1
S0 spectrum of benzene1 that were successfully carried out using rotational band contour analysis. This study was able to demonstrate some of the effects of the high symmetry of benzene on the observed spectra. Presently, the use of rotational band contour analysis to obtain rotational constants from S1![[thin space (1/6-em)]](https://www.rsc.org/images/entities/char_2009.gif) ←
←![[thin space (1/6-em)]](https://www.rsc.org/images/entities/char_2009.gif) S0 spectra has become a more or less standard spectroscopic technique.2–4 However, for transitions from a neutral molecule to an ion core, such as observed in rotationally resolved ZEKE spectroscopy, the situation is much less clear. For ionizing transitions or transitions to Rydberg states the selection rules for the change in angular momentum between the neutral and ionic states do not arise simply from the interaction with the photon. Instead, angular momentum is transferred to the continuum or Rydberg electron in the final state. Hence, in order to apply rotational band contour analysis to ZEKE spectra a model must be employed to account for the ionisation dynamics.
S0 spectra has become a more or less standard spectroscopic technique.2–4 However, for transitions from a neutral molecule to an ion core, such as observed in rotationally resolved ZEKE spectroscopy, the situation is much less clear. For ionizing transitions or transitions to Rydberg states the selection rules for the change in angular momentum between the neutral and ionic states do not arise simply from the interaction with the photon. Instead, angular momentum is transferred to the continuum or Rydberg electron in the final state. Hence, in order to apply rotational band contour analysis to ZEKE spectra a model must be employed to account for the ionisation dynamics.
In rotationally resolved ZEKE spectroscopy, the selection rules for changes in total angular momentum between the neutral (J) and ionic rotational states (J+) are not just given by ΔJ![[thin space (1/6-em)]](https://www.rsc.org/images/entities/char_2009.gif) =
=![[thin space (1/6-em)]](https://www.rsc.org/images/entities/char_2009.gif) J+–J
J+–J![[thin space (1/6-em)]](https://www.rsc.org/images/entities/char_2009.gif) =
=![[thin space (1/6-em)]](https://www.rsc.org/images/entities/char_2009.gif) 0, ±1 since angular momentum can be transferred to the final state Rydberg electron.5–9 The conservation of angular momentum requires that the vector sum of the angular momenta involved, i.e. of the initial (neutral) rotational state (J), the photon (1), the final (ionic) rotational state (J+) and the Rydberg electron (l) is equal to zero. The ammonia molecule was the first polyatomic molecule studied by ZEKE spectroscopy for which full rotational resolution in the cation was achieved.10,11 This was followed by a study on the rotational structure of benzene.12 In both cases, the selection rules that exist for these highly symmetric molecules were illustrated.13 To do this, a compound state was introduced as an intermediate between the initial and final states in the ZEKE transition, using this model, selection rules for allowed transitions could be deduced.11,13 The recorded spectra were found to be in good agreement with the symmetry selection rules that arise from the compound state model. A number of other models have been used previously to analyze the rotational structure in ZEKE spectra: Multichannel quantum defect theory (MQDT)14 has been employed to predict the line intensities for the spectra arising from small molecules such as hydrogen15 and water,16 where it was demonstrated to be a valuable tool, particularly with respect to final state interactions (i.e. rotational autoionization), which can have an additional effect on the intensities of ZEKE transitions. The role of autoionization in these smaller molecules is important. However, for larger molecules, the final state interactions are expected to even out,17 and furthermore the parameters necessary for applying MQDT become harder to obtain as the molecular core becomes less atomic-like as in ammonia.18 A model by Wang and McKoy has been developed to analyse rotationally resolved ZEKE spectra.19 The method relies on ab initio calculations, which treat the final state wavefunction as the product between the ionic core and scattering wavefunctions found in the field of the ionic core. The model has been applied to many, mainly diatomic, molecules and, most recently, the complex formed between sodium and water.20 This approach has given very good agreement for rotationally resolved ZEKE spectra and also for photoelectron spectra including their angular distributions.21 Also, the photoionization dynamics have been very successfully described in terms of bound-free one-electron radial matrix elements and phase shifts for the interpretation of angular photoelectron distributions.5–9 All this work has so far not been extended to larger molecular systems, in particular asymmetric rotor molecules and molecular clusters. The spectator model, which is the method presented in this paper, has successfully been shown to reproduce the transition intensities in the fully rotationally resolved ZEKE spectra of benzene,22 despite the fact that no account has been taken of the final state interactions. The model used here is also used to highlight interesting ionisation dynamics in the ZEKE spectroscopy of butylbenzene.23
0, ±1 since angular momentum can be transferred to the final state Rydberg electron.5–9 The conservation of angular momentum requires that the vector sum of the angular momenta involved, i.e. of the initial (neutral) rotational state (J), the photon (1), the final (ionic) rotational state (J+) and the Rydberg electron (l) is equal to zero. The ammonia molecule was the first polyatomic molecule studied by ZEKE spectroscopy for which full rotational resolution in the cation was achieved.10,11 This was followed by a study on the rotational structure of benzene.12 In both cases, the selection rules that exist for these highly symmetric molecules were illustrated.13 To do this, a compound state was introduced as an intermediate between the initial and final states in the ZEKE transition, using this model, selection rules for allowed transitions could be deduced.11,13 The recorded spectra were found to be in good agreement with the symmetry selection rules that arise from the compound state model. A number of other models have been used previously to analyze the rotational structure in ZEKE spectra: Multichannel quantum defect theory (MQDT)14 has been employed to predict the line intensities for the spectra arising from small molecules such as hydrogen15 and water,16 where it was demonstrated to be a valuable tool, particularly with respect to final state interactions (i.e. rotational autoionization), which can have an additional effect on the intensities of ZEKE transitions. The role of autoionization in these smaller molecules is important. However, for larger molecules, the final state interactions are expected to even out,17 and furthermore the parameters necessary for applying MQDT become harder to obtain as the molecular core becomes less atomic-like as in ammonia.18 A model by Wang and McKoy has been developed to analyse rotationally resolved ZEKE spectra.19 The method relies on ab initio calculations, which treat the final state wavefunction as the product between the ionic core and scattering wavefunctions found in the field of the ionic core. The model has been applied to many, mainly diatomic, molecules and, most recently, the complex formed between sodium and water.20 This approach has given very good agreement for rotationally resolved ZEKE spectra and also for photoelectron spectra including their angular distributions.21 Also, the photoionization dynamics have been very successfully described in terms of bound-free one-electron radial matrix elements and phase shifts for the interpretation of angular photoelectron distributions.5–9 All this work has so far not been extended to larger molecular systems, in particular asymmetric rotor molecules and molecular clusters. The spectator model, which is the method presented in this paper, has successfully been shown to reproduce the transition intensities in the fully rotationally resolved ZEKE spectra of benzene,22 despite the fact that no account has been taken of the final state interactions. The model used here is also used to highlight interesting ionisation dynamics in the ZEKE spectroscopy of butylbenzene.23
In this paper, we present a novel approach to describe the ionization dynamics, based on a Rydberg-like spectator orbital description.24 This spectator model is simple enough that it can be reliably applied to larger, asymmetric top molecules where final state interactions do not have a significant effect on the relative intensities of ZEKE transitions, and thus facilitate rotational band contour analysis of ZEKE spectra.2,22–25
The fluorobenzene molecule is an ideal prototype molecule for spectroscopic studies in a supersonic jet expansion. The molecule has a relatively high vapour pressure, and hence it can be seeded into the jet without difficulty. Furthermore, the monosubstituted aromatic ring gives rise to strong electronic transitions to the S1 state, which are symmetry allowed. Fluorobenzene has been well characterised by spectroscopy in the S0, S1 and the D0 (cation) states.26–29 The ground state rotational constants are available from microwave spectroscopy,26 whilst S1 state rotational constants have been obtained using high-resolution laser induced fluorescence (LIF)27 spectroscopy. The fluorobenzene cation has been studied using mass-analysed threshold ionisation (MATI) spectroscopy,29 but until now no rotational constants have been obtained for the cation.
Systems with simple structures such as fluorobenzene, stand as a useful test for the application of the spectator model to asymmetric tops; the equilibrium structure (and even the harmonic frequencies) of such molecules can generally be obtained with sufficient accuracy to reproduce experimentally determined rotational constants using electronic structure methods.30,31 However, weaker interactions with shallow potential minima can be poorly reproduced by electronic structure methods as these interactions arise mainly from electron correlation, hence the rotational constants of weakly bound clusters are much more informative. It is therefore useful to show that the spectator model can be successfully applied in the study of weakly bound clusters; hence this study is also applied to fluorobenzene argon.
Many studies using complexes of argon with aromatic compounds have shown unambiguously from the band profile that, in a supersonic jet expansion, argon will preferentially bind above the aromatic ring.2,32,33 These studies are also useful probes of how the argon binding changes on excitation. Typically, the argon is more closely bound in the excited state, which is reflected in a red shift from the monomer excitation to that in the complex (i.e. the vibrationless band origin appears to lower energy for the complex as opposed to the monomer). This is indeed the case for fluorobenzene–argon,34 whose structure is depicted in Fig. 1. The two structural parameters, rz and rx, required to define the position of the argon atom are indicated in this figure. The ground state of the complex has been studied using Fourier transform microwave spectroscopy by Stahl and Grabow.34 Precise rotational constants were obtained, with the argon structural parameters evaluated as rz![[thin space (1/6-em)]](https://www.rsc.org/images/entities/char_2009.gif) =
=![[thin space (1/6-em)]](https://www.rsc.org/images/entities/char_2009.gif) 355 pm and rx
355 pm and rx![[thin space (1/6-em)]](https://www.rsc.org/images/entities/char_2009.gif) =
=![[thin space (1/6-em)]](https://www.rsc.org/images/entities/char_2009.gif) −46 pm. These results are further supported by the ab initio work of Hobza et al.,35 which involved the use of an extended basis set for the argon atom ([7s4p2d]) to recover the correlation energy using the MP2 method. Three intermolecular modes have been observed for fluorobenzene argon in the S1 state using REMPI spectroscopy by Bieske et al.36 The cation has been studied on three occasions.29,37,38 A vibrational progression in the bx mode (see Fig. 1) was observed in the ZEKE spectra recorded by Shinohara et al.;38 a Franck–Condon analysis of this progression led to the conclusion that the argon atom was shifted by 7° along the bending coordinate on ionisation from the S1 state; a calculation based on ab initio atomic charges in the neutral and the cation led to the conclusion that the argon moves toward the fluorine atom. A similar situation is observed with argon complexes with other electron withdrawing groups such as aniline39 and benzonitrile.40
−46 pm. These results are further supported by the ab initio work of Hobza et al.,35 which involved the use of an extended basis set for the argon atom ([7s4p2d]) to recover the correlation energy using the MP2 method. Three intermolecular modes have been observed for fluorobenzene argon in the S1 state using REMPI spectroscopy by Bieske et al.36 The cation has been studied on three occasions.29,37,38 A vibrational progression in the bx mode (see Fig. 1) was observed in the ZEKE spectra recorded by Shinohara et al.;38 a Franck–Condon analysis of this progression led to the conclusion that the argon atom was shifted by 7° along the bending coordinate on ionisation from the S1 state; a calculation based on ab initio atomic charges in the neutral and the cation led to the conclusion that the argon moves toward the fluorine atom. A similar situation is observed with argon complexes with other electron withdrawing groups such as aniline39 and benzonitrile.40
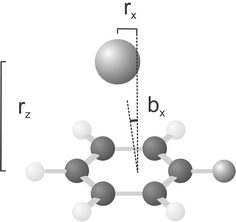 | ||
| Fig. 1 The structure of the fluorobenzene argon dimer. The two parameters, rx and rz define the position of the argon atom with respect to the benzene ring. | ||
Given that the rotational constants of the monomer are known, it is possible to obtain zero-point vibrationally averaged values for the structural parameters rx and rz. Assuming the geometric structure of the monomer is not significantly perturbed by the presence of the argon atom,32 the two structural parameters can be obtained by combining the two sets of rotational constants. The rotational band contour in ZEKE spectroscopy additionally reflects the electronic structure of the molecule; hence it is expected to give an indication of the perturbation of the electronic structure by the argon atom.
2. Theoretical details
The main premise behind the spectator model, used to reproduce the ZEKE band contour, is to treat the initial state in the ZEKE transition (using a two photon ionisation scheme, this is the intermediate state) with an N electron wavefunction, Ψ′, as a Rydberg-like state, having a separate spectator electron coupled to the ionic core with N![[thin space (1/6-em)]](https://www.rsc.org/images/entities/char_2009.gif) −
−![[thin space (1/6-em)]](https://www.rsc.org/images/entities/char_2009.gif) 1 electron wavefunction, Ψ+. This arises as the first term in an expansion of the intermediate state wavefunction in terms of all the possible states of the ion, Ψn+, and a single electron wavefunction, that arises from the projection of a given state of the ion on the intermediate state wavefunction eqn. (1). Only the first term in this expansion is important, as higher terms will not contribute to the intensity of the ZEKE transition, as they would have no overlap with the ionic wavefunction. The Rydberg-like orbital in this initial state is therefore termed the spectator orbital, Ψ′s, which is obtained as the projection of the N−1 electron ionic core wavefunction, Ψ+, on to Ψ′.
1 electron wavefunction, Ψ+. This arises as the first term in an expansion of the intermediate state wavefunction in terms of all the possible states of the ion, Ψn+, and a single electron wavefunction, that arises from the projection of a given state of the ion on the intermediate state wavefunction eqn. (1). Only the first term in this expansion is important, as higher terms will not contribute to the intensity of the ZEKE transition, as they would have no overlap with the ionic wavefunction. The Rydberg-like orbital in this initial state is therefore termed the spectator orbital, Ψ′s, which is obtained as the projection of the N−1 electron ionic core wavefunction, Ψ+, on to Ψ′.  | (1) |
This expansion gives rise to a set of orbitals that are non-orthogonal, the spectator orbital is therefore quite different to the orbitals obtained in a Hartree–Fock calculation. As the ionising photon interacts only with the spectator orbital (the ion core, Ψ+, is already fully electronically relaxed) the ionisation process is effectively reduced from a complex multi-electron process to a single electron process. Rotational angular momentum in the initial state can be decoupled into the angular momentum of the spectator electron and rotational angular momentum of the ionic core. The various angular momenta are referred to according to the symbols listed in Table 1, corresponding to the symmetric top basis functions used to describe the asymmetric top wavefunctions.
The symmetry of the spectator electron is restricted to the product of the symmetry of the ionic core state and the initial state in the ZEKE transition (eqn. (2))
ΓΨ′s![[thin space (1/6-em)]](https://www.rsc.org/images/entities/char_2009.gif) = =![[thin space (1/6-em)]](https://www.rsc.org/images/entities/char_2009.gif) ΓΨ′ ΓΨ′![[thin space (1/6-em)]](https://www.rsc.org/images/entities/char_2009.gif) ⊗ ⊗![[thin space (1/6-em)]](https://www.rsc.org/images/entities/char_2009.gif) ΓΨ+ ΓΨ+ | (2) |
This can be used to restrict the number of coefficients required to describe the spectator electron. The values of the l′ and λ′ that are allowed are determined using symmetry correlation tables projecting the cylindrical group D∞h onto the molecular symmetry group of the molecule in question. However, the values depend upon the choice of z-axis, which can logically lie along any of the three principal inertial axes. The selection rules,11 which arise from the triangle conditions of angular momentum coupling,41 are given by eqn. (3).
J′![[thin space (1/6-em)]](https://www.rsc.org/images/entities/char_2009.gif) + +![[thin space (1/6-em)]](https://www.rsc.org/images/entities/char_2009.gif) l′ l′![[thin space (1/6-em)]](https://www.rsc.org/images/entities/char_2009.gif) ≥ ≥![[thin space (1/6-em)]](https://www.rsc.org/images/entities/char_2009.gif) N+ N+![[thin space (1/6-em)]](https://www.rsc.org/images/entities/char_2009.gif) ![[greater than or equal, slant]](https://www.rsc.org/images/entities/char_2a7e.gif) ![[thin space (1/6-em)]](https://www.rsc.org/images/entities/char_2009.gif) |J′ |J′![[thin space (1/6-em)]](https://www.rsc.org/images/entities/char_2009.gif) − −![[thin space (1/6-em)]](https://www.rsc.org/images/entities/char_2009.gif) l′|,K+ l′|,K+![[thin space (1/6-em)]](https://www.rsc.org/images/entities/char_2009.gif) = =![[thin space (1/6-em)]](https://www.rsc.org/images/entities/char_2009.gif) K′ K′![[thin space (1/6-em)]](https://www.rsc.org/images/entities/char_2009.gif) − −![[thin space (1/6-em)]](https://www.rsc.org/images/entities/char_2009.gif) λ′ λ′ | (3) |
An advantage of the spectator model over the compound state model arises, because the symmetry selection rules are not dependent on the interaction of the photon to form the compound state. Hence, only the symmetry of the spectator orbital needs to be considered. However, it should be noted that this is a limiting case, and in the spectator model, there is no allowance for the fact that the photon angular momentum can be transferred to the core. The spectator model is an appropriate description; in a dynamic picture, the excited electron will not spend long in the core region after the interaction with the photon.
The expression for the two photon ZEKE transition intensity for an asymmetric top from this model can be shown to be given by eqn. (4).24 The background for the derivation of eqn. (4) can be found in refs. 11, 42 and 43. Any of the three inertial axes can be taken as the z-axis; for fluorobenzene, the c-axis is chosen in order to reflect the symmetry axis in the analogous benzene system. The model treats ionization as having occurred from an orbital produced by the projection of the cationic state electronic wavefunction onto that of the intermediate state. The expression for the transition intensities is dependent on the radial matrix elements, which relate to the angular distribution of the spectator orbital. The radial matrix elements resolve effectively to a series of parameters, γ, which are dependent on only the angular momentum of the spectator electron, l′, and its projection λ′. In the expression for the intensity the term γl′λ′ appears, which carries information about the angular distribution of the spectator orbital from which ionisation occurs.
These are the expansion coefficients, γl′λ′![[thin space (1/6-em)]](https://www.rsc.org/images/entities/char_2009.gif) =
=![[thin space (1/6-em)]](https://www.rsc.org/images/entities/char_2009.gif) 〈l′λ′|Ψ′s〉
〈l′λ′|Ψ′s〉![[thin space (1/6-em)]](https://www.rsc.org/images/entities/char_2009.gif) =
=![[thin space (1/6-em)]](https://www.rsc.org/images/entities/char_2009.gif) 〈l′λ′Ψ+|Ψ′〉.
〈l′λ′Ψ+|Ψ′〉.
The expression for the transition intensities, in terms of the ground state (S0) angular momentum, J″, the intermediate state (S1) angular momentum J′, the cationic angular momentum excluding electron spin†, N+, the population in the intermediate state, ρ, and the polarizations of the first and second photon, p′ and p″, is given by eqn. (4). In eqn. (4) the sums over K+ and K′ come from the expansion of the asymmetric rotor wavefunctions of the ion and the neutral in their respective symmetric rotor basis functions with expansion coefficients αK+ and αK′ and [l]![[thin space (1/6-em)]](https://www.rsc.org/images/entities/char_2009.gif) ≡
≡![[thin space (1/6-em)]](https://www.rsc.org/images/entities/char_2009.gif) [2l
[2l![[thin space (1/6-em)]](https://www.rsc.org/images/entities/char_2009.gif) +
+![[thin space (1/6-em)]](https://www.rsc.org/images/entities/char_2009.gif) 1].
1].
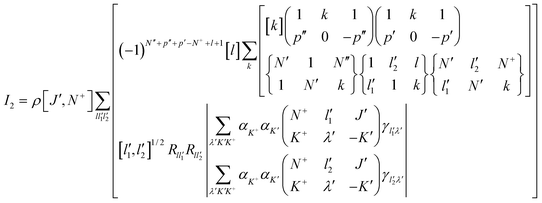 | (4) |
Expression (4) contains terms arising from k![[thin space (1/6-em)]](https://www.rsc.org/images/entities/char_2009.gif) =
=![[thin space (1/6-em)]](https://www.rsc.org/images/entities/char_2009.gif) 0, 1 and 2. The non-zero values of k originate from the effect of polarization in the two-photon ionization process. The k
0, 1 and 2. The non-zero values of k originate from the effect of polarization in the two-photon ionization process. The k![[thin space (1/6-em)]](https://www.rsc.org/images/entities/char_2009.gif) =
=![[thin space (1/6-em)]](https://www.rsc.org/images/entities/char_2009.gif) 1 term is non-zero only for circular polarizations (p″
1 term is non-zero only for circular polarizations (p″![[thin space (1/6-em)]](https://www.rsc.org/images/entities/char_2009.gif) =
=![[thin space (1/6-em)]](https://www.rsc.org/images/entities/char_2009.gif) ±1 and p′
±1 and p′![[thin space (1/6-em)]](https://www.rsc.org/images/entities/char_2009.gif) =
=![[thin space (1/6-em)]](https://www.rsc.org/images/entities/char_2009.gif) ±
±![[thin space (1/6-em)]](https://www.rsc.org/images/entities/char_2009.gif) 1) or crossed linear polarizations and is zero for linear parallel photon polarizations as used in the present experiments. The k
1) or crossed linear polarizations and is zero for linear parallel photon polarizations as used in the present experiments. The k![[thin space (1/6-em)]](https://www.rsc.org/images/entities/char_2009.gif) =
=![[thin space (1/6-em)]](https://www.rsc.org/images/entities/char_2009.gif) 2 term appears complicated, however, our calculations have shown that the k
2 term appears complicated, however, our calculations have shown that the k![[thin space (1/6-em)]](https://www.rsc.org/images/entities/char_2009.gif) =
=![[thin space (1/6-em)]](https://www.rsc.org/images/entities/char_2009.gif) 2 term is only about 5% of the k
2 term is only about 5% of the k![[thin space (1/6-em)]](https://www.rsc.org/images/entities/char_2009.gif) =
=![[thin space (1/6-em)]](https://www.rsc.org/images/entities/char_2009.gif) 0 term and hence only makes a minor contribution when parallel linear photon polarizations are used in the experiment. However, the k
0 term and hence only makes a minor contribution when parallel linear photon polarizations are used in the experiment. However, the k![[thin space (1/6-em)]](https://www.rsc.org/images/entities/char_2009.gif) =
=![[thin space (1/6-em)]](https://www.rsc.org/images/entities/char_2009.gif) 2 term cannot be neglected when circular polarizations or crossed linear polarizations are used. Discarding the k
2 term cannot be neglected when circular polarizations or crossed linear polarizations are used. Discarding the k![[thin space (1/6-em)]](https://www.rsc.org/images/entities/char_2009.gif) =
=![[thin space (1/6-em)]](https://www.rsc.org/images/entities/char_2009.gif) 2 term (and the k
2 term (and the k![[thin space (1/6-em)]](https://www.rsc.org/images/entities/char_2009.gif) =
=![[thin space (1/6-em)]](https://www.rsc.org/images/entities/char_2009.gif) 1 term) the transition probability becomes just the one-photon transition probability eqn. (5), which is a simple equation giving intensities that depend only on the values of γl′λ′.
1 term) the transition probability becomes just the one-photon transition probability eqn. (5), which is a simple equation giving intensities that depend only on the values of γl′λ′.
 | (5) |
The simplicity of eqn. (5) becomes apparent when considering the radial matrix elements Rll′. Since the sum over λ′, K+,K′ does not contain l (the Rydberg or continuum angular momentum) the sum over l can effectively be carried out, thus defining the parameters describing the ionization dynamics as solely the spectator orbital coefficients γl′λ′ and a constant radial part Rl′. In this way, the Rydberg or continuum part of the problem has thus effectively been removed from the problem.
Since fluorobenzene (FB) is an asymmetric top, the choice of z-axis for the spectator orbital angular momentum can be assigned to any of the three principal axes. As with butylbenzene,23 the c-axis, which is approximately perpendicular to the aromatic plane in FB, is chosen. (the a and b- axes both lie in the aromatic plane, respectively along and across the direction of the side chain). Although a number of parameters are necessary to describe the spectator orbital, the values of l′ and λ′ determine the selection rules, hence each parameter will have a specific effect on the branch structure of the spectra, and can therefore be independently determined.
If the first term in eqn. (1) were sufficient to describe the electronic structure of the intermediate state, the charge density difference between the cation and the intermediate state (i.e. |〈Ψ′|Ψ′〉|2–|〈Ψ+|Ψ+〉|2) would be an exact representation of the spectator orbital (i.e. |〈Ψ+|Ψ′〉|2). As the first term of the expansion would not fully describe the electronic structure, the difference in charge density is an approximate representation of the spectator orbital that can be readily obtained using standard ab initio methods. As an example the charge density difference between the S1 state in fluorobenzene and the ground state fluorobenzene cation, calculated using the complete active space self-consistent field (CASSCF) method using eight electrons in the seven orbitals of aromatic character, is depicted in Fig. 2. Scrutiny of the charge density difference reveals it to take both positive and negative values, indicating there are some regions where the electron density is in fact higher in the cation. The presence of the negative regions is highlighted in the plot of the charge density difference given in Fig. 3, which has been radially averaged about the centre of charge. This is an indication of the approximate nature of this method for obtaining the spectator electron, as the negative parts can only arise as a consequence of the higher terms in the expansion. The shift in electron density, which for fluorobenzene accounts for less than 1% of the charge density difference, is reflected in a reduction in the overall intensity of ZEKE transitions independently of the rotational sublevels involved, as seen for two butylbenzene isomers.44,23
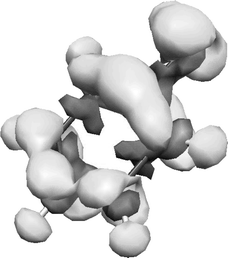 | ||
| Fig. 2 The charge density difference between the intermediate (S1) state and the ionic ground (D0) state in fluorobenzene; the dark grey regions show where the electron density is higher in the ion. This is an approximate representation of the spectator orbital. | ||
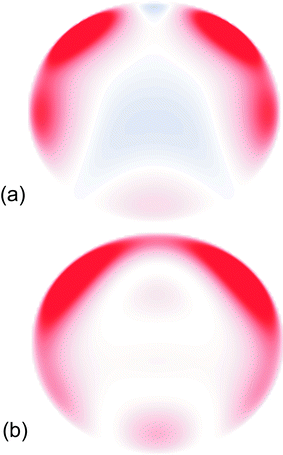 | ||
Fig. 3 (a) Radially averaged charge density difference between the S1 and D0 states in fluorobenzene projected onto a flat surface above the plane of the aromatic ring using only contributions from orbitals of the correct symmetry. (b) Electron density, arising from the spectator orbital contributions with l′![[thin space (1/6-em)]](https://www.rsc.org/images/entities/char_2009.gif) < <![[thin space (1/6-em)]](https://www.rsc.org/images/entities/char_2009.gif) 6. The C–F bond points vertically up the page. Areas shaded red indicate the electron density is higher in the ion, whereas areas shaded blue indicate the electron density is lower in the ion. 6. The C–F bond points vertically up the page. Areas shaded red indicate the electron density is higher in the ion, whereas areas shaded blue indicate the electron density is lower in the ion. | ||
Estimates for the parameters, γl′λ′, were first obtained from an expansion about the centre of mass of the radially averaged electron density presented in Fig. 3 in angular momentum functions. From these starting parameters the rotational structure in the ZEKE spectra was fitted to optimized parameters γl′λ′ by a least squares procedure using eqn. (5). Then, eqn. (4) was employed for the final fit of the rotational structure. It was found that when using the full two-photon transition formula the rotational band profile was still insensitive to the radial matrix elements Rll′, hence in the fit only γl′λ′ was optimised. This is due to the minor contribution of the k![[thin space (1/6-em)]](https://www.rsc.org/images/entities/char_2009.gif) =
=![[thin space (1/6-em)]](https://www.rsc.org/images/entities/char_2009.gif) 2 term in eqn.(4). This k
2 term in eqn.(4). This k![[thin space (1/6-em)]](https://www.rsc.org/images/entities/char_2009.gif) =
=![[thin space (1/6-em)]](https://www.rsc.org/images/entities/char_2009.gif) 2 term contribution is so insignificant that the weighting of the two radial matrix elements Rl−1l′ and Rl+1l′ cannot be obtained from the fit. It should be noted, however, that this should be possible for measurements with crossed or circular polarizations for which the k
2 term contribution is so insignificant that the weighting of the two radial matrix elements Rl−1l′ and Rl+1l′ cannot be obtained from the fit. It should be noted, however, that this should be possible for measurements with crossed or circular polarizations for which the k![[thin space (1/6-em)]](https://www.rsc.org/images/entities/char_2009.gif) =
=![[thin space (1/6-em)]](https://www.rsc.org/images/entities/char_2009.gif) 2 (and, of course, the k
2 (and, of course, the k![[thin space (1/6-em)]](https://www.rsc.org/images/entities/char_2009.gif) =
=![[thin space (1/6-em)]](https://www.rsc.org/images/entities/char_2009.gif) 1) term in eqn. (4) will be enhanced relatively to the k
1) term in eqn. (4) will be enhanced relatively to the k![[thin space (1/6-em)]](https://www.rsc.org/images/entities/char_2009.gif) =
=![[thin space (1/6-em)]](https://www.rsc.org/images/entities/char_2009.gif) 0 term. Also, it should be noted that there is always an uncertainty in the absolute sign of γl′λ′ obtained from either the electron density, or fitting to the spectra. The only way to obtain the absolute sign of the parameters is to calculate the expansion coefficients directly, from the spectator orbital.45
0 term. Also, it should be noted that there is always an uncertainty in the absolute sign of γl′λ′ obtained from either the electron density, or fitting to the spectra. The only way to obtain the absolute sign of the parameters is to calculate the expansion coefficients directly, from the spectator orbital.45
3. Experimental
The experimental spectra presented were recorded using the apparatus described in ref. 46. Both the S1![[thin space (1/6-em)]](https://www.rsc.org/images/entities/char_2009.gif) ←
←![[thin space (1/6-em)]](https://www.rsc.org/images/entities/char_2009.gif) S0 transition and the ionising transition, in the monomer and the complex, were promoted using the frequency doubled output from two (Radiant Narrowscan) dye lasers, using Coumarin-153 dissolved in isopropyl alcohol, pumped by the third harmonic of the Nd:YAG (Continuum Surelite III) laser. In order to accurately calibrate the lasers, each spectrum was recorded simultaneously with an iodine absorption spectrum.
S0 transition and the ionising transition, in the monomer and the complex, were promoted using the frequency doubled output from two (Radiant Narrowscan) dye lasers, using Coumarin-153 dissolved in isopropyl alcohol, pumped by the third harmonic of the Nd:YAG (Continuum Surelite III) laser. In order to accurately calibrate the lasers, each spectrum was recorded simultaneously with an iodine absorption spectrum.
The fluorobenzene was introduced into the supersonic jet expansion by passing argon, at a stagnation pressure of 500 mbar, over a sample holder (containing fluorobenzene) situated outside the vacuum chamber. The fluorobenzene monomer was produced in the molecular beam with a rotational temperature of approximately 6 K. In order to produce fluorobenzene argon clusters in the source, the stagnation pressure of the argon was increased to 2 bar. REMPI spectra were recorded using a 1 kV extraction pulse to accelerate the ions into the reflectron. ZEKE spectra were recorded synchronously with high resolution MATI spectra using the pulse sequence given in ref. 46. The discrimination field was set at 0.67 V cm−1, whereas the ionisation field was 0.33 V cm−1. The resolution obtained for the ZEKE spectra was found to be 0.27![[thin space (1/6-em)]](https://www.rsc.org/images/entities/char_2009.gif) ±
±![[thin space (1/6-em)]](https://www.rsc.org/images/entities/char_2009.gif) 0.01 cm−1. The ions were accelerated with a 1 kV extraction pulse, and the reflectron voltage was reduced to remove the kinetic energy compensation.
0.01 cm−1. The ions were accelerated with a 1 kV extraction pulse, and the reflectron voltage was reduced to remove the kinetic energy compensation.
A resonant two-photon ZEKE spectrum is in effect a two-dimensional spectrum; the signal depends both upon the energy from the excitation laser and the ionisation laser. The excitation laser determines which subset of the rotational levels is populated prior to the ZEKE transition, and the ionisation laser determines the transition energy between the rotational levels. Thus, the rotational band structure forms a contour. An impression of the two-dimensional contour associated with fluorobenzene is given in Fig. 4; the width of the peaks is taken to be that expected under experimental conditions (excitation laser FWHM![[thin space (1/6-em)]](https://www.rsc.org/images/entities/char_2009.gif) =
=![[thin space (1/6-em)]](https://www.rsc.org/images/entities/char_2009.gif) 0.08 cm−1, ZEKE line width FWHM
0.08 cm−1, ZEKE line width FWHM![[thin space (1/6-em)]](https://www.rsc.org/images/entities/char_2009.gif) =
=![[thin space (1/6-em)]](https://www.rsc.org/images/entities/char_2009.gif) 0.2 cm−1). To record such a contour experimentally would be impractical due to the number of data points required. However, by obtaining a series of well calibrated spectra, scanning either the excitation laser to give a ZEKE excitation spectrum (corresponding to a horizontal slice from Fig. 4), or the ionising laser to give a conventional ZEKE spectrum (corresponding to a vertical slice from Fig. 4), the contour can be effectively sampled giving a greater amount of data with which to obtain fitting parameters than can be obtained simply by recording conventional ZEKE spectra.
0.2 cm−1). To record such a contour experimentally would be impractical due to the number of data points required. However, by obtaining a series of well calibrated spectra, scanning either the excitation laser to give a ZEKE excitation spectrum (corresponding to a horizontal slice from Fig. 4), or the ionising laser to give a conventional ZEKE spectrum (corresponding to a vertical slice from Fig. 4), the contour can be effectively sampled giving a greater amount of data with which to obtain fitting parameters than can be obtained simply by recording conventional ZEKE spectra.
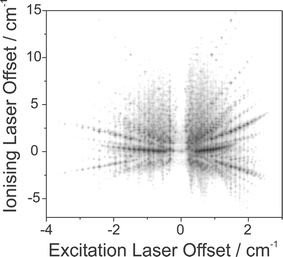 | ||
| Fig. 4 A two dimensional ZEKE contour simulated for fluorobenzene. The cationic rotational constants and spectator orbital coefficients were taken from ab initio values. Darker regions correspond to higher signal intensities. | ||
4. Results and analysis
The REMPI spectrum recorded for the origin band of the S1![[thin space (1/6-em)]](https://www.rsc.org/images/entities/char_2009.gif) ←
←![[thin space (1/6-em)]](https://www.rsc.org/images/entities/char_2009.gif) S0 transition in fluorobenzene, with a simulation based on the rotational constants from ref. 27 is shown in Fig. 5; the rotational temperature of the band was found to be 6.8 K, this was used as the temperature in all subsequent simulations for the monomer. The origin band of the D0
S0 transition in fluorobenzene, with a simulation based on the rotational constants from ref. 27 is shown in Fig. 5; the rotational temperature of the band was found to be 6.8 K, this was used as the temperature in all subsequent simulations for the monomer. The origin band of the D0![[thin space (1/6-em)]](https://www.rsc.org/images/entities/char_2009.gif) ←
←![[thin space (1/6-em)]](https://www.rsc.org/images/entities/char_2009.gif) S1 transition was probed giving both ZEKE (Fig. 6) and ZEKE excitation (Fig. 7) spectra. Although all the band profiles presented were found to be reproducible, daily optimisation of the experimental conditions was found to subtly change the effective magnitude of the extraction field, which is seen as a small shift in the band origin of the MATI spectra, thus to remove the necessity of a separate parameter for the origin of each ZEKE spectrum, all the data presented had to be recorded in one sitting. The four ZEKE spectra presented in Fig. 6 and the nine ZEKE excitation spectra presented in Fig. 7 were all able to be reproduced, in each case the ionising and excitation laser energies for all these spectra are indicated in the figure captions. The trend for the ZEKE band to get broader as the excitation laser is moved away from the band centre results from the fact that the higher J states probed have more widely spaced energy levels. The apparently similar trend for the ZEKE excitation spectra is misleading, as the width of the band does not change. The stronger signals from the centre of the band disappear, increasing the relative height of the high J wings of the P and R branches.
S1 transition was probed giving both ZEKE (Fig. 6) and ZEKE excitation (Fig. 7) spectra. Although all the band profiles presented were found to be reproducible, daily optimisation of the experimental conditions was found to subtly change the effective magnitude of the extraction field, which is seen as a small shift in the band origin of the MATI spectra, thus to remove the necessity of a separate parameter for the origin of each ZEKE spectrum, all the data presented had to be recorded in one sitting. The four ZEKE spectra presented in Fig. 6 and the nine ZEKE excitation spectra presented in Fig. 7 were all able to be reproduced, in each case the ionising and excitation laser energies for all these spectra are indicated in the figure captions. The trend for the ZEKE band to get broader as the excitation laser is moved away from the band centre results from the fact that the higher J states probed have more widely spaced energy levels. The apparently similar trend for the ZEKE excitation spectra is misleading, as the width of the band does not change. The stronger signals from the centre of the band disappear, increasing the relative height of the high J wings of the P and R branches.
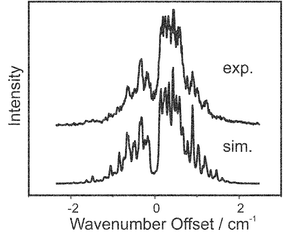 | ||
Fig. 5 The REMPI spectrum showing the S1![[thin space (1/6-em)]](https://www.rsc.org/images/entities/char_2009.gif) ← ←![[thin space (1/6-em)]](https://www.rsc.org/images/entities/char_2009.gif) S0 transition in fluorobenzene. The experimental trace is shown above the simulation, which is made using the rotational constants from ref. 27 The offset of the excitation laser is given from the band centre at 37813.87(8) cm−1. S0 transition in fluorobenzene. The experimental trace is shown above the simulation, which is made using the rotational constants from ref. 27 The offset of the excitation laser is given from the band centre at 37813.87(8) cm−1. | ||
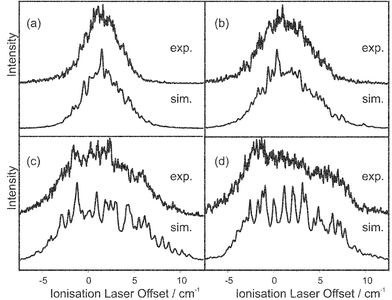 | ||
| Fig. 6 (a)–(d): ZEKE spectra of fluorobenzene (upper trace) with simulations (lower trace) based on fitted rotational constants and spectator orbital coefficients. The offsets of the excitation laser from the band centre are in each case: (a) −0.26 cm−1, (b) 0.46 cm−1, (c) 1.39 cm−1 and (d) 1.57 cm−1. | ||
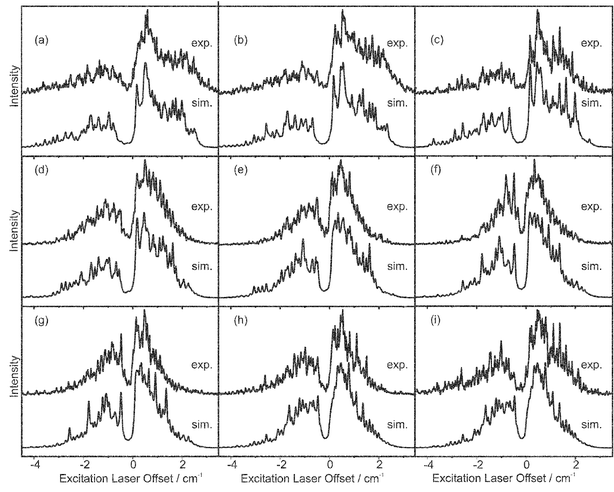 | ||
Fig. 7 Experimental (top) and simulated (bottom) ZEKE excitation spectra of fluorobenzene recorded with the ionising laser fixed at various rotational transitions into the origin band of the cation. The offsets of the ionising laser from the band centre of the cation origin (36410.83![[thin space (1/6-em)]](https://www.rsc.org/images/entities/char_2009.gif) ± ±![[thin space (1/6-em)]](https://www.rsc.org/images/entities/char_2009.gif) 0.18 cm−1) are, for each of the transitions, as follows: (a)
−3.10 cm−1, (b)
−2.46 cm−1, (c)
−1.88 cm−1, (d)
−1.14 cm−1, (e)
−0.53 cm−1, (f)
−0.08 cm−1, (g) 0.53 cm−1, (h) 1.29 cm−1, and (i) 1.78 cm−1. 0.18 cm−1) are, for each of the transitions, as follows: (a)
−3.10 cm−1, (b)
−2.46 cm−1, (c)
−1.88 cm−1, (d)
−1.14 cm−1, (e)
−0.53 cm−1, (f)
−0.08 cm−1, (g) 0.53 cm−1, (h) 1.29 cm−1, and (i) 1.78 cm−1. | ||
The rotational constants and the spectator orbital coefficients, γl′λ′, were simultaneously fit to all the experimental spectra using a least squares fitting procedure. The initial guess for γl′λ′ were obtained from the single centre expansion of the electron density difference, whereas ab initio values were used for the rotational constants. The symmetry restrictions on the values of l′ and λ′ depend on the symmetry of the spectator orbital and the choice of z-axis for the expansion of the spectator orbital. The symmetry of the S1 state is A2, which corresponds to an S1![[thin space (1/6-em)]](https://www.rsc.org/images/entities/char_2009.gif) ←
←![[thin space (1/6-em)]](https://www.rsc.org/images/entities/char_2009.gif) S0 transition moment polarised along the b-axis (the short axis in the plane of the molecule) the symmetry of the D0 state is B1, hence according to eqn. (2), the spectator orbital must have b2 symmetry. Taking the c-axis in fluorobenzene, which is perpendicular to the plane of the molecule, to be the z-axis means that b2 symmetry correlates to values of l′ and λ′ such that odd values of l′ correspond to symmetric (+) combinations of even |λ′|
(i.e.
|λ′〉
S0 transition moment polarised along the b-axis (the short axis in the plane of the molecule) the symmetry of the D0 state is B1, hence according to eqn. (2), the spectator orbital must have b2 symmetry. Taking the c-axis in fluorobenzene, which is perpendicular to the plane of the molecule, to be the z-axis means that b2 symmetry correlates to values of l′ and λ′ such that odd values of l′ correspond to symmetric (+) combinations of even |λ′|
(i.e.
|λ′〉![[thin space (1/6-em)]](https://www.rsc.org/images/entities/char_2009.gif) +
+![[thin space (1/6-em)]](https://www.rsc.org/images/entities/char_2009.gif) |−λ′〉) whereas, even values of l′ correspond to antisymmetric (−) combinations of odd |λ′|
(i.e.
|λ′〉
|−λ′〉) whereas, even values of l′ correspond to antisymmetric (−) combinations of odd |λ′|
(i.e.
|λ′〉![[thin space (1/6-em)]](https://www.rsc.org/images/entities/char_2009.gif) −
−![[thin space (1/6-em)]](https://www.rsc.org/images/entities/char_2009.gif) |−λ′〉) these are denoted as λ±. The angular distribution of the radially averaged electron density difference was expanded to give the approximate values of the spectator orbital coefficients as listed in Table 2. The fitted values of γl′λ′ are listed alongside the calculated values in Table 2; the rotational constants obtained are listed in Table 3. The adiabatic ionisation potential of fluorobenzene was found to be 74227.09
|−λ′〉) these are denoted as λ±. The angular distribution of the radially averaged electron density difference was expanded to give the approximate values of the spectator orbital coefficients as listed in Table 2. The fitted values of γl′λ′ are listed alongside the calculated values in Table 2; the rotational constants obtained are listed in Table 3. The adiabatic ionisation potential of fluorobenzene was found to be 74227.09![[thin space (1/6-em)]](https://www.rsc.org/images/entities/char_2009.gif) ±
±![[thin space (1/6-em)]](https://www.rsc.org/images/entities/char_2009.gif) 0.18 cm−1.
0.18 cm−1.
| l′ | λ′ | γ l′λ′ | |
|---|---|---|---|
| Exp. | Calc. | ||
| 1 | 0 | 0.01 | −0.10 |
| 2 | 1− | 0.16 | 0.16 |
| 3 | 0 | −0.05 | 0.19 |
| 3 | 2+ | 0.15 | 0.17 |
| 4 | 1− | 0.19 | 0.16 |
| 4 | 3− | 0.11 | 0.01 |
| 5 | 0 | −0.10 | −0.10 |
| 5 | 2+ | −0.13 | −0.01 |
| 5 | 4+ | −0.10 | −0.10 |
The rotational constants for the S1 state of fluorobenzene argon were not available from previous literature. However, values for the ground state rotational constants could be taken from the work of Stahl et al.,34 using which, a fit could be made to the experimental REMPI spectra yielding the S1 state rotational constants. The experimental and simulated spectra are presented in Fig. 8; the simulation could not be relied upon to yield useful information as a wide range of parameters could be used to reproduce the spectrum equally well. The ZEKE spectra presented in Fig. 9 were each recorded via the intermediate resonances as indicated in the figure caption. Each of the ZEKE excitation spectra given in Fig. 10 were recorded with the ionisation laser fixed at the energies indicated in the figure caption.
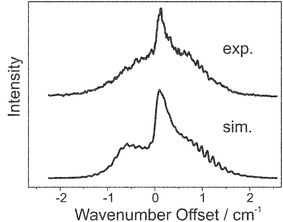 | ||
| Fig. 8 The experimental (upper trace) and simulated (lower trace) S1 7 S0 spectra of the fluorobenzene argon complex. | ||
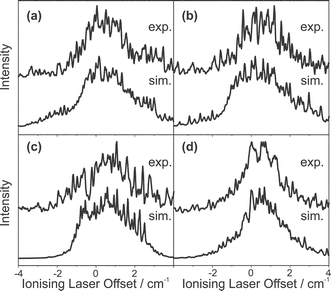 | ||
| Fig. 9 ZEKE spectra of the fluorobenzene argon complex, the upper traces correspond to the experimental spectra, and the lower traces correspond to simulated spectra. The excitation laser was offset by: (a) 0.52 cm−1, (b) 0.26 cm−1, (c) −0.09 cm−1 and (d) −0.33 cm−1. | ||
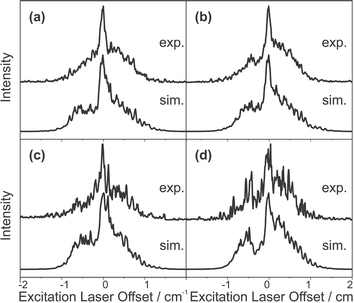 | ||
| Fig. 10 ZEKE excitation spectra of the fluorobenzene argon complex, experimental spectra are above, simulated spectra are below. The ionisation laser was offset by: (a) 1.70 cm−1, (b) 1.18 cm−1, (c) −0.62 cm−1 and (d) −0.32 cm−1. | ||
The simulations in Fig. 9 and Fig. 10 correspond to the optimised values of the γl′λ′ parameters listed in Table 4, which are listed against the values associated with the spectator orbital of the monomer, which differ from those listed in Table 2 as they had to be transformed, using rotation matrices, into the correct inertial frame. This is necessary due to the fact that the argon atom does not necessarily bind above the centre of mass of the monomer causing the a-axis in the complex to deviate from the direction of the c-axis in the monomer. In the inertial frame of the fluorobenzene argon complex, there are more contributions to the spectator orbital because the symmetry is reduced from B2 (C2v) in the monomer to A″ (Cs) in the complex. Taking the rotational constants obtained for the S1 state of the complex from the REMPI spectrum it was found that the inertial frame is rotated by 25° about the b-axis of the monomer relative to the aromatic plane. For the simulations in Fig. 9 the spectator orbital coefficients were optimised, allowing for the perturbation caused by the argon atom on the spectator orbital.
| l′ | λ′ | γ l′λ′ | |
|---|---|---|---|
| Monomer | Complex | ||
| 1 | 0 | 0.01 | 0.03 |
| 2 | 1− | 0.11 | 0.09 |
| 2 | 2− | 0.06 | 0.03 |
| 3 | 1+ | −0.10 | 0.00 |
| 3 | 3+ | 0.06 | 0.00 |
| 3 | 0 | 0.00 | 0.07 |
| 3 | 2+ | 0.07 | 0.10 |
| 4 | 1− | 0.08 | 0.13 |
| 4 | 3− | 0.10 | 0.02 |
| 4 | 2− | 0.05 | 0.04 |
| 4 | 4− | 0.06 | 0.06 |
| 5 | 1+ | 0.03 | −0.06 |
| 5 | 3+ | −0.03 | −0.11 |
| 5 | 5+ | −0.06 | 0.09 |
| 5 | 0 | −0.05 | −0.11 |
| 5 | 2+ | −0.08 | −0.05 |
| 5 | 4+ | −0.08 | −0.07 |
Values for the rotational constants in the S0, S1 and D0 states are presented in Table 5. Two values are given for the S1 state; those obtained by fitting the REMPI spectra, and those obtained by fitting to the ZEKE excitation spectra. The band origin for the S0![[thin space (1/6-em)]](https://www.rsc.org/images/entities/char_2009.gif) ←
←![[thin space (1/6-em)]](https://www.rsc.org/images/entities/char_2009.gif) S1 transition was found to be 37790.50
S1 transition was found to be 37790.50![[thin space (1/6-em)]](https://www.rsc.org/images/entities/char_2009.gif) ±
±![[thin space (1/6-em)]](https://www.rsc.org/images/entities/char_2009.gif) 0.04 cm−1, giving a field corrected47 adiabatic ionisation potential of 74003.99
0.04 cm−1, giving a field corrected47 adiabatic ionisation potential of 74003.99![[thin space (1/6-em)]](https://www.rsc.org/images/entities/char_2009.gif) ±
±![[thin space (1/6-em)]](https://www.rsc.org/images/entities/char_2009.gif) 0.18 cm−1. On the basis of the ZEKE excitation spectra, the rotational temperature in the molecular beam was 2.1 K.
0.18 cm−1. On the basis of the ZEKE excitation spectra, the rotational temperature in the molecular beam was 2.1 K.
Zero-point vibrationally averaged values for the structural parameters rx and rz are obtained by combining the experimentally obtained moments of inertia from the monomer with those from the complex. Thus rx and rz can be obtained. Furthermore, for any given position of the argon atom there is an angle, θ, which represents the rotation of the principal axis system about the (monomer) b axis relative to the aromatic plane, this should not be confused with the bx coordinate, which describes the asymmetric intermolecular bend. The values obtained for the S1and D0 states are given in Table 6, along with those calculated for the ground state in ref. 34
5. Discussion
For the spectroscopy of the fluorobenzene cation, it may seem inappropriate to use the ZEKE excitation spectra as a basis for measuring the cationic rotational constants. However, many advantages can be gained as a result of using these spectra. The dependence of the simulations on the rotational constants in the ion is illustrated in Fig. 11 and Fig. 12. A series of ZEKE spectra recorded by scanning the excitation and ionisation lasers respectively are shown as a function of the A rotational constant, which is varied by 5% from the ab initio values obtained in the CASSCF calculation.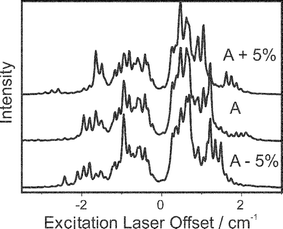 | ||
| Fig. 11 The simulated ZEKE excitation spectra obtained by scanning the excitation laser as a function of the A rotational constant. The uppermost trace was made with A five percent higher than the ab initio value, the central trace was made using the ab initio value, and the remaining trace had A five percent lower than the ab initio value. | ||
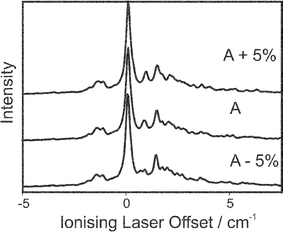 | ||
| Fig. 12 The simulated ZEKE spectra as a function of A, the three traces correspond to the rotational constants as in Fig. 12. | ||
It is apparent from Fig. 12 how the profiles of the spectra recorded by scanning the excitation laser have a much stronger dependence on the rotational constants. This can be a significant advantage for experimental reasons. It takes a shorter time to record these spectra as the signal to noise ratio is better. Furthermore, the range of these spectra are shorter as signals correspond to the transitions in the S1![[thin space (1/6-em)]](https://www.rsc.org/images/entities/char_2009.gif) ←
←![[thin space (1/6-em)]](https://www.rsc.org/images/entities/char_2009.gif) S0 transition, which is governed by the ΔJ
S0 transition, which is governed by the ΔJ![[thin space (1/6-em)]](https://www.rsc.org/images/entities/char_2009.gif) =
=![[thin space (1/6-em)]](https://www.rsc.org/images/entities/char_2009.gif) 0, ±1 selection rule. (The D0
0, ±1 selection rule. (The D0![[thin space (1/6-em)]](https://www.rsc.org/images/entities/char_2009.gif) ←
←![[thin space (1/6-em)]](https://www.rsc.org/images/entities/char_2009.gif) S1 transition energy, which is fixed in these scans, covers a much broader range due to the possibility of higher angular momentum transfer) The fact that these spectra show a greater dependence on the rotational constants does not mean the ZEKE spectra recorded in the conventional manner (scanning the ionisation laser) are unnecessary. The energy of the fixed laser is not calibrated introducing an uncertainty, which is addressed by having a combination of both ZEKE and ZEKE excitation spectra. Furthermore, the branch structure of the conventional ZEKE spectra correlates directly with the spectator orbital parameters, which are needed to simulate the ZEKE excitation spectra.
S1 transition energy, which is fixed in these scans, covers a much broader range due to the possibility of higher angular momentum transfer) The fact that these spectra show a greater dependence on the rotational constants does not mean the ZEKE spectra recorded in the conventional manner (scanning the ionisation laser) are unnecessary. The energy of the fixed laser is not calibrated introducing an uncertainty, which is addressed by having a combination of both ZEKE and ZEKE excitation spectra. Furthermore, the branch structure of the conventional ZEKE spectra correlates directly with the spectator orbital parameters, which are needed to simulate the ZEKE excitation spectra.
The reproduction of the ZEKE intensities for fluorobenzene using the spectator model does not appear to suffer from rotational state dependent autoionisation, as was observed for benzene.22 This may be due to the fact that there are too many bands overlapping in a given spectrum to notice the effect. However, the number of pathways for rotational autoionisation should be much higher from any given state in an asymmetric rotor as opposed to a symmetric rotor. Therefore, the cross-section for rotational autoionisation will not be so strongly state dependent. However, it may still be expected that ZEKE signals arising from cations with a higher rotational angular momentum will be depleted to a greater extent by rotational autoionisation, or conversely, transitions into lower angular momentum states are enhanced more by pseudo autoionisation. This effect can be seen as the simulated ZEKE spectra exhibit stronger signals in the blue end of the spectrum than are seen in the experimental spectra. In the analysis of the rotationally resolved ZEKE spectra of nitric oxide,48 this was proposed as being a dominant effect on the ZEKE intensity. The effect does not appear to be very significant, perhaps as consequence of the experimental conditions.
The values obtained for the rotational constants are close enough to those from the ab initio calculation to assume that the calculated geometry is an accurate representation of the molecule. This is unsurprising, as ab initio methods should work very well for smaller molecular systems such as fluorobenzene, which do not have any weak intramolecular interactions that can have an effect on the structure.
The values of γl′λ′ calculated from the electron density difference bear some relation to those obtained by fitting to the experiment. The experimental uncertainty in the parameters is not as great as may be expected given the number of parameters present, as each value of γl′λ′ corresponds to a markedly different part of the profile: different values of l′ give rise to different ΔJ selection rules, and different values of λ′ give rise to different ΔK propensities (that is preferred values ΔKa and ΔKc, or in the ZEKE spectroscopy of symmetric tops the ΔK selection rules). Furthermore the presence of these parameters does not really affect the uncertainty in the rotational constants. The former are a function of the energy of the transitions and the latter are a function of the intensity of the transitions. The mechanism through which the value of l affects the line intensity is down to the number of differently polarised final states that can be accessed with a given l. Hence, in order to reliably probe the values of the radial matrix elements, the rotational band profile can be studied as a function of the polarisation of the ionising and excitation lasers.
For the fluorobenzene argon complex S1![[thin space (1/6-em)]](https://www.rsc.org/images/entities/char_2009.gif) ←
←![[thin space (1/6-em)]](https://www.rsc.org/images/entities/char_2009.gif) S0 spectrum we encountered great difficulty in fitting the band contour. A major reason for this is due to the congestion of the spectra limiting the number of resolved bands. However, the relatively large shift in the equilibrium position of the argon causes a rotation of the inertial axes by 17° between the S0 and S1 states (corresponding to a change in the bx coordinate by 6.3°). This gives rise to perturbations in the transition intensities by an effect referred to as axis tilting,49,50 which has not been taken into account in the simulation of the S1
S0 spectrum we encountered great difficulty in fitting the band contour. A major reason for this is due to the congestion of the spectra limiting the number of resolved bands. However, the relatively large shift in the equilibrium position of the argon causes a rotation of the inertial axes by 17° between the S0 and S1 states (corresponding to a change in the bx coordinate by 6.3°). This gives rise to perturbations in the transition intensities by an effect referred to as axis tilting,49,50 which has not been taken into account in the simulation of the S1![[thin space (1/6-em)]](https://www.rsc.org/images/entities/char_2009.gif) ←
←![[thin space (1/6-em)]](https://www.rsc.org/images/entities/char_2009.gif) S0 transition. As axis tilting only perturbs the intensities of transitions, the rotational transition energies are not affected; hence, the rotational constants obtained for the intermediate state using the much less congested ZEKE excitation spectra should be reliable. The effect of axis tilting on ZEKE intensities may be reflected in a perturbation of the spectator orbital, whereupon it will be compensated for by small changes in the spectator orbital coefficients.
S0 transition. As axis tilting only perturbs the intensities of transitions, the rotational transition energies are not affected; hence, the rotational constants obtained for the intermediate state using the much less congested ZEKE excitation spectra should be reliable. The effect of axis tilting on ZEKE intensities may be reflected in a perturbation of the spectator orbital, whereupon it will be compensated for by small changes in the spectator orbital coefficients.
The structural parameters derived from the rotational constants listed in Table 6 are consistent with structural changes that may be expected to occur. The change in the bx bending coordinate of 7° between the S1 state and the cation predicted in ref. 38 from a Franck–Condon analysis is supported by the structures determined from the rotational coordinates, which indicate a change in the coordinate of 7.7°. The movement of the argon atom away from the fluorine atom on excitation can be attributed to an increased charge separation in the excited state, bringing about both an attraction to the positive charge in the aromatic ring region, and a repulsive interaction with the increased electron density in the region of the fluorine atom. Upon ionisation, the opposite effect is seen as the reduced negative charge causes the fluorine atom to exert a lesser repulsive force on the argon atom than in the S0 and S1 states. This is consistent with the charge-induced dipole calculations carried out by Shinohara et al.38
The changes in the spectator orbital coefficients between the monomer and the complex are significant for four coefficients. There is a reduction in the magnitude of the γ31+ and γ33+ coefficients, whereas there a significant increase is seen in the γ55+ and γ53+ coefficients. All these contributions have a symmetry which would correspond to an imbalance between the electron density above and below the aromatic ring. The combination of these changes indicates an increased probability of ionisation away from the centre of positive charge. From this it is inferred that the presence of the argon atom causes an increase in the probability of ionisation from the region between the argon atom and the centre of positive charge in the cation.
6. Concluding remarks
ZEKE spectroscopy of fluorobenzene and its complex with argon, via the S1 intermediate states, yield rotational band contours that were successfully simulated using a Rydberg-like spectator orbital model. By recording band profiles as a function of both the ionising and excitation lasers, reliable values for the cationic rotational constants can be obtained—even for a reasonably large molecular cluster.The estimated angular momentum contributions were found to be a useful approximation to those found by obtaining fits to the experimental spectra. The method used to estimate these parameters could be improved upon by resorting to higher level configuration interaction ab initio methods.
In the case of the complex, the difficulties in finding rotational constants in the S1 state with REMPI spectroscopy are overcome by additional information on the S1![[thin space (1/6-em)]](https://www.rsc.org/images/entities/char_2009.gif) ←
←![[thin space (1/6-em)]](https://www.rsc.org/images/entities/char_2009.gif) S0 transition available from ZEKE excitation spectra. The movement of the argon atom in transitions between the three states studied is consistent with previous studies and empirical calculations that have been carried out for the system. The effect of the argon atom on the spectator orbital is small but significant; the changes between the monomer spectator orbital projected into the inertial frame of the complex and those found for the complex can be reasonably accounted for as being a consequence of the perturbation of the electronic structure by the argon atom. However, some of the observed changes in the spectator orbital coefficients may be reflecting the presence of axis-tilting transitions.
S0 transition available from ZEKE excitation spectra. The movement of the argon atom in transitions between the three states studied is consistent with previous studies and empirical calculations that have been carried out for the system. The effect of the argon atom on the spectator orbital is small but significant; the changes between the monomer spectator orbital projected into the inertial frame of the complex and those found for the complex can be reasonably accounted for as being a consequence of the perturbation of the electronic structure by the argon atom. However, some of the observed changes in the spectator orbital coefficients may be reflecting the presence of axis-tilting transitions.
Acknowledgements
We would like to acknowledge the role of Xin Tong in assisting with the recording of the spectra, and also EPSRC for funding the project (GR/M48451).References
- J. H. Callomon, T. M. Dunn and I. M. Mills, Philos. Trans. R. Soc. London Ser. A, 1966, 259, 232 Search PubMed.
- M. S. Ford, S. R. Haines, I. Pugliesi, C. E. H. Dessent and K. Müller-Dethefs, J. Electr. Spec., 2000, 112, 231 Search PubMed.
- W. Roth, D. Spangenberg, C. Janzen, A. Westphal and M. Schmitt, Chem. Phys., 1999, 248, 17 CrossRef CAS.
- M. R. Hockridge, S. M. Knight, E. G. Robertson, J. P. Simons, J. McCombie and M. Walker, Phys. Chem. Chem. Phys., 1999, 1, 407 RSC.
- D. Townsend and K. L. Reid, J. Chem. Phys., 2000, 112, 3819 CrossRef.
- H. Park and R. N. Zare, Phys. Rev. Lett., 2000, 84, 3819 CrossRef CAS.
- K. L. Reid and J. G. Underwood, J. Chem. Phys., 2000, 112, 3643 CrossRef CAS.
- H. Park and R. N. Zare, J. Chem. Phys., 1996, 104, 4554 CrossRef CAS.
- H. Park and R. N. Zare, J. Chem Phys., 1996, 104, 4568 CrossRef CAS.
- W. Habenicht, G. Reiser and K. Müller-Dethlefs, J. Chem. Phys., 1991, 95, 4821 CrossRef.
- K. Müller-Dethlefs, J. Chem. Phys., 1991, 95, 4821 CrossRef.
- R. Lindner, H.-J. Dietrich and K. Müller-Dethlefs, Chem. Phys Lett., 1994, 228, 417 CrossRef CAS.
- I. Fischer, R. Lindner and K. Müller-Dethlefs, J. Chem. Soc., Faraday Trans., 1994, 90, 2425 RSC.
- M. J. Seaton, Rep. Prog. Phys., 1983, 46, 167 CrossRef.
- T. P. Softley and A. J. Hudson, J. Chem. Phys., 1994, 101, 923 CrossRef CAS.
- R. G. Tonkyn, R. Wiedmann and E. R. Grant, J. Chem. Phys., 1991, 95, 7033 CrossRef CAS.
- F. Merkt and T. P. Softley, Int. Rev. Phys. Chem., 1993, 12, 205 CAS.
- H. Dickinson, D. Rolland and T. P. Softley, J. Phys. Chem. A, 2001, 105, 5590 CrossRef CAS.
- K. Wang and B. V. McKoy, Annu. Rev. Phys. Chem., 1995, 46, 275 CrossRef CAS.
- K. Wang, D. A. Rodham and B. V. McKoy, J. Chem. Phys., 1998, 108, 1817.
- K. Müller-Dethlefs, E. W. Schlag, E. R. Grant, K. Wang and B. V. McKoy, Adv. Chem. Phys., 1995, 90, 1.
- M. S. Ford, R. Lindner and K. Müller-Dethlefs, Mol. Phys., 2003, 101, 705 CAS.
- M. S. Ford, X. Tong, C. E. H. Dessent and K. Müller-Dethlefs, J. Chem. Phys., 2003, 119, in press CrossRef.
- M. S. Ford, PhD thesis, University of York, 2002.
- M. S. Ford and K. Müller-Dethlefs, J. Chem. Phys., manuscript in preparation Search PubMed.
- L. Nygaard, I. Bojesen, T. Pederson and J. Rastrup-Andersen, J. Mol. Struct., 1968, 2, 209 CrossRef CAS.
- T. Civitaš and J. M. Hollas, Mol. Phys., 1970, 18, 801 CAS.
- E. D. Lipp and C. J. Seliskar, J. Mol. Spectrosc., 1981, 87, 242 CAS.
- G. Lembach and B. Brutschy, J. Phys. Chem., 1996, 100, 19
![[thin space (1/6-em)]](https://www.rsc.org/images/entities/char_2009.gif) 758 CrossRef CAS.
758 CrossRef CAS. - D. M. Upadhyay, M. K. Shukla and P. C. Mishra, J. Mol. Struct. (THEOCHEM), 2000, 531, 249 CrossRef CAS.
- F. Jensen, Introduction to Computational Chemistry, John Wiley and Sons, New York, 1999 Search PubMed.
- K. H. Fung, H. L. Selzle and E. W. Schlag, Z. Naturforsch. A, 1981, 36, 1338.
- A. Bacon and J. M. Hollas, Faraday Discuss. Chem. Soc., 1988, 86, 129 RSC.
- W. Stahl and J.-U. Grabow, Z. Naturforsch., 1992, 681, 47a Search PubMed.
- P. Hobza, H. L. Selzle and E. W. Schlag, J. Chem Phys., 1993, 99, 2809 CrossRef CAS.
- E. J. Bieske, M. W. Rainbird and A. E. W. Knight, J. Chem. Phys., 1991, 94, 7019 CrossRef CAS.
- T. L. Grebner and H. J. Neusser, Int. J. Mass Spectrom. Ion Processes, 1996, 159, 137 CrossRef CAS.
- H. Shinohara, S. Sato and K. Kimura, J. Phys. Chem. A, 1997, 101, 6736 CrossRef CAS.
- M. Takahashi, H. Ozeki and K. Kimura, J. Chem. Phys., 1992, 96, 6399 CrossRef CAS.
- M. Araki, S. Sato and K. Kimura, Chem. Phys. Lett., 1996, 100, 249.
- R. N. Zare, Angular Momentum, John Wiley and Sons, New York, 1998 Search PubMed.
- K. Müller-Dethlefs, in High Resolution Photoionisation and Photoelectron Studies, ed. I. Powis, T. Baer and C.-Y. Ng, John Wiley and Sons, New York, 1995, ch. 2 Search PubMed.
- J. Xie and R. N. Zare, J. Chem. Phys., 1993, 97, 2891 CrossRef CAS.
- X. Tong, M. S. Ford and C. E. H. Dessent, J. Chem. Phys., 2003, 119, in press CrossRef.
- P. Karadakov, personal communication.
- S. R. Haines, C. E. H. Dessent and K. Müller-Dethlefs, J. Electron Spectrosc. Relat. Phenom., 2000, 108, 1–11 CrossRef CAS.
- W. A. Chupka, J. Chem. Phys., 1993, 98, 4520 CrossRef CAS.
- M. Sander, L. A. Chewter, K. Müller-Dethlefs and E. W. Schlag, Phys. Rev. A, 1987, 36, 825.
- J. M. Hollas, High Resolution Spectroscopy, Butterworths, London, 1982 Search PubMed.
- C. K. Ingold and G. W. King, J. Chem. Soc., 1953, 2702 RSC.
Footnote |
| † Note that we assume that spin–orbit interaction in the cation can safely be neglected and we use the total angular momentum excluding electron spin N+ instead of the total angular momentum including spin J+. |
| This journal is © the Owner Societies 2004 |
