Electronic structure, Jahn–Teller dynamics and electron spin relaxation of two types of octahedral Cu(II) complexes in cadmium formate dihydrate Cd(HCOO)2·2H2O. EPR and ESE studies
Sylwia
Kiczka
,
Stanislaw K.
Hoffmann
*,
Janina
Goslar
and
Ludoslawa
Szczepanska
Institute of Molecular Physics, Polish Academy of Sciences, Smoluchowskiego 17, PL-60179, Poznan, Poland. E-mail: skh@ifmpan.poznan.pl; Fax: +48-61-8684-524; Tel: +48-61-8612-407
First published on 27th November 2003
Abstract
Cd(HCOO)2·2H2O single crystals weakly doped with Cu(II) ions have been studied by cw-EPR (4.2–300 K) and by electron spin echo – ESE (4.2–60 K). Copper(II) ions substitute Cd(II) in two different sites forming Cu(HCOO)6–Cuf and Cu(HCOO)2(H2O)4–Cuw octahedral complexes with strong preference to Cuf as shown by the intensity ratio of the EPR spectra (up to 20∶1). Despite different molecular structures both complexes have nearly identical EPR parameters at rigid lattice limit with gz![[thin space (1/6-em)]](https://www.rsc.org/images/entities/char_2009.gif) =2.429, gy=2.092, gx=2.064, Az=120, Ay=32 and Ax=12×10−4 cm−1 for Cuf. This fact as well as strong axial deformation of the crystal field at Cu(II) sites indicate that the strong Jahn–Teller effect operates producing three wells in the potential surface with one having much lower energy than the others. In the Cuf complex the dynamic J–T-effect has been observed as a vibronic averaging of the two g and A parameters (along z and y axes). It indicates that only one of the higher energy wells is thermally accessible and the Silver–Getz model leads to the average energy difference between the two lowest energy wells δ12=500(60) cm−1. The δ12 is temperature dependent. For Cuw complex no vibronic effects were observed in EPR spectra indicating that higher energy wells are not populated up to 300 K. The spin–lattice relaxation time T1 and phase memory time TM were measured up to 60 K only, because for higher temperatures the ESE decay was too fast. Spin–lattice relaxation is governed by two-phonon Raman processes which allow one to determine the Debye temperature of the crystal as ΘD=193 K. The ESE decay was described as V(2τ)=V0exp(−τ/b−mτ2) indicating the contribution of the spectral diffusion (quadratic term). The ESE dephasing rate 1/TM is governed by spectral diffusion below 15 K. For higher temperatures the T1-processes and excitations to the higher vibronic levels of energy Δ=166 cm−1 give comparable contributions.
=2.429, gy=2.092, gx=2.064, Az=120, Ay=32 and Ax=12×10−4 cm−1 for Cuf. This fact as well as strong axial deformation of the crystal field at Cu(II) sites indicate that the strong Jahn–Teller effect operates producing three wells in the potential surface with one having much lower energy than the others. In the Cuf complex the dynamic J–T-effect has been observed as a vibronic averaging of the two g and A parameters (along z and y axes). It indicates that only one of the higher energy wells is thermally accessible and the Silver–Getz model leads to the average energy difference between the two lowest energy wells δ12=500(60) cm−1. The δ12 is temperature dependent. For Cuw complex no vibronic effects were observed in EPR spectra indicating that higher energy wells are not populated up to 300 K. The spin–lattice relaxation time T1 and phase memory time TM were measured up to 60 K only, because for higher temperatures the ESE decay was too fast. Spin–lattice relaxation is governed by two-phonon Raman processes which allow one to determine the Debye temperature of the crystal as ΘD=193 K. The ESE decay was described as V(2τ)=V0exp(−τ/b−mτ2) indicating the contribution of the spectral diffusion (quadratic term). The ESE dephasing rate 1/TM is governed by spectral diffusion below 15 K. For higher temperatures the T1-processes and excitations to the higher vibronic levels of energy Δ=166 cm−1 give comparable contributions.
Introduction
Fluxionality,1 plasticity2 and flexibility3 of Cu(II) complexes are well known. These concepts have been introduced on the basis of extended structural, magnetic and EPR studies of copper compounds and Cu(II) doped diamagnetic crystals4 and are related, to a great extent, to the Jahn–Teller effect and vibronic dynamics. A unique opportunity to observe the effects related to these phenomena appears in the formates of divalent metals where, as a rule, two distinct Cu(II) complexes can exist. Moreover, formate compound crystals present a variety of interesting physical properties such as piro- and piezoelectricity, antiferroelectricity and antiferromagnetism. Hydrate and anhydrous inorganic formates have attracted considerable interest because they are suitable for practical applications and are currently used as precursors in composite ceramics and high Tc superconductors.5,6Dihydrated formates of divalent metal ions, like Cd, Cu, Zn, Fe, Mn and Ni are monoclinic and isostructural with a layered structure determining their two-dimensional properties. The formates of magnetic ions have two magnetic sublattices with relatively strong superexchange coupling transmitted via formate molecules (J=33 cm−1 for copper formate7) and display a transition to the antiferromagnetic ordering at subhelium temperatures.8,9
The diamagnetic cadmium(II) formate dihydrate, Cd(HCOO)2·2H2O, which has been studied in this work, crystallizes in P21/c symmetry with unit cell dimensions: a=0.8981, b=0.7391, c=0.9760 nm, β=97.32° and Z=4.10 A specific feature of the structure is the existence of two chemically and crystallographically distinct cadmium(II) sites: I-Cdf and II-Cdw with octahedral coordination of six oxygens. The structural unit is shown in Fig. 1. The Cdf is coordinated by six formate molecules with nearly uniform Cd–O distances (0.2248–0.2301 nm), whereas Cdw through four water oxygens and two formates with slightly less uniform Cd–O distances, varying from 0.2243–0.2326 nm. Thus, the centrosymmetric CdO6-octahedra are weakly tetragonally distorted with elongation along Cd–O of Cdf–Cdw bridging formate molecule as marked by z-axes in Fig. 1. There is also a small rhombic distortion of the main coordination plane differentiating the in-plane Cd–O bonds. The Cdf are linked by the four formate ligands into two-dimensional layers parallel to the bc-plane. The layers are sandwiched by Cdw complexes with two bridging formate molecules. This polymeric network is further strengthened by hydrogen bonds of about 0.275 nm length between water molecules and each of the formate oxygens.
 | ||
| Fig. 1 The structural unit consists of two centrosymmetric Cd-octahedra: I-Cd(formate)6=Cdf and II-Cd(formate)2(H2O)4=Cdw linked by common formate ligand. The cadmium complexes are weakly tetragonally distorted with local D2h-symmetry. In Cu(II) doped crystals copper ions substitute Cd(II) ions and the coordination octahedra are strongly distorted by Jahn–Teller effect, with elongation axis marked as z being simultaneously the principal EPR g-tensor axis. | ||
Paramagnetic ions introduced into a diamagnetic formate lattice substitute host divalent ions and allow separate EPR studies of electronic structure and dynamics of the two sublattice constituents. Such EPR studies have been performed for Cu(II) in Zn(HCOO)2·2H2O,7 Co(II) in Zn(HCOO)2·2H2O,11 Mn(II) in Zn(HCOO)2·2H2O,12,13 Mn(II) in Cd(HCOO)2·2H2O,14 VO(II) in Cd(HCOO)2·2H2O and in Pb(HCOO)2·2H2O,15 and hot ions Cd(I) in Cd(HCOO)2·2H2O.14 Radiation defects (formate radicals) have also been studied by EPR and ENDOR in various formates.16,17 The results of EPR studies of Cu(II) in Cd(HCOO)2·2H2O single crystals have already been published.18 Because of clear experimental errors (the crystal orientation was incorrect, thus the b-axis was not the symmetry axis of the angular dependence in the ab-plane; weak lines from Cuw complexes were missing because of a low crystal quality and strong background EPR line) and incorrect interpretation, the results (two inequivalent sites of Cuf complexes were interpreted as Cuf and Cuw sites) are not reliable and this had motivated us to perform detailed EPR studies of this system and to enrich them with electron spin echo relaxation measurements.
It is well known that Cu(II) ions in a high-symmetry environment undergo the Jahn–Teller effect.3 Thus, for Cu(II) in Cd(HCOO)2·2H2O crystals such an effect can be expected, since both types of the CdO6-octahedra are only weakly distorted from a regular structure. A very small rhombic distortion suggests that we can deal with a specific pseudo-Jahn–Teller effect in a three well potential having one deep well and two excited wells of approximately the same energy. Thus, in this crystal an unique possibility exists to study two different environments of Jahn–Teller active Cu(II) ions in the same lattice and to observe the influence of their dynamics on spin relaxation of the unpaired electrons. In this paper we present the results of cw-EPR and pulsed EPR (electron spin echo) studies of electronic structure and dynamics of Cu(II)-complexes in the temperature range 4–300 K.
Experimental
Cadmium (II) formate dihydrate, C2H6O6Cd, was prepared by dissolving CdCO3 in slight excess of aqueous formic acid. The crystals were obtained by evaporation of a saturated aqueous solution at room temperature. Crystals grow as colourless plates of a few millimetre dimensions with a well developed (100)-plane, determined by Cd-formate layers, and elongated along the [010]-direction (see inset of Fig. 3). To dope the crystals with Cu(II) ions a small amount (about 0.1 wt.%) of copper formate tetrahydrate was added to the mother solution. The level of doping in the single crystals was determined from integral intensity of EPR spectra as 1017–1019 ions gram−1. The low-doped crystals were used for ESE measurements of electron spin relaxation, whereas the high-doped crystals were used for cw-EPR measurements of the weak EPR spectral lines. The level of doping was small enough to minimize spectral diffusion in ESE experiments and pairing of Cu(II) ions which was observed in some cw-EPR measurements.7Cw-EPR measurements were performed on a Radiopan SE/X-2547 spectrometer with an Oxford ESR900 flowing helium cryostat, and pulsed EPR experiments were performed on a Bruker ESP380E FT/CW spectrometer with an Oxford CF935 cryostat, in the temperature range 4–300 K. Single crystal EPR rotational data were collected at 77 K in the reference frame a, b, c*=a×b with alignment of the crystal under optical microscope prior to the experiments. The temperature dependence of the EPR spectrum was measured along the principal directions of the g2-tensor.
Electron spin relaxation experiments were performed on single crystals by excitation of the single hyperfine line mI=−3/2 in the crystal orientation close to the z-axis of the g2-tensor. The short tp=16 ns pulses with spectral bandwidth 1.207/tp=75 MHz=2.68 mT19 were used, since they were able to excite the whole line having linewidth ΔBpp=0.9 mT at this crystal orientation. The spin–lattice relaxation time T1 was determined using the saturation recovery method with the 16 ns saturation pulse. The full saturation was achieved in the whole temperature range. The magnetization recovery was monitored by the Hahn-type ESE signal generated by two 16 ns pulses with interpulse interval 176 ns. The electron spin echo dephasing described by the phase memory time TM was determined from Hahn echo amplitude decay, after excitation by two 16 ns pulses. The decay was strongly modulated with NMR frequencies of surrounding magnetic nuclei and was approximated by two-component exponential decay function with details described below.
Results and discussion
EPR spectra and spin-Hamiltonian parameters
The EPR spectrum of Cu(II) in Cd(HCOO)2·2H2O consists of four sets of hyperfine quartets according to the Z=4 in monoclinic symmetry. The single crystal spectrum recorded along the b-axis is shown in Fig. 2, where the powder spectrum is also presented. The unusual fact is that the intensity ratio of the lines from two chemically inequivalent copper(II) complexes ranges from 20∶1 to 8∶1 depending on the crystal growth conditions. The strong lines can be assigned as originating from Cuformate complexes by a comparison with data published for other formate crystals.7,20 This assignment is confirmed by comparison of the direction cosines of the EPR g-tensor z-axis (elongation axis) for the Cuf and Cuw complexes with the CdI–O4 and CdII–O3 bond directions of host cadmium complexes (see Table 1). Thus, the Cu(II) ions prefer to substitute Cdf-ions in sites located within the formate layers where they are coordinated by six formate molecules. Such behaviour had already been observed for two Cu(II) sites in Zn(HCOO)2·2H2O7 and for VO(II) in Cd(HCOO)2·2H2O,20 but equal population of the different sites was observed for Co(II) in Zn(HCOO)2·2H2O,11 whereas in some papers the weak lines from Cdw sites were missing.18,21
 | ||
| Fig. 2 EPR spectra recorded at liquid nitrogen temperature 77 K: (a) Single crystal spectrum along the crystal b-axis. Hyperfine quartets from two different type complexes are marked. The intensity of the Cuf spectrum is about 20 times stronger than that for Cuw-complexes. The Cuf-complex spectrum is complicated by forbidden transition lines close to the perpendicular orientation. (b) Powder EPR spectrum showing the lines from Cuf-complexes. | ||
| Cu(formate)6-complex I | ||||||
|---|---|---|---|---|---|---|
| EPR parameters | Direction cosines | Angles/degree | ||||
| a | b | c* | a | b | c* | |
|
g
x
=2.064(3), Ax=12(2) |
±0.1888 | 0.6707 | ±0.7173 | 79 | 48 | 44 |
|
g
y
=2.092(3), Ay=32(3) |
0.4448 | ±0.5988 | −0.6713 | 64 | 53 | 132 |
|
g
z
=2.429(1), Az=120(2) |
0.8755 | ∓0.4458 | 0.1864 | 29 | 64 | 80 |
| Bond directions | ||||||
| CdI–O(2) | 0.4064 | −0.8115 | −0.4199 | 66 | 36 | 65 |
| CdI–O(1) | 0.2845 | −0.3148 | −0.9055 | 74 | 72 | 162 |
| CdI–O(4) | 0.8563 | 0.5144 | −0.0454 | 31 | 59 | 92 |
| Cu(formate)2(H2O)4-complex II | ||||||
|---|---|---|---|---|---|---|
|
g
x
=2.067(4), Ax=15(3) |
±0.7892 | −0.3475 | ∓0.5063 | 38 | 110 | 120 |
|
g
y
=2.089(4), Ay=31(4) |
−0.5823 | ∓0.1616 | −0.7968 | 126 | 99 | 143 |
|
g
z
=2.417(1), Az=133(2) |
−0.1951 | ∓0.9236 | 0.3300 | 101 | 157 | 71 |
| Bond directions | ||||||
| CdII–O(5) | −0.9547 | −0.0447 | 0.2940 | 17 | 87 | 73 |
| CdII–O(6) | 0.2548 | 0.3757 | 0.8910 | 75 | 68 | 27 |
| CdII–O(3) | −0.1929 | 0.9202 | −0.3404 | 101 | 23 | 70 |
The EPR lines are relatively broad at room temperature (linewidth ΔBpp=3.3 mT) producing a badly resolved spectrum. The lines narrow considerably on cooling thus, angular variation of the spectrum was recorded at 77 K (linewidth ΔBpp=0.9 mT) and it is shown in Fig. 3. Fitting of the angular variation data to the g2 and gA2g-tensors with second order corrections gives solid lines in Fig. 3 and spin-Hamiltonian parameters listed in Table 1.
 | ||
| Fig. 3 Angular variations of hyperfine EPR line positions at 77 K for Cuf and Cuw complexes. The solid lines are plotted using g-factors and A-splittings of Table 1. Inset shows the single crystal habit. | ||
The g-factors and hyperfine splittings A are unexpectedly almost identical for both the sites Cuf and Cuw. This is clearly visible in the powder spectrum (Fig. 2b), where the lines of two complexes are superimposed. The large axial deformation of both complexes (gz≫gy, gx) indicates that the deformation is produced by the strong Jahn–Teller effect. The nearly octahedral host Cd–O6 octahedra are strongly tetragonally distorted when Cd(II) is substituted by Cu(II). Thus, Cu(II) ions readjust the molecular environment but surprisingly in such a way, that despite the different molecular structure of the Cuf and Cuw complexes they display the same crystal field strength and symmetry. It is worth noting, that the g-factors and A-splittings are very similar to those of Cu(II) in Tutton salt crystals in the rigid lattice limit (for example: gz=2.432, gy=2.105, gx=2.074, Az=120, Ay=14, Ax=37×10−4 cm−1 for Cu(II) in (NH4)2Mg(SO4)2·6H2O;22gz=2.443, gy=2.134, gx=2.069, Az=112, Ay=10, Ax=46×10−4 cm−1 for Cu(II) in Cs2Zn (SO4)2·6H2O23), which are known as undergoing the strong Jahn–Teller effect with static complex deformation at low temperatures. This suggests that the geometry of the doped Cu(II) complexes is determined mainly by the Jahn–Teller effect with the strong vibronic coupling.
Electronic structure of Cu(II) complexes
The g2 and A2 tensors are collinear and the direction cosines of their principal axes listed in Table 1 show that the main symmetry axis, marked as the z-axis in Fig. 1, is along the Cd–O bonds linking both types of cadmium octahedra. The other two axes i.e.x and y do not fit the other Cd–O directions. This indicates a rotation of the crystal field axes in rhombic symmetry. The low symmetry effects are visible also in perpendicular orientations of both complexes, as strong forbidden lines in the spectrum with intensity higher than that of the main transitions.Assuming D2h crystal field symmetry, the Cu(II) orbitals in the MO-approximation can be written as:24
| ψ1(Ag)=α|x2−y2〉−γΦL(Ag) ψ2(Ag) ψ3(B1g) ψ4(B2g) ψ5(B3g) | (1) |
−y2〉 ground state without a possible admixture of |z2〉-orbital because the gx>2.04. The spin-Hamiltonian parameters for antibonding orbitals eqn. (1) are:24,25 | (2) |
 | (3) |
=0.036 cm−1 describes the radial extension of the d-wavefunction of the Cu(II) ion, Δgi=gi−2.0023 and Eij are orbital splittings. For calculation of the MO-coefficients it is necessary to consider the signs of the Ai-parameters. Az is negative for |x2−y2〉 ground state, whereas the signs of Ay and Ax cannot be assumed a priori. The α2 and Fermi constant κ can be calculated from the hyperfine splitting of eqn. (3):  | (4) |
080 cm−1 with a shoulder at about 11700 cm−1, whereas the published data are: Exz,yz=13200 cm−1, Exy=11200 cm−1, Ez2=9200 cm−1 for copper formate tetrahydrate.26 Only the combination with the three negative Ai-values can be rejected as giving a too high Fermi constant. The resulting parameters obtained as an average from three other possible sign combinations, with Az<0, for both types of copper(II) complexes are summarized in Table 2. The MO-parameters and Fermi constant are typical for Cu(II)-complexes, although the β′2 is relatively small due to a spin delocalisation viayz-orbital, indicating an interaction with apical, asymmetrically located formate ligand.
| α | β 21 | β 2 | β′2 | κ | E xy | E xz | E xz |
|---|---|---|---|---|---|---|---|
| 0.88(5) | 0.84(5) | 0.84(5) | 0.60(5) | 0.33(6) | 11500 |
13000 |
13400 |
Temperature variation of spin-Hamiltonian parameters due to dynamic Jahn–Teller effect
Temperature affects the g-factors and A-splittings of anhydrous Cu(HCOO)6 complex only, whereas the parameters of the hydrated complex II-Cuw are temperature independent. The temperature dependence of g and A for Cuf is shown in Fig. 4a,b. This is a typical behaviour resulting from thermal averaging of the g- and A-tensor by the dynamic Jahn–Teller effect while phonon induced reorientations exist between two of the three Jahn–Teller distorted configurations only, like in the Tutton salt crystals.22,27 This is surprising, since one could expect that the two configurations related to the x- and y-axis will be nearly equivalent as suggested by the molecular structure of host Cd-complexes and a relatively small (gy−gx) difference of Cu(II). Temperature independence of the gx indicates that the potential well in the adiabatic potential surface along the x-axis has much higher energy than the other two wells. It means that the coordination bond is considerably the strongest and thus, the bond length is shortest along the x-direction as compared to the y-direction. These directions only very approximately fit the host Cd–O bond directions (see Table 1) confirming strong in-plane deformation. It should be noticed that the Jahn–Teller effect enhances the initial deformations existing in host cadmium complexes (see Fig. 1) both for Cuf and Cuw. Although the Jahn–Teller effect produces similar deformations in Cuw complex the vibronic averaging of the g and A parameters is not observed. It points out that the energy barriers between Jahn–Teller distorted configurations are much higher as compared to Cuf and the higher energy configurations are not accessible even at room temperature.
 | ||
| Fig. 4 Temperature dependence of the g-factors and hyperfine splittings A for Cu(formate)6 complexes. The solid lines are plotted according to the Silver–Getz model describing vibronic averaging of spin-Hamiltonian parameters. | ||
The model describing the g-factor averaging by vibronic dynamics in the dynamic Jahn–Teller effect has been proposed by Silver and Getz28 and Riley et al.29 The model assumes that the observed g-factors are weighted averages of the three potential wells produced by Jahn–Teller effect. When fractional populations of the wells are N1, N2 and N3
(N1+N2+N3=1) then experimental g-factors can be calculated as:22,30
| gz=N1gz1+N2gy2+N3gx3 gy gx | (5) |
Moreover, the model assumes that: (a) the g-factors are identical in all three configurations and reorientations result in an interchange of the x, y, and z-axes only; (b) the population of the wells is described by Boltzmann statistics; (c) the shape of adiabatic potential surface and thus, the energy difference between the wells are temperature independent. Thus, the populations are:
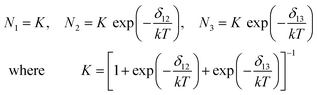 | (6) |
For the Cuf complex we can assume N3=0, and by taking the gzi=2.429 and gyi=2.092 (i=1, 2) from Table 1, the g-factor temperature dependences and energy difference δ12 can be calculated. The results are shown as lines in Fig. 4a and the average energy value is δ12=500 (±60) cm−1. Assuming that A-splittings are influenced by g-factor variations only the plots of the A(T) dependences are shown in Fig. 4b. The calculated δ12 values are shown in Fig. 5 for temperatures higher than 100 K, where the variations in g and A parameters are measurable. It is clearly seen that δ12 is not constant over the whole temperature range, indicating a restricted validity of the used model which assumes temperature independence of δ12. Moreover, a few vibronic levels of energy lower than δ12 are expected in the deepest potential well with typical splitting order of 100 cm−1.29 As a result the overbarrier jumps or phonon induced tunneling to the higher energy well can appear via few intermediate states modifying effective δ12-value. As one can see from Fig. 4b the average value of Az and Ay decreases slightly with temperature. It can be a result of the increase in unpaired electron delocalisation (a decrease in the α2 MO coefficient) in the ground state. Thus, the phonon induced tunneling is more probable as in the case of K2Zn(SO4)2·6H2O: Cu(II).27
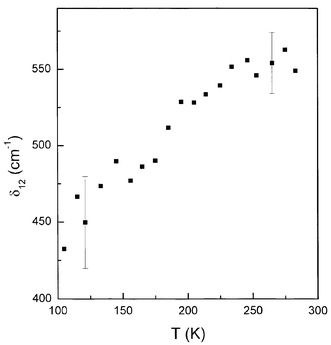 | ||
| Fig. 5 Energy difference δ12 between the two lowest energy potential wells vs. temperature, calculated from Silver–Getz model. | ||
Electron spin–lattice relaxation
Relaxation time measurements applying an electron spin echo (ESE) signal were performed up to 55 K only. Above this temperature ESE decay after excitation becomes very fast and hidden in the dead time (about 80 ns) of the spectrometer. The recovery of the magnetization after the saturating pulse was single exponential in the whole temperature range 4–55 K as it is shown in the inset of Fig. 6 for T=32 K. The relaxation rate 1/T1 strongly increases with temperature and the variations are shown in Fig. 6 for both the Cu-complexes. The increase is more than four-orders of magnitude indicating a very effective relaxation process which can be identified as Raman two-phonon process. Indeed, the experimental temperature dependence was well fitted by equation  | (7) |
∝cosech(Δ/kT) which is linear for kT>Δ.
 | ||
| Fig. 6 Temperature dependence of the spin–lattice relaxation rate. The inset shows magnetization recovery after saturation, monitored by ESE amplitude, with exponential fit (solid line) at 32 K. | ||
The second term with characteristic T9-dependence describes a Raman two-phonon relaxation process for Kramers transitions with I8 being the transport integral over the whole phonon spectrum.32 Assuming the Debye-type phonon spectrum with cut-off temperature ΘD the transport integral can be written as
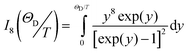 | (8) |
≡ΘD/T in the range 0.1–40 the I8-integral can be approximated by two expressions suitable for computer fitting procedures:
for x=0.1–16.6
| I8=exp{A0+A1 ln x+A2(ln x)2+A3(ln x)3+…+A9(ln x)9} |
=−2.00976, A1=6.87231, A2=−0.12936, A3=−0.0788, A4=−0.03222, A5=−0.01593, A6=−0.00549, A7=9.85532·10−4, A8=6.21152·10−4, A9=−1.857·10−5,
and for x=16.6–40.0
| I8=a0+a1 exp[−(x−x0)/t1] |
=40486.52036, x0=15, a1=−1534.32091, t1=1.79496.
The best fit to eqn. (7) using these expressions (written in Y-script) and the fitting subroutine of ORIGIN 7.0 has given parameters a, b and ΘD summarized in Table 3. The fits are shown as solid lines in Fig. 6.
| Spin–lattice relaxation
|
|||
|---|---|---|---|
| Complex | a/K−1 s−1 | b/K−9 s−1 | Θ D/K |
| I=Cu(formate)6 |
12 | 1.3×10⁻¹² |
193 |
| II=Cu(formate)2(H2O)4 |
85 | 0.7×10⁻¹² |
193 |
| Phase relaxation
|
|||
|---|---|---|---|
| Complex | (1/TM)0/s−1 | c/s−1 | Δ/cm−1 |
| I=Cu(formate)6 |
1.7×10⁶ |
5.7×10⁷ |
166(3) |
| II=Cu(formate)2(H2O)4 |
0.4×10⁶ |
1.3×10⁷ |
166(3) |
As it was expected the fits display identical Debye temperature 193 K for Cuf and Cuw but slightly different a and b parameters. The higher b-value for Cuf and thus, faster relaxation at high temperatures is due to the larger electron–phonon coupling for Cu(formate)6 complexes located within the formate layers as compared to the hydrated Cuw complex linked to those layers. The larger a-coefficient value for Cuw indicates a larger disorder in the sublattice of the hydrated Cu-complexes.
Electron spin echo dephasing (phase relaxation)
The electron spin echo amplitude V decreases when interpulse interval τ increases. This decay is strongly modulated for both types of Cu(II) complexes in Cd(HCOO)2·2H2O as it is shown in Fig. 7 for Cuw-complex at 15.8 K. Thus V(t)=VdecayVmod and these two contributions have to be separated.
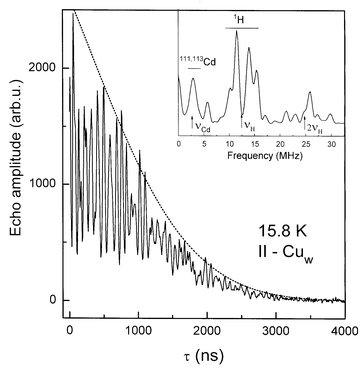 | ||
| Fig. 7 Electron spin echo amplitude decay for Cu(formate)2(H2O)4 complex at 15.8 K. Strong modulations of the decay arise from the proton 1H and 111,113Cd magnetic nuclei surrounding Cu-centres, as shown by the FT-ESE spectrum in the inset. The dotted line is the decay function V(τ)=V0exp(−τ/b−mτ2). | ||
The decay function was exponential and well fit to the expression
 | (9) |
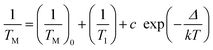
=2b which grows with temperature. Computer fitting was performed as described in detail in ref. 25 and it is shown as the dotted line in Fig. 7. The quadratic term is characteristic for nuclear and electron spectral diffusion dephasing processes which depend on a distribution of magnetic nuclei and unpaired electron in a sample, respectively. This contribution is expected to be practically temperature independent except for a small effect from crystal thermal expansion. Linear dependence can result from instantaneous diffusion produced by the refocusing microwave pulse within spins excited by the first pulse. This contribution is temperature independent. The linear dependence can arise also from thermal motions with TM depending on temperature.
An effective phase memory time resulting from two-component decay of ESE is defined as the time when V(t) dependence falls down to the V0/e value. This TM was determined from experimental results with relatively a low accuracy owing to the strong modulation, with the error of about 15% at low temperatures and of about 30% at high temperatures, where most of the decay is hidden in the dead time of the spectrometer.
After subtraction of Vdecay from the total decay function the modulation function was obtained. Its Fourier transform delivers the pseudo-ENDOR spectrum containing peaks at main and harmonic frequencies of nuclei surrounding the paramagnetic centre. The FT-ESE spectrum for the Cuw-complex is shown as the inset in Fig. 7. The spectrum displays peaks at proton frequencies around 12.7 MHz with splittings at 2.44 and 5.13 MHz from the nearest protons and overtones around 25.9 MHz. Moreover, weaker peaks are located at low frequencies at 2.9 MHz with overtone at 5.6 MHz and can be identified as due to magnetic isotopes 111,113Cd with total natural abundance of about 25%.
The phase memory time varies with temperature and the dephasing rate 1/TM is shown in Fig. 8 and Fig. 9 for Cuf and Cuw complexes, respectively, where they are compared with the spin–lattice relaxation rate. 1/TM depends more weakly on temperature than 1/T1. After the temperature independent region below 15 K, where the mτ2 term in decay function dominates, the ESE dephasing accelerates on heating. In this temperature range 1/T1 approaches 1/TM, being one order of magnitude shorter only at about 50 K. Thus, a contribution from T1-type relaxation processes is expected. Moreover, molecular motions can also contribute.33–35 Matrix molecule motion is expected to produce an averaging of the local magnetic fields on heating producing spin-packet narrowing and thus, slowing down the dephasing rate. This has not been observed in our crystal. Thermal motions of paramagnetic centres can produce an opposite effect. For considerable g-factor and A-splitting anisotropy, like for Cu(II) ions, the jumps, rotations or librations of Cu(II) complex can produce time dependent shifts Δg(t) and ΔA(t) resulting in broadening of the spin-packet on heating observed as an acceleration of the dephasing rate. Thus, the temperature dependence of the dephasing rate can be written as
 | (10) |
 | ||
| Fig. 8 ESE dephasing rate 1/TM and spin–lattice relaxation rate 1/T1vs. temperature for Cuf-complex. The dashed line indicates the contribution of T1-processes to ESE dephasing. | ||
 | ||
| Fig. 9 ESE dephasing rate 1/TM and spin–lattice relaxation rate 1/T1vs. temperature for Cuw-complex. The dashed line indicates the contribution of T1-processes to ESE dephasing. | ||
Fits to eqn. (10) give solid lines at 1/TM plots in Fig. 8 and Fig. 9 where the dashed lines show contributions from 1/T1. It should be noted that ESE decay due to T1-processes is clearly described as V(2τ)=Voexp(−τ/b)k with k=1, whereas existing theories predict k=2 or k=3/2.37–39 The parameters for Cuf and Cuw complexes are summarized in Table 3. One can see that contributions from spin–lattice relaxation processes and from Cu-complex dynamics are comparable. The parameters (1/TM)0, c and Δ are not strongly different for both complexes and are typical for Cu(II) complexes exhibiting the Jahn–Teller effect, as we had observed previously.22,27,34,40 The same value of Δ=166 cm−1 for both types of Cu-complexes suggests that the dynamic process producing ESE dephasing operates in the deepest potential well but not between the wells, since for Cuw the higher energy well is not accessible at room temperature, whereas for Cuf the higher energy well is populated as we observed by vibronic g-factor averaging. Thus, we can conclude that the Δ is not an energy barrier but rather the splitting of the vibronic levels.
Conclusions
It is well known that Cu(II) complexes can have strongly distorted geometry by Jahn–Teller effect and stabilized by crystal forces. In Cd(HCOO)2·2H2O this effect is very convincingly visible as a strong identical deformation of two different type Cu-complexes of initially very weakly deformed host CdO6 octahedra. The Jahn–Teller effect usually enhances the weak initial deformations and the resulting distorted configurations have very different energies. Vibronic averaging of the EPR parameters, produced by Jahn–Teller dynamics, appears only for Cu(formate)6 complex and allows determining the energy of the higher energy potential well as δ12=500 cm−1. The temperature dependence of the ESE dephasing gives the vibronic level energy in the potential well as 166 cm−1.Thus, the g-factor temperature behaviour and electron spin relaxation are complementary methods in determining energies of the potential wells (configurations) produced by the Jahn–Teller effect. Electron spin–lattice relaxation is usually governed by two-phonon Raman processes and gives the Debye temperature of the crystal as ΘD=193 K which has so far been unknown for this crystal.
References
- B. J. Hathaway, Struct. Bonding, 1984, 57, 56.
- J. Gazo, Pure Appl. Chem., 1974, 38, 279 CAS.
- I. B. Bersuker, Electronic structure and properties of transition metal compounds, Wiley, New York, 1996 Search PubMed.
- B. J. Hathaway and D. E. Billing, Coord. Chem. Rev., 1970, 5, 143 CrossRef CAS.
- H. Yoshimoto, Y. Miura, A. Osaka, H. Kawaki and S. Ohmori, J. Mater. Sci., 1990, 25, 531.
- D. Vega, G. Polla, A. G. Leyva, H. Lauza, P. K. Perazzo, R. Baggio, M. R. Benyacar, J. Ellena, H. Tolendino and M. C. Martins Alves, J. Solid State Chem., 1999, 147, 545 CrossRef CAS.
- G. R. Wagner, R. T. Schumacher and S. A. Friedberg, Phys. Rev., 1966, 150, 226 CrossRef CAS.
- G. R. Hoy, S. de S. Barros, F. de S. Barros and S. A. Friedberg, J. Appl. Phys., 1965, 36, 936.
- M. Matsura, K. Koyama and Y. Murakami, J. Phys. Soc. Jpn, 1985, 54, 2714 Search PubMed.
- M. L. Post and J. Trotter, Acta Crystallogr., Sect B, 1974, B 30, 1880 CrossRef.
- H. Abe, J. Phys. Soc. Jpn, 1977, 43, 82 Search PubMed.
- H. Morigaki and H. Abe, J. Phys. Soc. Jpn, 1967, 23, 462 Search PubMed.
- J. C. Bissey, J. Lissayou and Y. Servant, J. Magn. Magn. Mater., 1986, 59, 5 CrossRef CAS.
- R. J. Booth and F. G. Herling, J. Chem. Phys., 1974, 60, 2773 CAS.
- H. Kalkan and F. Koksal, Solid State Commun., 1998, 105, 307 CrossRef CAS.
- E. F. Orsega and C. Corvaya, J. Mol. Struct., 1977, 40, 211 CrossRef CAS.
- M. V. V. S. Reddy, K. V. Lingam and T. K. G. Rao, J. Mol. Struct., 1981, 73, 105 CrossRef CAS.
- H. Kalkan and F. Koksal, Solid State Commun., 1997, 103, 137 CrossRef CAS.
- A. Schweiger and G. Jeschke, Principles of pulsed electron paramagnetic resonance, Oxford University Press, New York, 2001 Search PubMed.
- H. Kalkan and F. Koksal, Phys. Status Solidi B, 1998, 205, 651 CrossRef CAS.
- D. J. E. Ingram, Phys. Rev., 1953, 90, 711 CrossRef CAS.
- S. K. Hoffmann, J. Goslar, W. Hilczer, M. A. Augustyniak and M. Marciniak, J. Phys. Chem. A, 1998, 102, 1697 CrossRef CAS.
- S. K. Hoffmann, R. Kaszynski, M. A. Augustyniak and W. Hilczer, Acta Phys. Pol., A, 1999, 96, 733 Search PubMed.
- B. R. McGarvey, in Transition Metal Chemistry, ed. R. L. Carlin, Dekker, New York, 1966, vol. 3 Search PubMed.
- D. Attanasio, J. Magn. Reson., 1977, 26, 81 CAS.
- D. E. Billing and B. J. Hathaway, J. Chem. Soc. A, 1968, 1516 RSC.
- S. K. Hoffmann, J. Goslar, W. Hilczer and M. A. Augustyniak-Jablokow, J. Phys.: Condens. Matter, 2001, 13, 707 CrossRef CAS.
- B. L. Silver and D. Getz, J. Chem. Phys., 1974, 61, 638 CrossRef CAS.
- M. J. Riley, M. A. Hitchman and A. W. Mohammed, J. Chem. Phys., 1987, 87, 3766 CrossRef CAS.
- M. A. Hitchman, Y. V. Yablokov, V. E. Petrashen, M. A. Augustyniak-Jablokow, H. Stratemeier, M. J. Riley, K. Lukaszewicz, P. E. Tomaszewski and A. Pietraszko, Inorg. Chem., 2002, 41, 229 CrossRef CAS.
- S. K. Hoffmann, W. Hilczer, J. Goslar, S. Kiczka and I. Polus, Phys. Chem. Chem. Phys., 2002, 4, 4944 RSC.
- Y. Zhou, B. E. Bowler, G. R. Eaton and S. S. Eaton, J. Magn. Reson., 1999, 139, 165 CrossRef CAS.
- S. K. Hoffmann, W. Hilczer, J. Goslar, M. M. Massa and R. Calvo, J. Magn. Reson., 2001, 153, 92 CrossRef CAS.
- S. K. Hoffmann, J. Goslar, W. Hilczer, M. A. Augustyniak-Jablokow and S. Kiczka, J. Magn. Reson., 2001, 153, 56 CrossRef CAS.
- A. Barbon, M. Brustolon, A. L. Maniero, M. Romanelli and L.-C. Brunel, Phys. Chem. Chem. Phys., 1999, 1, 4015 RSC.
- J. R. Klauder and P. W. Anderson, Phys. Rev., 1962, 125, 912 CrossRef CAS.
- W. B. Mims, Phys. Rev., 1968, 168, 370 CrossRef CAS.
- P. Hu and S. R. Hartmann, Phys. Rev. B, 1974, 9, 1 CrossRef.
- S. S. Eaton and G. R. Eaton, in Distance measurements in biological systems by EPR. Biological magnetic resonance, ed. L. J. Berliner, S. S. Eaton and G. R. Eaton, Kluwer, New York, 2000, vol. 19, ch. 2 Search PubMed.
- S. K. Hoffmann, J. Goslar, W. Hilczer, R. Kaszynski and M. A. Augustyniak-Jablokow, Solid State Commun., 2001, 117, 333 CrossRef CAS.
| This journal is © the Owner Societies 2004 |