Heterogeneous reaction of ozone with liquid unsaturated fatty acids: detailed kinetics and gas-phase product studies
T. Thornberry†* and J. P. D. Abbatt
Department of Chemistry, University of Toronto, Toronto, ON, Canada. E-mail: tthornberry@al.noaa.gov; Fax: 303/497-5373; Tel: 303/497-3373
First published on 3rd December 2003
Abstract
Detailed kinetics and product yield studies have been performed for the heterogeneous reaction between gas-phase ozone and three liquid fatty acids using a coated-wall flow tube and chemical ionization mass spectrometry. Gas-surface reaction probabilities for ozone loss of (8.0![[thin space (1/6-em)]](https://www.rsc.org/images/entities/char_2009.gif) ±1.0)×10−4, (1.3±0.1)×10−3, and (1.8±0.2)×10−3 have been measured at room temperature (298 K) for oleic acid, linoleic acid and linolenic acid, respectively. The temperature dependence of the uptake coefficients was found to be small and positive. Comparison of these results to the kinetics of the equivalent gas-phase reactions implies that there is a definite enhancement in the rate for the heterogeneous process due to entropic factors, i.e. due to collisional trapping of ozone in the surface layers of the liquid, and a possible effect on the activation energy of the reaction. For linoleic acid, the reaction probability was found to be independent of relative humidity (up to 55%), to ±10%, at 263 K. Volatile reaction products were observed using proton-transfer-reaction mass spectrometry. Nonanal was observed with a 0.50 (±0.10) yield for the reaction with oleic acid, whereas hexanal and nonenal were observed for linoleic acid with 0.25 (±0.05) and 0.29 (±0.05) yields, respectively. These results indicate that the primary ozonide formed initially in the reaction can decompose via two equal probability pathways and that a secondary ozonide is not formed in high yield in the aldehydic channel. These reactions represent a source of oxygenates to the atmosphere and will modify the hygroscopic properties of aerosols.
±1.0)×10−4, (1.3±0.1)×10−3, and (1.8±0.2)×10−3 have been measured at room temperature (298 K) for oleic acid, linoleic acid and linolenic acid, respectively. The temperature dependence of the uptake coefficients was found to be small and positive. Comparison of these results to the kinetics of the equivalent gas-phase reactions implies that there is a definite enhancement in the rate for the heterogeneous process due to entropic factors, i.e. due to collisional trapping of ozone in the surface layers of the liquid, and a possible effect on the activation energy of the reaction. For linoleic acid, the reaction probability was found to be independent of relative humidity (up to 55%), to ±10%, at 263 K. Volatile reaction products were observed using proton-transfer-reaction mass spectrometry. Nonanal was observed with a 0.50 (±0.10) yield for the reaction with oleic acid, whereas hexanal and nonenal were observed for linoleic acid with 0.25 (±0.05) and 0.29 (±0.05) yields, respectively. These results indicate that the primary ozonide formed initially in the reaction can decompose via two equal probability pathways and that a secondary ozonide is not formed in high yield in the aldehydic channel. These reactions represent a source of oxygenates to the atmosphere and will modify the hygroscopic properties of aerosols.
Introduction
Much of the current research emphasis on organic aerosol chemistry is motivated by the possibility for aerosol particle chemical modification via heterogeneous processes. Indeed, a number of laboratory studies have illustrated that the organic component of tropospheric aerosols is susceptible to reaction with gas-phase oxidants. Early studies focused on the reaction of OH with organic substrates. In particular, it was shown that OH reacted very efficiently with malonic acid surfaces with a reported uptake coefficient of 0.17.1 Also, the uptake coefficient of OH on solid ammonium sulfate surfaces exposed to 1-hexanol was measured to be larger than 0.2 whereas the bare ammonium sulfate surface exhibited OH uptake coefficients two orders of magnitude lower.2 More recently, the loss rates of OH on a range of organic substrates were all shown to be close to unity in a detailed coated-wall study.3 The products from oxidation of this type, particular;y in the presence of gas-phase NOx and O2, have yet to be determined.In addition to studies with OH, the role of O3 as an oxidant has also been investigated. Initially, a coated-wall study showed that ozone is irreversibly lost with large uptake coefficients of between 10−4 and 10−2 for a wide range of unsaturated organic liquids, whereas its loss rate on saturated species was much lower.4 These general results have since been confirmed by a number of groups using a range of techniques. In particular, oleic acid, an 18-carbon unsaturated fatty acid:

For an uptake coefficient of 10−3 and with realistic assumptions about the unsaturated organic content of tropospheric aerosols, the loss of ozone via heterogeneous processes of this type is unlikely to represent a significant ozone loss process in the atmosphere, except perhaps near strong aerosol sources.11 However, the atmospheric importance of this chemistry may arise through the products, both gas- and condensed-phase, that are formed.3,8–13 In the case of oleic acid, it has been reported that nonanal is formed as a gas-phase product in coated-wall flow tube studies using electron-impact ionization mass spectrometric detection.8 Similarly, there are experiments that have indicated that condensed-phase azelaic acid and 1-oxononanoic acid may also form, although definitive identification of condensed-phase products has been hindered to some degree by the somewhat non-specific detection techniques used to date.8–10 These initial studies of product formation are highly significant in light of field measurements of species such as nonanal and azelaic acid. In particular, within homologous series of gas-phase aldehydes and particle-borne dicarboxylic acids that are measured in the field, both nonanal and azelaic acid amounts, respectively, are anomalously high.14–23 It has been hypothesized that the source of these species are ozonolysis processes of the type described in this paper.24,25
Added motivation for this work comes from the use of unsaturated fatty acids as a surrogate for organic materials found in living organisms, such as the phospholipid membranes that line human breathing passages and in the stomata of plants.26,27 Along with other pollutants, it is known that ozone is a significant respiratory irritant and may contribute to the correlations that have been observed between air quality and human health. To investigate the chemistry that might occur when ozone is inhaled, a landmark study involved the exposure of 1-palmitoyl-2-oleoyl-sn-glycero-3-phosphocholine, which formed a monolayer-thick film on aqueous solutions in a Langmuir trough, to low levels of ozone.26,27 It was observed that ozone exhibited significant reactivity on this surface and nonanal was observed as a gas-phase reaction product.
In this paper we address a number of uncertainties in the kinetics and mechanism of the loss of gas-phase ozone with unsaturated fatty acids. Specifically, we have used chemical ionization mass spectrometry to selectively detect both ozone loss and the production of oxygenated volatile organics. This has allowed us to more confidently identify the gas-phase products from the reaction of ozone with oleic, linoleic, and linolenic acids. All three fatty acids, especially oleic acid, are commonly found as components of plant and animal membranes, and they can become part of tropospheric particulate matter through bubble breaking at the surface of natural waters, leaf abrasion, and anthropogenic activities such as grilling and frying.5,6,12,28–31 We have also paid particularly close attention to calibrating the sensitivity of our mass spectrometry system to the gas-phase products in order to accurately measure product yields. Along with temperature-dependent measurements of the ozone reaction probabilities, we also report the first studies of the relative humidity dependence of the kinetics.
The motivation for these specific studies is two-fold. First, from an atmospheric perspective, we have focused strongly on identification and quantification of gas-phase product yields in order to better assess the significance of these ozonolysis processes as sources of volatile oxygenates. Similarly, we have examined the temperature and relative humidity dependence of the kinetics to better represent typical ambient conditions. Second, this class of heterogeneous reactions, where the chemical interactions are likely to occur at the liquid surface, are interesting from a fundamental reactivity perspective. By careful measurement of the temperature dependence of the kinetics, we can determine better why reaction probabilities for gas-surface processes of this type are considerably larger than for their gas-phase analogues.
Experimental
As illustrated in Fig. 1, experiments were conducted in a coated-wall flow tube coupled to a chemical ionization mass spectrometer (CIMS). A brief description of this widely used technique, plus details specific to the experiments conducted in this paper are given below. A full description of the newly-built CIMS system is also provided.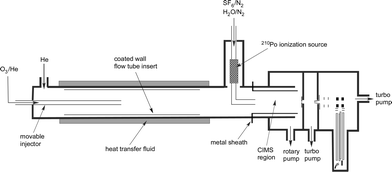 | ||
| Fig. 1 Schematic of experimental apparatus. | ||
Organic liquid films (oleic acid, Sigma, 99+%; linoleic acid, Acros, 99%; linolenic acid, Sigma, 99%) were prepared on the inner walls of a 2 cm i.d., 32.5 cm long Pyrex tube that had been cleaned by washing with 5% HF and rinsing with deionized water. These liquids are sufficiently viscous that 1–1.5 mL was able to entirely coat the tube. Although the average thickness of this layer is 0.6 mm, considerable draining of the liquid to the bottom of the horizontal tube occurs so that much of the film is thinner than this average value. After coating, the tube was inserted into a 2.4 cm i.d., jacketed flow tube oriented horizontally. After some time, typically several hours, the film would start to retract from the glass walls, particularly near the top of the upstream end of the tube. At this point, all experiments over that part of the film were terminated. Temperature regulation of the flow tube to a stability of ±0.1 °C was achieved by using a recirculating cooler (Neslab, LT-50) to circulate a heat-transfer fluid (50∶50 ethylene glycol∶H2O) through the outer jacket.
Ozone was prepared by passing extra-dry grade O2 (Air Products) over an ultraviolet source (Jelight, Model 100) and then collecting it in a trap containing fine-grade silica held at ca. 185 K. A small amount of this mixture of ozone and oxygen was then expanded into an evacuated, darkened 3.4-L Pyrex bulb, which was then pressurized with He. The ozone was delivered to the flow tube by metering it with a needle valve. Prior to the needle valve, the ozone concentration was determined by flowing the O3/O2/He mixture through a UV absorption apparatus consisting of a 10.3 cm long absorption cell, a Hg Pen-Ray lamp, and a silicon photodiode. Immediately in front of the photodiode was an interference filter centered at 254 nm. We estimate that the absolute uncertainty in the ozone concentrations in the flow tube was ±10%.
A reactive uptake experiment was performed by monitoring mass spectrometrically the decay of ozone as it experienced collisions with the organic film coating the inner walls of the Pyrex tube insert. The ozone was introduced into the flow tube through a movable injector in a carrier gas flow of 5 STP cm3 min−1 He. This flow readily mixed with a larger He gas flow of 100 STP cm3 min−1 coming down the length of the flow tube. By varying the position of the injector tip within the flow tube, the total reaction time and the number of collisions the ozone experienced with the walls was changed. For the typical total He/O2/O3 flow of 110 STP cm3 min−1 and typical operating pressures of 1.3 Torr, the bulk flow velocity in the flow tube was about 370 cm s−1. Under these conditions, flow in the flow tube was highly laminar (Re<0.2). For the experiments where the relative humidity was varied, water vapour was added to the flow tube by passing the main He carrier gas through a fritted bubbler containing distilled water held at room temperature. The size of the water vapour flow coming from the bubbler was determined by bypassing the bubbler and then measuring the equivalent flow of additional He required to match the pressure in the flow tube when the water bubbler was being used. In all cases, mass flow controllers were used to measure the He carrier gas flows (MKS Instruments, Model 1179A) and a capacitance manometer was used to measure the flow tube pressure (MKS Instruments, Model 622A, 10 Torr).
Downstream of the flow tube, the entire flow entered the ionization region of the CIMS, which was pumped by a large rotary vane pump (Varian, SD1400). Ions were generated by passing a trace amount of reagent gas in a sizable flow of nitrogen (1050 STP cm3 min−1) through a 210Po radioactive source (NRD, Model P-2021) situated at right angles to the flow. The source is connected to a short length of 9.5 mm o.d. stainless steel tubing that has a right angle bend in it. The large N2 flow was needed to produce high reagent ion count rates; at low flows, significant loss of ions to the walls of the source and the right-angle tubing occurred. SF6, delivered from a lecture bottle (Scott Specialty Gas, 99.99%), was the reagent gas used to produce SF6−. Water vapour, delivered from a small flow of N2 through a distilled water bubbler, was used to produce H3O+. The flow time between the tip of the ion source assembly and the inlet to the mass spectrometer was about 2 ms, i.e. this is the maximum reagent ion–analyte reaction time assuming instantaneous mixing between the flow tube carrier gas and the flow emanating the ion source.
A 1.75 cm i.d., 10 cm long stainless steel “sheath” lined the ion–molecule reaction region from the tip of the 9.5 mm stainless steel tube up to 1.5 cm from the front plate on the mass spectrometer vacuum chamber. The reagent ion signal was significantly enhanced by electrically connecting the sheath and the ion source together, and putting a DC potential onto both. Ions were sampled from the ion–molecule reaction region through a 0.762 mm diameter hole in an outer pinhole held at a fixed potential. Within the vacuum system, the ions first passed through a region at 2×10⁻⁵ Torr pumped with a 250 L s−1 turbomolecular pump (Varian, Turbo-V250) and then through a 2 mm i.d. skimmer cone before entering the mass spectrometer vacuum chamber held at 1.6×10⁻⁶ Torr pumped with another turbomolecular pump (Varian, Turbo-V250). Prior to entering the quadrupole mass spectrometer (ABB Extrel, 19 mm diameter rods), the ions’ direction was turned 90° by a dc-quadrupole deflector (ABB Extrel, part #814715). The deflector separates neutrals and photons from ions, and so lowers background count rates. Ions were detected with a pushing dynode/channeltron multiplier combination that was connected to a coupling-capacitor/preamplifier (Advanced Research Instruments, MTS-100). Mass spectrometer control and data acquisition were performed with commercial electronics and software (ABB Extrel Merlin system).
When operating in the negative ion mode, the potentials on the ion source/sheath, outer pinhole, skimmer cone and quadrupole entrance lens were −120, −13.4, +300 and −1 V, respectively. Typical SF6− reagent ion count rates were 400–1000 kHz, depending on the age of the radioactive source and the SF6 flow rate, and count rates for the next largest peak, SF5− (m/z 127), were 50 times smaller. For positive ions, the voltages were +120, +13.7, −275, and −1 V. In this mode, the reagent ion signal was spread over a number of peaks representing H3O+ and its water clusters, which readily form in the ion–molecule region. Typical count rates were 4 kHz, 300 kHz and 120 kHz for H3O+, H3O+·H2O and H3O+·2H2O (m/z 19, 37, and 51). As expected, the precise distribution of the different protonated water clusters was a strong function of both the water vapour amounts and the potentials on the sheath/ion source and first pinhole. The mass spectrometer polarity could be easily switched, on the timescale of a few seconds. Tests were performed to examine the effect of the presence of H2O in the reagent ion stream during negative ion CIMS and SF6 during positive ion CIMS and in both cases the presence of the molecule was found to produce a small increase (<10%) in the principal reagent ion signal.
Ozone was detected using the charge exchange reaction with SF6− whereas aldehyde reaction products were detected using proton-transfer from H3O+ and its water clusters:
| SF6−+O3→SF6+O3− | (1) |
| H3O++RHO→H2O+RHOH+ | (2) |
+SF6− reaction rate is an order of magnitude slower.34,35 Ozone calibration curves typically yielded a sensitivity of 1×10⁸ Hz Torr−1 whereas those for the pure aldehydes were roughly 6×10⁷ Hz Torr−1 for nonanal, 1.3×10⁸ Hz Torr−1 for hexanal, and 2.2×10⁸ Hz Torr−1 for nonenal, but varied from day to day. In combination with typical backgrounds of <0.1 Hz for ozone and 50–100 Hz for the aldehydes, detection limit for ozone was on the order of 5×10⁻⁸ Torr and that for the aldehydes was 1−3×10⁻⁷ Torr. The elevated background signal for the aldehydes resulted from chemical background due to desorption of aldehydes from tubing and system surfaces. With clean tubing or after a long time flowing only He, the positive ion backgrounds were below 1 Hz.Given the emphasis we place in this work on accurate quantification of gas-phase product yields, the manner by which we performed CIMS calibrations for the aldehydes quantified in this work—nonanal, hexanal, and nonenal—will be described in detail. For hexanal (Aldrich, 97%), the room temperature vapour pressure of the pure liquid, ca. 10 Torr, is sufficiently high that no problems were encountered in making up a mixture of it in helium in a glass reservoir and then delivering the hexanal/helium mixture to the flow tube through a needle valve. The flow rate was determined in the standard manner, by measuring the pressure drop in time of the glass bulb and by knowing the mixing ratio of hexanal in the bulb. We estimate uncertainty in the hexanal concentrations in the flow tube to be on the order of ±10%.
CIMS calibrations performed using nonanal delivered in this manner were somewhat irreproducible, behaviour which we attributed to some factor associated with the low volatility of the gas, 0.29 Torr at 295 K. This could lead to inaccurate knowledge of the nonanal mixing ratios in the glass bulb, or else significant losses in the manifold or the needle valve connecting the bulb to the flow tube could arise. For this reason, we chose to deliver both the nonanal and nonenal, which has a similarly low vapour pressure of 0.15 Torr at 295 K, from a fritted-glass bubbler that contained the pure liquid (nonanal, Aldrich, 95% trans-2-nonenal, Aldrich, 97%). The flow rate of the aldehyde to the flow tube was then determined from the mass flow of helium passing through the bubbler, the vapour pressure of the pure liquid at the bubbler temperature and the total pressure in the bubbler (MKS Model 622A, 1000 Torr). The helium flow rate used was 5 STP cm3 min−1 and the bubbler pressure was varied from 250 to 950 Torr. In this mode, CIMS calibrations were quite linear.
The room temperature vapour pressures of the pure nonanal and nonenal liquids were measured in a separate apparatus consisting of a leak-tight (i.e. leak-up rate less than 0.001 Torr min−1) glass vessel in which the liquid was housed. The vessel was connected to both a capacitance manometer (MKS Instruments, Model 622A, 2 Torr) and, through an on/off valve, to a rotary vane vacuum pump. The protocol for measuring the vapour pressure consisted of pumping on the liquid to remove not only air but, quite significantly, unidentified dissolved impurities. It was observed that after the air had been removed and the valve to the rotary pump closed, the pressure initially measured over the organic liquid was considerably higher than after it had been pumped on for some period of time. We interpret this behaviour as arising from the presence of semi-volatile impurities in the pure liquid that were removed with pumping. The vapour pressure of the pure organic was determined only after a stable pressure could be recorded, i.e. additional pumping did not lead to further changes in the observed vapour pressure of the liquid. The measured room temperature (295 K) vapour pressure of nonanal is in good agreement (<5%) with a recently published value.36 We estimate the accuracy of our vapour pressures to be ±0.03 Torr. In combination with other uncertainties, we estimate the overall uncertainty in our CIMS calibrations for nonanal and nonenal to be on the order of ±15%.
Results
1. Ozone loss kinetics
When ozone was exposed to any three liquid fatty acids studied in this work—oleic, linoleic and linolenic acids—an irreversible, steady-state loss of ozone was observed. This reactive loss is illustrated in Fig. 2 by typical ozone decays on an oleic acid film for a wide range of initial ozone concentrations. The independence of the reaction rate constant on the ozone concentration indicates that this is a first-order loss process.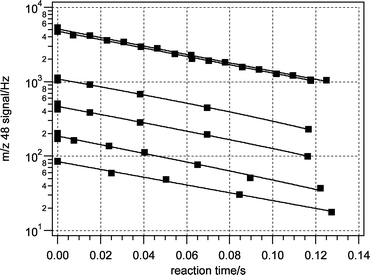 | ||
| Fig. 2 Decrease in O3− signal (m/z 48) as the injector was pulled back (increasing exposure time) over an oleic acid surface (298 K). | ||
The observed rate constant, kobs, for ozone loss can be converted to a gas–surface reaction probability using a resistance model:37
 | (3) |
 | (4) |
 | (5) |
 | (6) |
Using eqns. (3)–(6), the reaction probabilities that we have measured for ozone loss on the three fatty acids studied are given in both Table 1 and in Fig. 3, where they are plotted as a function of inverse temperature. It is noteworthy that we observed little deactivation of the fatty acid films, i.e. decrease of the observed ozone uptake coefficient as a function of time, even after substantial ozone exposure at room temperature. For example, in a long exposure experiment deactivation was not observed on an oleic acid film that had been exposed to 4×10⁻⁵ Torr of ozone for 140 min. Uptake coefficients for ozone loss measured at the beginning and end of the ozone exposure were the same to 5%. With a reaction probability of 8.0×10⁻⁴, this exposure corresponds to a loss of ozone over the film of 3×10¹⁶ molecules cm−2, where the loss is referenced to the geometric surface area of the film. This quantity is roughly two orders of magnitude larger than a monolayer surface coverage, implying that there was a significant replenishment of the surficial oleic acid molecules during the course of the exposure, or that accumulation of the condensed-phase products had only a small effect on the kinetics.
| Temperature/K | Oleic acid | Linoleic acid | Linolenic acidb | Nonenal |
|---|---|---|---|---|
| a Values shown are mean ±1σ.b Values at T=263 K, 283 K, and 303 K are averages of values from temperature increasing and temperature decreasing experiments, while values at T=273 K, 293 K, and 298 K are from increasing temperature experiments only. | ||||
| 263 | (1.18±0.03)×10−3 | (1.48±0.1)×10−3 | (4.2±0.2)×10−4 | |
| (RH=25%) | (1.16±0.04)×10−3 | |||
| (RH=55%) | (1.20±0.06)×10−3 | |||
| 265 | (1.21±0.06)×10−3 | |||
| 268 | (1.20±0. 05)×10−3 | |||
| 273 | (1.22±0. 02)×10−3 | (1.53±0.05)×10−3 | ||
| 278 | (7.13±0.3)×10−4 | (1.24±0. 04)×10−3 | ||
| 283 | (1.26±0. 02)×10−3 | (1.74±0.25)×10−3 | ||
| 288 | (1.29±0. 03)×10−3 | |||
| 293 | (7.86±0.2)×10−4 | (1.31±0. 02)×10−3 | (1.75±0.05)×10−3 | |
| 298 | (8.01±0.3)×10−4 | (1.33±0. 02)×10−3 | (1.80±0.04)×10−3 | |
| 303 | (1.34±0. 02)×10−3 | (1.93±0.15)×10−3 | ||
| 308 | (8.15±0.2)×10−4 | |||
 | ||
| Fig. 3 Measured reactive uptake coefficient (γ) for O3 on oleic (■), linoleic (●), and linolenic (▲ and ▼) acid films as a function of 1/T. The difference between the measured uptake coefficient for linolenic acid during increasing temperature experiments (▲) and decreasing temperature experiments (▼) is apparent. | ||
Our results for the reactive uptake coefficient are in good agreement with most other work reported in the literature for similar chemistry. de Gouw and Lovejoy4 reported reaction probabilities between 5×10⁻⁴ and 2×10⁻² for reactions on a wide range of unsaturated organics. For example, on canola oil, which is a mixture of oleic acid (61%), linoleic acid (22%), and linolenic acid (10%), these workers reported a room temperature reaction probability of ca. 8×10⁻⁴. For oleic acid in particular, we are in excellent agreement (<5%) with the work of Moise and Rudich,8 which employed a coated-wall flow reactor similar to ours except that the oleic acid tube insert was continuously rotated. Similarly, we are within a factor of two of the uptake coefficient reported by Morris et al.9
(1.3×10⁻³), which was measured by monitoring the decay of oleic acid using aerosol mass spectrometry when oleic acid particles a few hundreds of nanometers in size were exposed to a steady partial pressure of ozone in a flow reactor. All of these results are in considerable disagreement with the results of another experiment conducted with particle mass spectrometry, where a reaction probability was reported to vary in magnitude from 7×10⁻³ to 1×10⁻³ as the diameter of the particles was changed from 1.36 to 4.90 μm.10 The source of the disagreement between the two particle mass spectrometry experiments is not clear.
It is important to address whether one would expect agreement between the coated-wall and particle mass spectrometry experiments given the very different degree of organic modification that occurs in each. Both particle mass spectrometry experiments are operated in a mode where a large fraction, up to 100% in some cases, of the oleic acid is reacted away. Because the particle is being so highly modified via the reaction, with substantial levels of condensed-phase products accumulating, the overall reaction substrate is becoming considerably more oxygenated than is a largely pure oleic acid liquid. In addition, the particles used in these experiments are formed by nebulizing solutions of oleic acid in alcohol so leading, perhaps, to small amounts of dissolved alcohol in the particles. After the discrepancy between the two particle mass spectrometry results is resolved, if it transpires that there is a systematic difference between coated-wall and particle MS results where a large fraction of the particle is being oxidized, then the differences might arise from the difference in reaction substrate. If there is little difference, as there currently is between the coated-wall results and those of Morris et al.,9 this would be an indication that changes in the reaction substrate do not significantly affect the rate of the ozone–oleic acid surface reaction.
For the other species studied, the only other report of the kinetics of ozone loss on linoleic acid is that of Moise and Rudich8
(1.2×10⁻³), with which we are in good agreement (<10%). There are no previous reports for the kinetics with linolenic acid.
The temperature dependence of the uptake coefficient was measured carefully on the three acids from temperatures just above the freezing point (or in the case of oleic acid on a supercooled liquid film) to somewhat above room temperature (see Fig. 3). Although the observed temperature dependence was weak, the very high precision of our uptake coefficient measurements (e.g., one standard deviation is typically <5%, see Table 1) allowed us to discern a small positive temperature dependence for all three fatty acids. The temperature dependence of the uptake coefficient for ozone with oleic and linoleic acids appeared to behave in an Arrhenius manner. For linolenic acid, the temperature dependence appeared decidedly non-Arrhenius. A hysteresis was observed in the measured uptake coefficients depending on whether the experiments on a single film were conducted in order of increasing or decreasing temperature (see Fig. 3). This behaviour may have been due to enhanced accumulation of products on the surface of the film at lower temperatures. However, a similar behaviour was not observed with either linoleic or oleic acid films.
As has been noted by previous workers,26,40 there is a distinct enhancement in the probability that a reaction will occur upon an encounter between a gas-phase ozone molecule and an unsaturated organic molecule when the organic is on the surface of a liquid rather than in the gas phase. Consider, for example, oleic acid. Although the gas-phase room temperature rate constant between ozone and oleic acid has not been measured, other internal alkenes (e.g.cis-2-butene, cis-4-octene, cis-5-decene) have rate constants on the order of 1×10⁻¹⁶ cm3 molecule−1 s−1.41,42 For a collision rate constant in the gas-phase of 10−10 cm3 molecule−1 s−1, this implies that only 1 in 106 collisions is giving rise to reaction. By contrast, about one collision in 103 is reactive for gas–liquid heterogeneous processes. Does this enhancement arise from entropic or energetic factors? In particular, is there a lowering of the reaction barrier in the liquid phase over that prevalent in the gas phase, or is the enhancement in the rate solely due to a trapping of the ozone molecule in the film after its initial collision?
To address this we can first note that the largest A-factors of gas-phase ozone–alkene reactions are on the order of 10−14 or 10−15 cm3 molecule−1 s−1,41,42i.e. 10−4 to 10−5 times smaller than the gas-kinetic collision rate constant. For gas–surface reaction probabilities of 10−3, this implies by itself that there is an enhancement to the rate from entropic factors. As support for this idea, Tobias and coworkers43 have demonstrated using molecular dynamics simulations that there is substantial trapping of ozone molecules in an unsaturated phospholipid monolayer and that each encounter of a gas-phase molecule with the film gives rise to a number of collisions between the ozone and the double-bond moiety in the unsaturated fatty acid. Similar behaviour is likely to occur near the surface of a pure fatty acid film.
An analysis of the potential contribution of energetic factors to the enhancement of the reaction rate is complicated by uncertainties in the nature of the reaction. The 2–3 kJ mole−1 apparent activation energy calculated from the measured temperature dependence of the uptake coefficients is significantly smaller than that of similar gas-phase reactions (cis-2-butene=8.2 kJ mole−1),41,42 suggesting a possible change in the energetics of the reaction. However, if the reaction behaves as a bulk liquid mechanism as has been suggested previously,8–10 then the temperature dependence of the uptake coefficient would be a function of the temperature dependences of the solubility and diffusion rate of ozone in the liquid fatty acid as well as the temperature dependence of the reaction rate coefficient.
The results discussed so far, and all others in the literature for similar kinetics, were measured at close to 0% relative humidity (RH), i.e. no additional water vapour was added above trace, background amounts in the carrier gases. To investigate whether adsorbed water may affect the kinetics, we measured the reaction probability for ozone loss on linoleic acid up to 55% RH at 263 K. The motivation for this study is that there is now ample evidence that water adsorbs in substantial amounts to organic surfaces, increasingly so as the hydrophilicity (or degree of oxidation) of the organic molecule increases. To what degree does adsorbed water affect the reactive loss of ozone?
To remain in conditions close to plug flow where there are not significant ozone-concentration radial gradients in the flow reactor, the experiments were performed at a low temperature, 263 K, just above the freezing point of linoleic acid. The reason for this is that at lower temperatures a smaller partial pressure of water vapour, and thus a lower total pressure in the flow tube, corresponds to a higher relative humidity. The lower total pressure in the flow tube minimizes gas-phase diffusion constraints that arise in experiments of this type.
The results from the experiments at enhanced relative humidity (see Table 1) conclusively show that there is no discernible effect on the reaction kinetics over the RH range investigated. For unsaturated fatty acids of this type, the degree or mechanism by which water adsorbs to the surface is not fully known. However, whether the water is present as a uniform monolayer or more likely as little ‘pools’ present in corrugations on the surface, it appears to have little effect on the kinetics studied in this paper. To our knowledge, this is the first time that the relative humidity dependence of kinetics of this type has been studied.
2. Gas-phase product formation: identification and yields
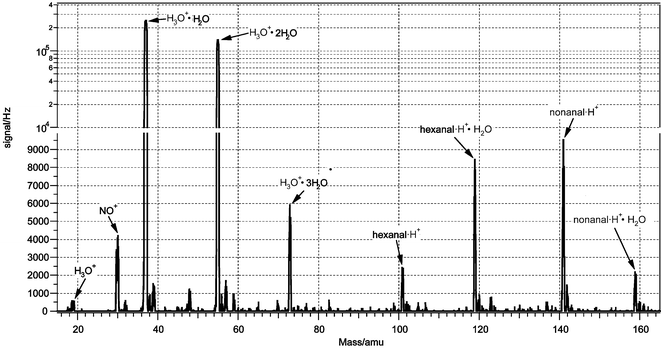
As has been pointed out previously, the observed loss of ozone in these experiments is clearly due to reaction with the carbon–carbon double bond. This has been inferred to be the case from studies that have shown ozone reacts significantly more slowly with liquid saturated organics4 and by the nature of products that have been observed to date (see discussion below). In this work we used proton-transfer chemical ionization to positively identify and quantify gas-phase products in this reaction. Given that reactions of the type in reaction (2) proceed at close to the ion–molecule collision rate and that little fragmentation of the protonated product results, proton-transfer ionization has been used extensively of late as a selective and sensitive technique to detect oxygenated organics.For oleic acid, the only gas-phase product observed in this work was identified to be nonanal. Upon ozone exposure peaks were observed at m/z of 143, 161, and 179, due to protonated nonanal and its water clusters: C9H18OH+, C9H18OH+·H2O and C9H18OH+·(H2O)2
(see Fig. 4). The resulting nonanal signal at m/z 161 (dominant peak) was determined at three different injector positions over oleic acid films for an ozone partial pressure of 2.5×10⁻⁴ Torr. These nonanal signals were then converted to product yields by referencing to the ozone loss over that same film. The ozone loss was measured in negative-ion mode immediately prior and subsequent to the positive ion measurements. The nonanal CIMS calibrations that were used to determine the product yields were performed on the same day under the same flow and chemical ionization conditions as for the reaction (see Fig. 5). There was no systematic difference in the product yields determined from each set of data and the average value that we report is 0.50 (±0.10). The uncertainty here arises in large part from the nonanal calibration which has inherent in it the uncertainty in the measured nonanal vapour pressure.
 | ||
| Fig. 4 Positive ion mass spectrum during exposure of oleic acid film to O3. | ||
 | ||
| Fig. 5 Nonanal calibration curve. | ||
Gas-phase aldehyde production was also observed in the linoleic acid experiments. Mass peaks in the positive ion spectrum were observed at m/z 101 and 119, and at 141 and 159 (see Fig. 6). The first set corresponds to protonated hexanal and its cluster with a single water molecule, whereas the second set of peaks corresponds to protonated nonenal and its water cluster. With proton-transfer mass spectrometry of this type, where only molecular weight information is obtained, we cannot determine the specific nonenal isomer being observed. From the mechanism (see below) of the reaction, it might be expected that 3-nonenal would initially form. However, because it is not commercially available whereas 2-nonenal is, we performed our calibrations using this latter compound. We do not feel this significantly affects our product yield assessments because it is unlikely that the ionization rate constant with H3O+ will significantly change between the two isomers given that the protonation occurs via the carbonyl group. In addition, it is possible that 3-nonenal is unstable and that it will readily isomerize to either 2- or 4-nonenal.8
 | ||
| Fig. 6 Positive ion mass spectrum during exposure of linoleic acid film to O3. | ||
It should be noted that in both the oleic and linoleic acid experiments, there was a delay in the approach to steady state of the product signals after ozone exposure was initiated. This delay was significant for both nonanal and nonenal but only very minor for hexanal. It was much more pronounced as the temperature decreased. For example, as shown in Fig. 7, there is a time delay in the appearance of the nonenal signal after ozone is exposed to a fresh linoleic acid surface. Similarly, when the injector is pushed back to its starting position after exposure, the nonenal signal takes some time to decay away. In both cases, this delay is almost nonexistent for hexanal and it is much larger than conditioning times over bare Pyrex surfaces. Considering the temperature dependence of the delay and that hexanal is a smaller and considerably more volatile molecule than the other two, we attribute this delay to the dissolution and degassing of nonenal (nonanal) into the linoleic (oleic) acid film. Only steady-state signals for all the products were used for the product yield measurements.
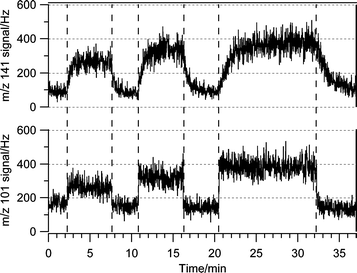 | ||
| Fig. 7 Hexanal·H+ (m/z 101) and nonenal·H+ (m/z 141) signals vs. time as the injector was pulled back to 6, 12, and 24 cm exposing the linoleic acid film to O3. | ||
As with oleic acid, product yields for ozone loss over linoleic acid were also determined at different injector positions using ozone partial pressures of roughly 1×10⁻⁵ Torr. The ozone loss kinetics were determined immediately prior to the proton-transfer experiments on the same film, and the hexanal/nonenal calibrations were performed on the same day. As shown in Fig. 8, the yields of hexanal were independent of the injector position as they had been for nonanal formation from oleic acid. The data in Table 2 show that the yields are also largely independent of temperature. We report an overall value of 0.25 (±0.05), independent of temperature.
 | ||
| Fig. 8 Observed hexanal (♦) and nonenal (□) yields from the reaction of O3 with linoleic acid as a function of injector position at 273 K. | ||
| Temperature/K | Injector distance/cm | |||
|---|---|---|---|---|
| 6 | 12 | 24 | ||
| 265 | hexanal | 0.20 | 0.20 | 0.20 |
| nonenal | 0.18 | 0.15 | 0.09 | |
| 273 | hexanal | 0.24 | 0.23 | 0.22 |
| nonenal | 0.24 | 0.19 | 0.15 | |
| 283 | hexanal | 0.25 | 0.24 | 0.24 |
| nonenal | 0.25 | 0.23 | 0.20 | |
| 293 | hexanal | 0.26 | 0.25 | 0.24 |
| nonenal | 0.28 | 0.26 | 0.24 | |
| 303 | hexanal | 0.26 | 0.26 | 0.25 |
| nonenal | 0.30 | 0.29 | 0.28 | |
For nonenal there was a systematic decrease in the yield as the injector was withdrawn over increasingly longer lengths of the linoleic acid film (see Fig. 8). As shown in Table 2, this behaviour was most pronounced at low temperatures and is largely absent in the highest temperature experiments. We attribute this behaviour to the reaction of ozone with nonenal dissolved in or adsorbed to the surface of the linoleic acid. In particular, at low temperatures, the solubility of nonenal will be highest and the consequent nonenal loss will be greatest.
To test this hypothesis, we performed a coated-wall kinetics experiment where ozone was exposed to a nonenal film. Ozone loss was observed in a similar manner to that over the fatty acid films and a reactive uptake coefficient was measured at 263 K of 3×10⁻⁴. No gas-phase products were observed with proton transfer. This is somewhat surprising since hexanal would be an expected product, but might be an indication that the mechanism of the reaction is affected by the proximity of the double bond to the carbonyl group.
In the case of nonenal production from linoleic acid, the secondary chemistry due to reaction of ozone with nonenal is unlikely to affect the measured ozone decay rate because it occurs substantially more slowly than the primary chemistry. The uptake coefficient on a pure nonenal film is already a factor of four times smaller than over a linoleic acid film, and it is unlikely that enough nonenal builds up to drive the secondary kinetics even this fast. As confirmation, we observed first-order kinetics for ozone loss on linoleic acid.
For the product formation, when secondary chemistry occurs more slowly than the primary chemistry, true product yields can be obtained in the limit of small reaction times and at higher temperatures. Thus, we focus only on the short-exposure, higher-temperature data and report a product yield of 0.29 (±0.05) for nonenal formation from the reaction of ozone with linoleic acid.
When comparing to reports in the literature for gas-phase product formation in the reactions of ozone with condensed-phase unsaturated organics, Finlayson-Pitts and co-workers26 observed gas-phase nonanal of ca. 0.25 yield in their studies of ozone with 1-oleoyl-2-palmitoyl-sn-glycero-3-phosphocholine monolayers. By inferring that roughly half of the nonanal formed in this reaction dissolved in the aqueous solution supporting the phosphocholine monolayer, they reported an overall yield of nonanal of 0.54 (±0.05). Subsequently, Moise and Rudich8 used electron-impact ionization mass spectrometry to identify nonanal as a product in the reaction of ozone with oleic acid, and hexanal and both 2-nonenal and 4-nonenal from reaction with linoleic acid. These products were identified largely by comparison of observed mass spectra to library mass spectra, and the product yield of nonanal at 296 K was determined to be 0.28. It should be noted, however, that the calibration of the nonanal signal was accomplished by referencing the product ion yield to that of a known flow of 1-butene, so there may be some degree of uncertainty in this value. These same workers also used ion chromatography of oleic acid liquid that had been exposed to high concentrations of ozone to observe a strong peak attributable to azelaic acid and a less distinct one perhaps arising from nonanoic acid. Lastly, in particle mass spectrometry experiments, a peak attributable to another likely product in this reaction, 9-oxononanoic acid, has been reported.10
For the case of linolenic acid, which has three carbon–carbon double bonds, a number of peaks were observed in the proton-transfer mass spectrum upon ozone exposure (see Fig. 9). In particular, strong peaks were observed at m/z=59, 99 and 121 and weaker intensity peaks at 77, 81, 117, 139 and 157. We attribute 59 and 77 to protonated propanal and its water cluster, respectively. Similarly, 99 and 117 arise from protonated hexenal and its water cluster. The other likely product from this reaction is protonated nonadienal, which has a m/z of 139, thus explaining the appearance of both this peak and the peak at 157 which will be the associated water cluster. Interestingly, the intensity of the 139 peak is low whereas that of a peak at m/z eighteen units lower, at 121, is high. We hypothesize that protonated nonadienal is unstable and that it decomposes, losing H2O, to give rise to this peak at mass 121. In an analogous manner, a relatively small amount of decomposition of protonated hexenal will give rise to the observed peak at m/z 81.
 | ||
| Fig. 9 Positive ion mass spectrum during exposure of linolenic acid film to O3. | ||
Although no product yield determinations were performed for the products from linolenic acid, we can estimate that the yields are between 0.1 and 0.2 for propanal, hexenal and nonadienal, assuming that the CIMS sensitivity for these three molecules is similar to those for the species we carefully calibrated, i.e. hexanal, nonanal and nonenal. In making this estimate, we assume that the intensity of the peak at m/z 121 is attributable to the formation of nonadienal.
Discussion
When ozone adds across a carbon–carbon double bond it is well known that a primary ozonide is formed, both in the gas and condensed phases (see Fig. 10). For a summary, the reader is referred to Finlayson-Pitts and Pitts.44 The primary ozonide readily decomposes yielding a carbonyl entity and a Criegee biradical. This biradical is highly energized and can decompose along a number of different channels. If, however, it is collisionally stabilized, then isomerization to a carboxylic acid group is the most energetically favoured product on the potential energy surface. In solution, the biradical is rapidly stabilized. In addition, it is known that formation of a secondary ozonide, where the carbonyl and biradical functional groups react with each other in the solvent cage, is a common end product of the reaction in solution. | ||
| Fig. 10 O3+ oleic acid reaction mechanism. | ||
In the case of the reactions of gas-phase ozone with liquid unsaturated fatty acids, there is strong reason to believe that the reaction proceeds very close to the surface. Arguments in support of this are that: (i) estimates of the reacto-diffusive length yield very small values, on the order of 10 nm or so,8–10 (ii) the particle mass spectrometry reaction probability results of Morris et al.9 were independent of particle size; and (iii) the molecular dynamics simulations of Tobias and co-workers43 show the ozone being trapped near the surface. If this is a surface reaction, it is important to assess the degree to which secondary ozonide formation occurs relative to the formation of two separate products. It is for this reason that we have so carefully focused on the product yields in this study.
To summarize our results, we find for oleic acid that nonanal is formed with close to 0.50 yield, and that two aldehydes, hexanal and nonenal, are formed from linoleic acid with close to 0.25 yield each. Although we did not address the product yields in linolenic acid in as much detail, preliminary indications are that the three possible aldehydes that can form in this reaction do so with roughly equal yields.
For oleic acid, these results are consistent with there being little preference for the manner by which the primary ozonide falls apart and that there is not a large formation of the secondary ozonide in the nonanal formation channel. For linoleic acid, the results suggest the same is true: ozone adds with equal probability to either of the two double bonds, and the primary ozonides that are formed can each fall apart into two products with equal probability, hence the observed ca. 0.25 yields of hexanal and nonenal. The 50∶50 branching ratio for the decomposition of the individual primary ozonides is not surprising given that the carboxylic acid group of the fatty acid is at a considerable distance and is unlikely to have a sizable effect on the electronic environment of the double bond region. The fact that the secondary ozonide does not form in very high yield must be driven, to some degree, by the volatility of the aldehyde products. That is, if the aldehyde rapidly desorbs from the film, then the secondary ozonide cannot form. This leaves open the question of secondary ozonide formation in the other product channel, where both products are non-volatile.
The efficient volatilization of the aldehydes from the fatty acid film, after the condensed phase has become saturated with them, is an indication that they will also volatilize from similar chemistry occurring in the atmosphere, acting as a source of oxygenated VOCs.
Conclusions and atmospheric implications
It is clear from the work done to date in this field that the heterogeneous reaction between gas-phase ozone and liquid unsaturated organics is a facile one, proceeding considerably faster on a per collision basis than that in the gas phase. Our kinetics studies are consistent with the rate enhancement arising from both a lowering of the barrier to reaction and to a trapping of ozone molecules after an initial collision with the liquid surface. Aldehydes are formed as gas-phase products and it is unlikely that secondary ozonides are formed in high yield in the aldehydic channel.As has been pointed out before,9 the reaction probability for surface-phase oleic acid that has been measured is sufficiently fast that for typical values of ozone in the atmosphere, particle-borne olefinic compounds should be reacted away in a matter of seconds. The fact that they are observed in tropospheric particulate matter is most likely a reflection of substantial particle matrix effects slowing down the overall rate of the reaction.
Reactions of this type are likely to be sources of aldehydes and other oxygenated species to the atmosphere. The condensed phase products, the character of which we are currently studying, are likely to be considerably more hydrophilic than the fatty acid precursors, thus making the particles better cloud condensation nuclei with higher growth factors in humid environments. As mentioned in the Introduction, the unusually high abundance of nonanal and azelaic acid in comparison to other aldehydes and dicarboxylic acids of similar size probably arises through oxidation processes occurring in the atmosphere of large unsaturated organics with ozone.
Finally, it should be noted that this or similar chemistry can occur not only via interactions with tropospheric particulate material but also through reactions of ozone with plant epitaxial and membrane surfaces and in the organic-rich microlayer that exists on the surface of natural waters.
Acknowledgements
The authors thank NSERC, the Canada Foundation for Innovation, and the Government of Ontario (PREA award to J. A.) for financial support.References
- D. D. Jech, P. G. Easley, and B. B. Krieger, in Kinetics of Reactions Between Free Radicals and Surfaces (Aerosols) Applicable to Atmospheric Chemistry, ed. D. R. Schryer, American Geophysical Union, Washington, DC, 1982, p. 107 Search PubMed.
- P. L. Cooper and J. P. D. Abbatt, J. Phys. Chem., 1996, 100, 2249 CrossRef CAS.
- A. K. Bertram, A. V. Ivanov, M. Hunter, L. T. Molina and M. J. Molina, J. Phys. Chem. A, 2001, 105, 9415 CrossRef CAS.
- J. A. de Gouw and E. R. Lovejoy, Geophys. Res. Lett., 1998, 25, 931 CAS.
- W. F. Rogge, L. M. Hildemann, M. A. Mazurek, G. R. Cass and B. R. T. Simoneit, Environ. Sci. Technol., 1991, 25, 1112 CAS.
- W. F. Rogge, L. M. Hildemann, M. A. Mazurek, G. R. Cass and B. R. T. Simoneit, Environ. Sci. Technol., 1993, 27, 2700 CAS.
- A. Limbeck and H. Puxbaum, Atmos. Environ., 1999, 33, 1847 CrossRef CAS.
- T. Moise and Y. Rudich, J. Phys. Chem. A, 2002, 106, 6469 CrossRef CAS.
- J. W. Morris, P. Davidovits, J. T. Jayne, J. L. Jimenez, Q. Shi, C. E. Kolb, D. R. Worsnop, W. S. Barney and G. Cass, Geophys. Res. Lett., 2002, 29 Search PubMed art. no. 1357.
- G. D. Smith, E. Woods, C. L. DeForest, T. Baer and R. E. Miller, J. Phys. Chem. A, 2002, 106, 8085 CrossRef CAS.
- E. R. Thomas, G. J. Frost and Y. Rudich, J. Geophys. Res., [Atmos.], 2001, 106, 3045 Search PubMed.
- T. L. Eliason, S. Aloisio, D. J. Donaldson, D. J. Cziczo and V. Vaida, Atmos. Environ., 2003, 37, 2207 CrossRef CAS.
- D. R. Worsnop, J. W. Morris, Q. Shi, P. Davidovits and C. E. Kolb, Geophys. Res. Lett., 2002, 29 Search PubMed art. no.
- K. Kawamura, K. Yokoyama, Y. Fujii and O. Watanabe, Geophys. Res. Lett., 1999, 26, 871 CrossRef CAS.
- K. Kawamura, H. Kasukabe and L. A. Barrie, Atmos. Environ., 1996, 30, 1709 CrossRef CAS.
- K. Kawamura, H. Kasukabe, O. Yasui and L. A. Barrie, Geophys. Res. Lett., 1995, 22, 1253 CAS.
- M. Mochida, A. Kawabata, K. Kawamura, H. Hatsushika and K. Yamazaki, J. Geophys. Res., [Atmos.], 2003, 108 Search PubMed art. no. 4193.
- M. Narukawa, K. Kawamura, S. M. Li and J. W. Bottenheim, Atmos. Environ., 2002, 36, 2491 CrossRef CAS.
- R. Sempere and K. Kawamura, Glob. Biogeochem. Cycle, 2003, 17 Search PubMed art. no. 1069.
- R. Sempere and K. Kawamura, Atmos. Environ., 1996, 30, 1609 CrossRef CAS.
- R. Sempere and K. Kawamura, Atmos. Environ., 1994, 28, 449 CrossRef CAS.
- A. Wedel, K. P. Muller, M. Ratte and J. Rudolph, J. Atmos. Chem., 1998, 31, 73 CrossRef CAS.
- J. H. Bowman, D. J. Barket and P. B. Shepson, Environ. Sci. Technol., 2003, 37, 2218 CrossRef CAS.
- Y. Yokouchi, H. Mukai, K. Nakajima and Y. Ambe, Atmos. Environ., Part A, 1990, 24, 439 CrossRef.
- E. G. Stephanou and N. Stratigakis, Environ. Sci. Technol., 1993, 27, 1403 Search PubMed.
- Y. Wadia, D. J. Tobias, R. Stafford and B. J. Finlayson-Pitts, Langmuir, 2000, 16, 9321 CrossRef CAS.
- C. C. Lai, S. H. Yang and B. J. Finlayson-Pitts, Langmuir, 1994, 10, 4637 CrossRef CAS.
- G. B. Ellison, A. F. Tuck and V. Vaida, J. Geophys. Res., [Atmos.], 1999, 104, 11633 Search PubMed.
- K. Matsumoto, K. Kawamura, M. Uchida, Y. Shibata and M. Yoneda, Geophys. Res. Lett., 2001, 28, 4587 Search PubMed.
- J. S. E. Fang, K. Kawamura, Y. Ishimura and K. Matsumoto, Environ. Sci. Technol., 2002, 36, 2598 CrossRef CAS.
- M. Mochida, Y. Kitamori, K. Kawamura, Y. Nojiri and K. Suzuki, J. Geophys. Res., [Atmos.], 2002, 107 Search PubMed art. no.
- G. Bouchoux, J. Y. Salpin and D. Leblanc, Int. J. Mass Spectrom. Ion Processes, 1996, 153, 37 CrossRef CAS.
- P. Spanel, J. M. Van Doren and D. Smith, Int. J. Mass Spectrom., 2002, 213, 163 CrossRef CAS.
- V. Catoire, C. Stepien, D. Labonnette, J. C. Rayez, M. T. Rayez and G. Poulet, Phys. Chem. Chem. Phys., 2001, 3, 193 RSC.
- D. L. Slusher, S. J. Pitteri, B. J. Haman, D. J. Tanner and L. G. Huey, Geophys. Res. Lett., 2001, 28, 3875 Search PubMed.
- S. P. Verevkin, E. L. Krasnykh, B. Koutek, J. Doubsky and A. Heintz, Fluid Phase Equilib., 2003, 206, 331 CrossRef CAS.
- U. Poschl, M. Canagaratna, J. T. Jayne, L. T. Molina, D. R. Worsnop, C. E. Kolb and M. J. Molina, J. Phys. Chem. A, 1998, 102, 10082 CrossRef.
- R. G. Utter, J. B. Burkholder, C. J. Howard and A. R. Ravishankara, J. Phys. Chem., 1992, 96, 4973 CrossRef CAS.
- C. J. Howard, J. Phys. Chem., 1979, 83, 3 CrossRef CAS.
- T. Moise and Y. Rudich, Geophys. Res. Lett., 2001, 28, 4083 Search PubMed.
- R. Atkinson, J. Phys. Chem. Ref. Data, 1997, 26, 215 CAS.
- R. Atkinson, D. L. Baulch, R. A. Cox, R. F. Hampson, J. A. Kerr, M. J. Rossi and J. Troe, J. Phys. Chem. Ref. Data, 1997, 26, 521 CAS.
- O. L. Ma and D. J. Tobias, Abstr. Pap. Am. Chem. Soc., 2002, 224, 179.
- B. J. Finlayson-Pitts, and J. N. Pitts, Chemistry of the Upper and Lower Atmosphere, Academic Press, San Diego, 2000 Search PubMed.
Footnote |
| † Present address: NOAA Aeronomy Lab, R/AL6, 325 Broadway, Boulder, CO, USA and Cooperative Institute for Research in Environmental Sciences (CIRES), University of Colorado, Boulder, CO, USA. |
| This journal is © the Owner Societies 2004 |