Immunoassay using probe-labelling immunogold nanoparticles with silver staining enhancement via surface-enhanced Raman scattering
Shuping
Xu
a,
Xiaohui
Ji
b,
Weiqing
Xu
*a,
Xiaoling
Li
a,
Lianying
Wang
b,
Yubai
Bai
*b,
Bing
Zhao
a and
Yukihiro
Ozaki
c
aKey Laboratory for Supramolecular Structure and Material of Ministry of Education, Jilin University, Changchun 130021, P. R. China
bCollege of Chemistry, Jilin University, Changchun 130021, P. R. China. E-mail: wqxu@jlu.edu.cn; Fax: +86-431-8980729; Tel: +86-431-8498912
cDepartment of Chemistry, School of Science and Technology, Kwansei-Gakuin University, Sanda, Hyogo 669-1337, Japan
First published on 11th December 2003
Abstract
This paper reports a novel immunoassay based on surface-enhanced Raman scattering (SERS) and immunogold labelling with silver staining enhancement. Immunoreactions between immunogold colloids modified by a Raman-active probe molecule (e.g., 4-mercaptobenzoic acid) and antigens, which were captured by antibody-assembled chips such as silicon or quartz, were detected via SERS signals of Raman-active probe molecule. All the self-assembled steps were subjected to the measurements of ultraviolet-visible (UV-vis) spectra to monitor the formation of a sandwich structure onto a substrate. The immunoassay was performed by a sandwich structure consisting of three layers. The first layer was composed of immobilized antibody molecules of mouse polyclonal antibody against Hepatitis B virus surface antigen (PAb) on a silicon or quartz substrate. The second layer was the complementary Hepatitis B virus surface antigen (Antigen) molecules captured by PAb on the substrate. The third layer was composed of the probe-labelling immunogold nanoparticles, which were modified by mouse monoclonal antibody against Hepatitis B virus surface antigen (MAb) and 4-mercaptobenzoic acid (MBA) as the Raman-active probe on the surface of gold colloids. After silver staining enhancement, the antigen is identified by a SERS spectrum of MBA. A working curve of the intensity of a SERS signal at 1585 cm−1 due to the ν8a aromatic ring vibration of MBA versus the concentration of analyte (Antigen) was obtained and the non-optimized detection limit for the Hepatitis B virus surface antigen was found to be as low as 0.5 µg mL−1.
Introduction
Raman spectroscopy is one of the most useful methods to investigate biomolecules and biological materials because it can provide rich structural information as well as quantitative and qualitative information by sharp Raman bands in a nondestructive manner. Raman spectroscopy can be almost freely applied to aqueous samples and samples under physiological conditions. However, the signals of conventional Raman spectra are too weak to be widely used for highly sensitive quantitative and qualitative analyses. Surface-enhanced Raman scattering (SERS) and surface-enhanced resonance Raman scattering (SERRS) can readily enhance Raman signals by a factor of 103–14,1,2 and many single molecule Raman spectra have recently been acquired from an adsorbate on a single nanoparticle.3,4 This remarkable progress in SERS has broadened the applications of Raman spectroscopy in biology and biomedicine.1,5,6Immunoassay, which is based on a specific interaction between an antigen and a complementary antibody, is a powerful analytical tool for biochemical analyses, clinical diagnosis, and environmental monitoring. Many analytical methods, such as surface plasmon resonance (SPR),7 atomic force microscopy (AFM)8 and quartz crystal microbalance (QCM),9 have been used for a direct measurement of the antigens binding to antibody molecules immobilized on a substrate. Rapid, sensitive, and accurate methods for immunoassays have always been the goals pursued by scientists. Thus, many kinds of conventional labelling immunoassay techniques, such as enzyme immunoassay (EIA),10 fluorescence11,12 and chemiluminescence,13 have widely been applied to increase the detection sensitivity of analytes.
Recently, metallic colloid nanoparticles (e.g. gold and silver colloids) have also been successfully applied to the label technologies because of their easily controllable-size distribution, long-term stability and friendly biocompatibility with antibodies, antigen proteins, DNA and RNA.14–20 Many novel methods using metallic colloid nanoparticles have been developed, such as colloidal gold labelling immunoassay systems detected with transmission electron microscopy (TEM),15,16 scanning electron microscopy (SEM),17 or even by naked eye,18,19 imaging of gold colloidal particles by conjugating the immune complexes on conductive substrates with scanning tunneling microscope (STM),20 and so on. Moreover, noble metallic colloid particles with proper size and roughness are very suitable for SERS substrates,21 and there is great interest in the coupling of the nano-labelling techniques with the SERS technique. Dou et al.22 developed a new enzyme immunoassay based on SERRS. In their system, antibody immobilized on a solid substrate reacts with antigen, which binds with another antibody labelled with peroxidase. If this immunocomplex is subjected to the reaction with o-phenylenediamine and hydrogen peroxide, azoaniline is generated.22 This azo compound is adsorbed on a silver colloid, giving strong SERRS signals. Ni et al.23 proposed an immunoassay readout method based on SERS in a dual analyte sandwich assay. This method exploits SERS-derived signals from three different extrinsic reporter molecules that are coimmobilized with biospecific species on gold colloids. However, it was found that the excitation coefficient of a surface plasmon band for gold particles is approximately 4 times lower than that for silver particles with the same size.24 As a SERS substrate, the Raman enhanced ability of gold nanoparticles is about 100 times lower than that of silver nanoparticles.25,26 Recently, Kim et al.27 demonstrated that isocyanide and biotin-derivatized silver nanoparticles with the size from 150 nm to 3 µm can be used via SERS as very effective sensing units between avidin and biotin moieties. However, problems of how to enhance the solubility, physicochemical stability and quantum efficiency of silver colloid nanoparticles after the surface modification remained.27
In the present study, we have combined the immunogold nano-labelling and silver staining enhancement method with the SERS technique to develop a new immunoassay method. We have used this method for the quantitative detection of Hepatitis B virus surface antigen (Antigen) by means of a sort of self-assembled sandwich structure immobilized on a silicon or quartz substrate (see Scheme 1). Immunoreactions between immunogold colloids modified by 4-mercaptobenzoic acid (MBA) and Antigen, captured by the antibody-assembled chips, are detected via SERS signals of MBA after silver staining enhancement. The advantages of gold colloid nanoparticles, such as their long-term stability, easily controllable-size distribution and friendly biocompatibility with antibody molecules, are utilized to make the nano-labels. Raman-active molecules as the probes are also fixed onto the gold nanoparticles for the SERS detection. Thus, the problem of the stability of silver colloid described above has been solved and the reproducibility of the detection has been improved. The silver staining enhancement method used in the present system has markedly increased SERS signals, and removed the flaws of gold nanoparticles in the Raman enhanced ability. The ultraviolet-visible (UV-vis) spectra have been used to monitor the immobilization of the MBA-labelling immunogold nanoparticles and the step of silver staining (in Scheme 1). A series of SERS spectra for the immunoassay, measured for the MBA-labelling immunogold nanoparticles with the silver staining enhancement, have shown that the detection limit of Hepatitis B virus surface antigen is as low as 0.5 µg mL−1.
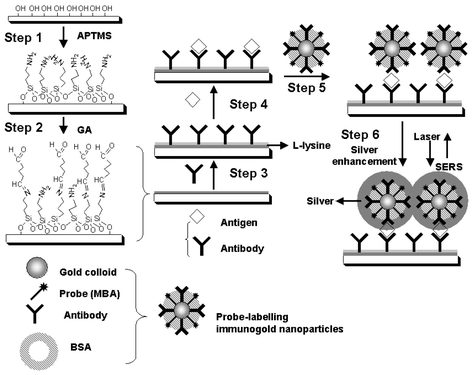 | ||
| Scheme 1 The process of self-assembled sandwich structure immobilized on a silicon or quartz substrate using MBA-labelling immunogold nanoparticles with the silver staining enhancement method. | ||
Experimental section
Reagents
Hepatitis B virus surface antigen (Antigen), mouse monoclonal antibody against Hepatitis B virus surface antigen (MAb) and mouse polyclonal antibody against Hepatitis B virus surface antigen (PAb) were obtained from Kunming Yuda Monoclonal Antibody Technology Center, Yunnan University, P. R. China. HAuCl4·4H2O, trisodium citrate, and glutaraldehyde (GA) were purchased from Shanghai Chemical Reagent Co. Ltd. Goat immunoglobulin (IgG), bovine serum albumin (BSA), L-lysine, (3-amino-propyl)trimethoxysilane (APTMS), 4-mercaptobenzoic acid (MBA) and tris(hydroxymethyl)aminomethane (Tris) were obtained from Aldrich. The other chemicals were all purchased from Beijing Chemical Reagent Co. Ltd. All the chemicals used were of analytical grade.Solutions
A borate buffer solution (2 mM, pH = 9.0), a PBS buffer solution (KH2PO4/K2HPO4, 150 mM, pH = 7.6), a Tris/HCl buffer solution (0.1 M, pH = 7.0) and a MBA solution (1.0 × 10⁻³ mol L−1) were employed in the present study. MBA and APTMS were dissolved in methanol.Preparation of the MBA-labelling immunogold nanoparticles (Scheme 1)
The probe-labelling immunogold nanoparticles were prepared by a process consisting of four steps.28 First, gold colloid was prepared following the procedure developed by Frens.29 All the glassware used were cleaned with freshly prepared aqua regia (HCl:HNO3 3:1 v/v). Immediately after 100 mL of a 10−3 mol L−1 HAuCl4 solution started boiling, 9.34 mL of a 1% (m/m) trisodium citrate aqueous solution was added to it. After the mixture had boiled for 20 min, the heating was stopped. An UV-vis spectrum of the gold colloids thus prepared was measured; a plasmon resonance peak appeared at 518 nm. The average diameter of gold particles was estimated to be ∼13 nm according to their TEM images.In the second step, 2.5 µL of the MBA solution (1 × 10⁻³ mol L−1) was added as a Raman-active probe to 1.0 mL of the gold colloids, and then the mixture was reacted for 12 h under stirring. MBA was adsorbed onto the surface of gold particles with thiol groups.30,31,23 Then, the MBA modified gold colloids were rinsed by centrifugation and resuspension with a borate buffer solution (2 mM, pH = 9.0) twice.
As the third step, 10 µL of a MAb solution (1.0 mg mL−1) was added to 1 mL of the MBA-labelling colloid, and the solution was well mixed. MAb was adsorbed on the exposed portions of the colloid surface by static and hydrophobic interactions.28 The amount of MAb added to the MBA-labelling colloid is 50% more than the minimum amount for coating the unmodified portion of the colloid surface. After MAb reacting with the MBA-labelling gold colloid for 1 h at room temperature, MAb was separated from the solution by centrifugation at 10000 rpm for 10 min, and then the modified colloid was resuspended in 1 mL of a borate buffer solution (2 mM, pH = 9.0).
In the last step, to assure that no space was left around the surface of gold colloids, 10 µL of a BSA (2% m/m) solution was added to the above mentioned MBA-labelling immunogold colloid, to occupy the uncoated places, for 40 min at room temperature. Then, the mixture was centrifuged and resuspended in 1 mL of a borate buffer solution. The MBA-labelling immunogold colloid usually kept stable for three days when stored at 4 °C.
Immobilization of PAb on a silicon or quartz chip.13d
Scheme 1 illustrates the process during which antibodies are immobilized on a silicon or quartz chip. All the silicon and quartz chips (0.8 cm × 1.0 cm) were sonicated in water, ethanol, acetone, chloroform, acetone, ethanol, and water, sequentially to clean before use. The cleaned chips were treated with a freshly prepared piranha solution (98% H2SO4:30% H2O2 = 3:1 v/v) at 90 °C for 10 min, and rinsed with a large volume of ultrapure water. Having been dried with nitrogen gas, the substrates were cured in a drying oven at 100 °C for 30 min. In this way, a surface with hydroxyl groups emerged on the chips.The first step for the immobilization of PAb on the chips is to prepare silanized substrates. The chips with the hydroxy surface were immersed in a dilute solution of APTMS in dried methanol (5% in volume) for 24 h at room temperature in the dark. Then, the substrates were rinsed with a large amount of methanol and cleaned by sonication for 5 min to remove the physisorbed APTMS. The chips were rinsed with ultrapure water, and then dried with nitrogen gas. Finally, the silanized substrates were kept in a drying oven at 120 °C for 30 min.
The second step is to add GA onto the APTMS silanized substrates to form an APTMS–GA surface (Scheme 1). The silanized substrates were washed with a borate buffer solution, and immersed into a borate buffer solution containing 2.5% (v/v) GA for 1 h at room temperature. The amino groups on the APTMS silanized chips reacted with the aldehyde groups of GA, yielding the APTMS–GA surface. Having been rinsed in a borate buffer solution, the chips with the APTMS–GA surface were dried with nitrogen gas.
The third step is to immobilize PAb on the APTMS–GA surface, and then to form an APTMS–GA–PAb surface on the chips (Scheme 1). 40 µL of a borate buffer solution containing PAb (0.05 mg mL−1) was dropped onto the 1.0 × 0.8 cm2 GA-active chip surface and extended uniformly. PAb reacted with the aldehyde groups for 12 h at 4 °C and then the surface was rinsed with ultrapure water to remove the residual PAb and dried. The aldehyde groups remaining after PAb attachment were blocked with 10 mg mL−1L-lysine for 2 h at room temperature. At last, the silicon or quartz chips with the APTMS–GA–PAb surface were carefully washed, and then stored in a 0.1 M Tris/HCl buffer solution at 4 °C until use.
Immunoassay protocol
The immunoassays were conducted by a sandwich structure illustrated as Steps 4 and 5 in Scheme 1. Antigen solutions with different concentrations were obtained by diluting with PBS buffer solutions. 40 µL of the Antigen solution was dropped onto the APTMS–GA–PAb substrate, and the substrate was left for 1 h at room temperature. Then, an APTMS–GA–PAb–Antigen surface was formed on the chips. Having been carefully rinsed with a PBS buffer solution, the APTMS–GA–PAb–Antigen surface were exposed to 50 µL of the MBA-labelling immunogold nanoparticles borate buffer solution for 3 h at room temperature. All the chips were then rinsed with ultrapure water and dried under nitrogen gas. Finally, the chips were modified by the APTMS–GA–PAb–Antigen–immunogold surface.SERS and UV-vis measurements
Silver staining enhancement was conducted with silver nitrate reduced by hydroquinone in the dark to coat the nanoparticles (Step 6 in Scheme 1). The molar ratio of hydroquinone (1 × 10⁻³ mol L−1) to AgNO3 (1 × 10⁻³ mol L−1) (v/v) was 1. The silver staining enhancement step was completed within 20 min. Then, the chips were rinsed with ultrapure water and dried under nitrogen gas.SERS spectra were measured with a confocal microscopic Raman spectrometer (Renishaw 1000 model) with a CCD detector and a holographic notch filter. Radiation of 514.5 nm from an air-cooled argon ion laser (Spectra-Physics model 163-C4260) was used for excitation. Laser power at the sample position was not more than a few milliwatts. The microscope attachment was based on a Leica DMLM system, and a 50× objective was used to focus the laser beam onto a spot of approximately 1 µm in diameter. All the spectra reported were the results of a single 10 s accumulation.
UV-vis spectra were recorded on a Shimadzu UV-3100 spectrophotometer.
Results and discussion
1. The MBA-labelling gold colloid
Gold colloid is superior to other colloids in long-term stability and it has widely been used for the researches of immunogold.28 However, SERS probe molecules, such as MBA, destroy the double-electronic layer around a colloid particle surface, which has been coated by citrate, because of the stronger adsorbability of the thiol group of MBA. This leads to the unstability of colloid particles and the aggregation badly disturbs the immuno-identification between antigen and immunogold, thereby disturbing the SERS detection. Therefore the amount of MBA added to the colloid and the period of stable storage are critical to this method.For optimizing the experimental conditions, we added various quantities of MBA into gold colloid to test the stability of MBA modified gold colloid through centrifugation, and then separated MBA from the solution by centrifugation. When the added amount of MBA (1 × 10⁻³ mol L−1) was less than 5 µL in 1 mL gold colloid (2 × 10⁻⁴ mol gold L−1), the pink gold colloid did not turn blue and remained unchanged at room temperature for at least a week. We consider that this quantity of MBA only occupies a portion of the surface of gold sphere according to the calculated result for the surface occupied by a single thiol (about 20 Å2 molecule−1)32 and the calculated result for a gold particle (4π × (13/2 nm)2). Therefore, there is still some space left for MAb. We also carried out the silver staining experiment without MAb by SERS to know how small an amount of MBA can be detected.
Fig. 1 shows the SERS spectrum of 2.5 µL of MBA (1 × 10⁻³ mol L−1) added to 1 mL of gold colloids followed by silver staining enhancement. In this experiment the laser beam (514.5 nm) was focused on the colloid in a capillary. Strong SERS bands at 1586 and 1076 cm−1 are assigned to the ν8a and ν12 aromatic ring vibrations, respectively, and those at 1373 and 841 cm−1 are assigned to ν(COO−) and δ(COO−), respectively.33 As can be seen from the SERS spectrum, Raman signals are well enhanced after the silver staining enhancement. This experiment also indicates that 2.5 µL of MBA (1 × 10⁻³ mol L−1) in 1 mL gold colloid (2 × 10⁻⁴ mol L−1) is enough for the SERS detection. Though this amount of MBA is far from the amount for coating all colloid particles, MBA adsorbed by physisorption easily dissociates in the colliods and affects the SERS detection. Thus, multiple-rinse by centrifugation and resuspension are necessary.
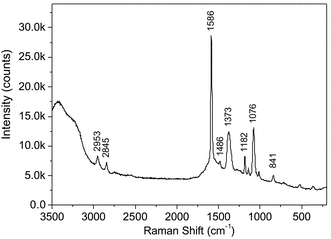 | ||
| Fig. 1 A SERS spectrum of 2.5 µL of MBA (1 × 10⁻³ mol L−1) added into 1 mL gold colloids followed by the silver staining enhancement. Radiation of 514.5 nm was used for excitation, the laser power at the sample position was 40 µW, and the accumulation time was 30 s. | ||
2. Characterization of the sandwich structure on a quartz chip via UV-vis absorption spectra
To confirm the existence of metal gold nanoparticles on the surface of an APTMS–GA–PAb–Antigen–immunogold substrate, we repeated all the steps to assembly this sandwich structure on quartz substrates, and then measured UV-vis absorption spectra of Step 5 and Step 6 in Scheme 1. Fig. 2 (a) and (b) respectively show the UV-vis absorption spectra of the APTMS–GA–PAb–Antigen–immunogold quartz substrate before and after silver staining enhancement. The UV-vis spectrum of the APTMS–GA–PAb–Antigen–immunogold quartz substrate (Curve (a) in Fig. 2) shows an absorption peak at 526 nm, which is attributed to the gold nanoparticles. Thus, based on this characteristic adsorption peak of the gold nanoparticles, we concluded that the MBA-labelling immunogold nanoparticles reacted with Antigen on the APTMS–GA–PAb–Antigen substrate. The UV-vis absorption spectrum of the APTMS–GA–PAb–Antigen–immunogold substrate after the silver staining enhancement (Curve (b) in Fig. 2) shows an obvious plasmon resonance band at 429 nm due to silver. This spectrum proves the existence of silver. In addition, the bandwidth of the silver absorption band suggests that the surface of the APTMS–GA–PAb–Antigen–immunogold substrate becomes a rough surface after the silver staining enhancement, which is very suitable for the SERS detection also.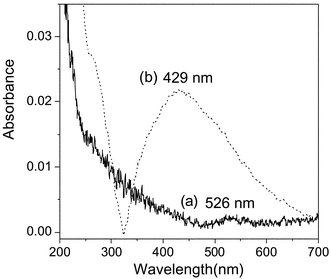 | ||
| Fig. 2 UV-vis absorption spectra of the APTMS–GA–PAb–Antigen–immunogold on a quartz substrate; (a) before and (b) after the silver staining enhancement. | ||
3. Characterization of immunoassays via SERS
The spectral features of MBA in SERS spectra can confirm the selective immunoassays. Fig. 3 shows SERS spectra of MBA adsorbed on the immunogold nanoparticles after the silver staining enhancement. The Antigen solutions with different concentrations of 0, 0.5, 1, 2, 10, 20, 40 and 50 µg mL−1 were examined by the method depicted in Scheme 1, and their SERS spectra are shown in Fig. 3(a)–(h). A comparison between these spectra and the spectrum in Fig. 1 reveals that most of Raman bands in Fig. 3 can be assigned to the vibrational modes of MBA. We dealt the SERS spectra with the Grams-386 software (The Galactic Industries Corporation, USA), assuming the intensity of the peak at 520 cm−1 due to silicon as the intensity of 10000. The Antigen concentration-dependent SERS spectral changes in Fig. 3 indicate that after the silver staining enhancement, the higher the concentration of Antigen captured by the substrate is, the stronger the Raman signals observed are. Fig. 4 illustrates the intensity change at 1585 cm−1 due to the ν8a aromatic ring vibration versus the concentration of Antigen. When the concentration of the Antigen is above 40 µg mL−1, the intensity of the SERS signal at 1585 cm−1 increases rapidly. On the other hand, when the concentration of the Antigen is 0.5 µg mL−1, it is difficult to detect the signals of MBA from the SERS spectrum of Fig. 3(b) . Finally, we developed a calibration model that predicts the concentration of Antigen in the range of 1–40 µg mL−1. The inset of Fig. 4 depicts the model; the correlation coefficient (R) and standard deviation (SD) are 0.98 (n = 5) and 214, respectively, and the non-optimized detection limit of Hepatitis B virus surface antigen is as low as 0.5 µg mL−1.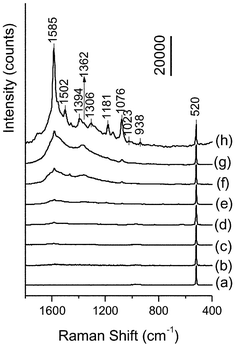 | ||
| Fig. 3 SERS immunoassay using MBA-labelling nanoparticles with the silver staining enhancement method. Antigen with concentrations of 0, 0.5, 1, 2, 10, 20, 40 and 50 µg mL−1 was detected by this method, and their SERS spectra from 1800 cm−1 to 400 cm−1 are shown in (a), (b), (c), (d), (e), (f), (g) and (h), respectively. Radiation of 514.5 nm was used for excitation, the laser power was 40 µW and the accumulation time was 10 s. All the spectra were treated with Baseline and Offset programs by GRAMS 386 software. Then, they were dealt with the normalized operations assuming the intensity of the peak at 520 cm−1 due to silicon as the intensity of 10000. | ||
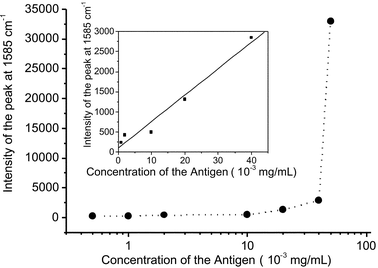 | ||
| Fig. 4 The relationship between the intensity of the SERS signal at 1585 cm−1 and the concentration of Antigen. Inset; a calibration model that predicts the concentration of Antigen in the range from 1 to 40 µg mL−1. | ||
One must notice that some differences exist among the spectra in Fig. 3. Curve (b) has a poor signal to noise ratio because the concentration of Antigen and the amount of the complementary MBA-labelling immunogold nanoparticles are very low. Curve (h) shows a highly increased background from 1800 to 1000 cm−1. The background due to silver on the Raman spectra increased with the increasing concentration of Antigen. This may be explained as follows; for the higher concentration of Antigen, there are more immunogold nanoparticles on the chips. Thus, a great deal of silver aggregates and is deposited onto the immunogold nanoparticles leading to the higher silver background on the Raman spectra. It is noted that the Raman bands in the spectra in Fig. 3 are slightly broader than those in the spectrum in Fig. 1. This is probably caused by the interaction of BSA and MAb with MBA on the gold surface.
Fig. 5 shows SERS spectra of MBA on the APTMS–GA–PAb–Antigen–immunogold substrate where the concentration of Antigen is as low as 0.5 µg mL−1 before (a) and after (b) the silver staining enhancement. It is noted that the intensity of the band at 1585 cm−1 in curve (b) is much stronger than that in curve (a). This means that the process of silver staining enhancement is the major premise for the detection of significant Raman signals. After the silver staining enhancement, the Raman signals can be increased by 10–100 times, thereby improving the detection sensitivity of this immunoassay method.
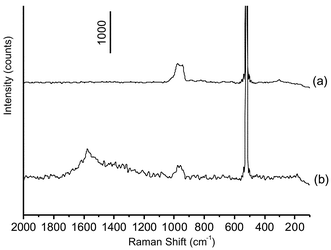 | ||
| Fig. 5 SERS spectra of MBA in immunoassay using the MBA-labelling immunogold nanoparticles. (a) before and (b) after the silver staining enhancement. The detection limit of Antigen was as low as 0.5 µg mL−1. | ||
The sensitivity of an immunoassay is substantially affected by a nonspecific binding. For comparison, a test has been performed where no Antigen was added to the detection system. Because of the lack of the complementary antigens, the MBA-labelling immunogold nanoparticles are easily removed from the substrate during the rinsing step. As a result, we obtained a flat baseline (Fig. 3(a)), confirming the fact that the nonspecific binding between the immunogold nanoparticles and the substrate could be avoided. Another test was performed by using a goat IgG sample as antigen to check the specificity of the MBA-labelling immunogold in the present system. After silver staining enhancement, no band due to MBA was observed in the SERS spectrum in the region of 2000–300 cm−1. These results are consistent with the expectation that a specific reaction only occurs between MAb onto the MBA-labelling immunogold nanoparticles and its complementary antigen (Antigen), and that it does not take place between MAb and other antigens. Both tests mentioned above indicate that nonspecific binding effects can effectively be avoided by BSA and L-lysine. As already described, BSA occupies the remaining surface of gold nanoparticles after MAb attachment, preventing PAb onto the APTMS–GA–PAb substrate from attaching on the surface of the gold nanoparticles. In addition, L-lysine blocks the unreactive aldehyde groups of GA. This partially avoids the adsorption between the aldehyde groups onto the substrate and MAb of the immunogold nanoparticles. They are most likely major factors determining the sensitivity of this assay.
Conclusions
In summary, we have demonstrated a novel method based on MBA-labelling immunogold nanoparticles with the silver staining enhancement for the quantitative detection of Hepatitis B virus surface antigen as a self-assembled sandwich model immobilized on a silicon or quartz substrate. Based on this method, we have developed a calibration model that predicts the concentration of Hepatitis B virus surface antigen. This method has combined the advantages of the SERS technique with those of the nano-labelling method. The silver staining method remarkably enhanced Raman signals by several decuples, improving the detection sensitivity of the immunoassay. The advantages of the immunogold nanoparticles, such as their easily controllable-size distribution, long-term stability and friendly biocompatibility confirm the reproducibility of the immunoassay. However, we are puzzled by the viability of antigens and antibodies after being captured by the substrates in our assay system, which results in the higher detection limit compared with other immune systems. Further experiments on the multifarious antibody-immobilized methods and other immune systems will be carried out. Furthermore, multi-labelled techniques and microarray detections in multiplex immunoassay are now under way in our laboratories.Acknowledgment
We thank Kunming Yuda Monoclonal Antibody Technology Center of Yunnan University of China for generous donation of Hepatitis B virus surface antigens and the complementary antibodies. This study has been supported by the National Natural Science Foundation of China (No. 20273022, 20173019, 20375014, 60271020, 20073016) and the Special Funds for High Tech Research and Development Project (No. 2002AA302203).References
- (a) L. A. Lyon, C. D. Keating, A. P. Fox, B. E. Baker, L. He, S. R. Nicewarner, S. P. Mulvaney and M. J. Natan, Anal. Chem., 1998, 70, 314R–361R; (b) S. P. Mulvaney and C. D. Keating, Anal. Chem., 2000, 72, 145R–157R CAS.
- (a) A. Campion and P. Kambhampati, Chem. Soc. Rev., 1998, 2, 241–249 RSC; (b) K. Kneipp, H. Kneipp, I. Itzkan, R. R. Dasari and M. S. Feld, Chem. Rev., 1999, 99, 2957–2975 CrossRef CAS.
- S. Nie and S. R. Emory, Science, 1997, 275, 1102–1106 CrossRef CAS.
- K. Kneipp, Y. Wang, H. Kneipp, L. T. Perelman, L. Ltzkan, R. R. Dasari and M. S. Feld, Phys. Rev. Lett., 1997, 78, 1667–1670 CrossRef CAS.
- T. M. Cotton, S. G. Schultz and R. P. Van Duyne, J. Am. Chem. Soc., 1980, 102, 7960–7962 CrossRef CAS.
- (a) R. F. Paisley and M. D. Morris, Prog. Anal. Spectrosc., 1988, 11, 111–140 Search PubMed; (b) N. Isola, D. L. Stokes and T. Vo-Dinh, Anal. Chem., 1998, 70, 1352–1356 CrossRef CAS; (c) T. M. Cotton, J. H. Kim and G. D. Chumanov, J. Raman Spectrosc., 1991, 22, 729–742 CAS; (d) X. Dou, T. Takama, Y. Yamaguchi, K. Hirai, H. Yamamoto, S. Doi and Y. Ozaki, Appl. Opt., 1998, 37, 759–763 CAS; (e) T. Vo-Dinh, T. A. Leonardo and L. S. David, J. Raman Spectrosc., 2002, 33, 511–516 CrossRef CAS.
- (a) G. Sakai, K. Ogata, T. Uda, N. Miura and N. Yamazoe, Sens. Actuators, B, 1998, 49, 5–12 CrossRef; (b) M. D. Darren, C. C. David, Y. Hong-Xing and R. L. Christopher, Biosens. Bioelectron., 1998, 13, 1213–1225 CrossRef CAS; (c) S. Toyama, A. Shoji, Y. Yoshida, S. Yamauchi and Y. Ikariyama, Sens. Actuators, B, 1998, 52, 65–71 CrossRef; (d) B. Oh, Y. Kim, W. Lee, Y. M. Bae, W. H. Lee and J. Choi, Biosens. Bioelectron., 2003, 18, 605–611 CrossRef CAS.
- (a) G. U. Lee, D. A. Kidwell and R. J. Colton, Langmuir, 1994, 10, 354–357 CrossRef CAS; (b) V. T. Moy, E. L. Florin and H. E. Gaub, Science, 1994, 266, 257–259; (c) U. Dammer, M. Hegner, D. Anselmetti, P. Wagner, M. Dreier, W. Huber and H-J. Guntherodt, Biophys. J., 1996, 70, 2437–2441 CAS; (d) V. W. Jones, J. R. Kenseth and M. D. Porter, Anal. Chem., 1998, 70, 1233–1241 CrossRef CAS; (e) M. C. Coen, R. Lehmann, P. Gröning, M. Bielmann, C. Galli and L. Schlapbach, J. Colloid Interface Sci., 2001, 233, 180–189 CrossRef CAS; (f) L. Li, S. Chen, S. Oh and S. Jiang, Anal. Chem., 2002, 74, 6017–6022 CrossRef CAS.
- (a) C. R. Suri, P. K. Jain and G. C. Mishra, J. Biotechnol., 1995, 39, 27–34 CrossRef CAS; (b) K. Nakanishi, H. Muguruma and I. Karube, Anal. Chem., 1996, 68, 1695–1700 CrossRef CAS.
- (a) J. P. Gosling, Clin. Chem., 1990, 36, 1408–1427 CAS; (b) E. Ishikawa, S. Hashida, T. Kohno and K. Hirota, Clin. Chim. Acta, 1990, 194, 51–72 CrossRef CAS; (c) C. M. Duan and M. E. Meyerhoff, Anal. Chem., 1994, 66, 1369–1377 CrossRef CAS.
- W. C. W. Chan and S. M. Nie, Science, 1998, 281, 2016–2018 CrossRef CAS.
- M. Bruchez, M. Moronne, P. Gin, S. Weiss and A. P. Alivisatos, Science, 1998, 281, 2013–2016 CrossRef CAS.
- (a) S. D. Mangru and D. J. Harrison, Electrophoresis, 1998, 19, 2301–2307 CAS; (b) X. Z. Wu, M. Suzuki, T. Sawada and T. Kitamori, Anal. Sci., 2000, 16, 312–323; (c) M. Hashimoto, K. Tsukagoshi, R. Nakajima, K. Kondo and A. Arai, J. Chromatogr., A, 2000, 867, 271–279 CrossRef CAS; (d) J. Yakovleva, R. Davidsson, A. Lobanova, M. Bengtsson, S. Eremin, T. Laurell and J. Emnéus, Anal. Chem., 2002, 74, 2994–3004 CrossRef CAS.
- (a) C. A. Mirkin, R. L. Letsinger, R. C. Mucic and J. J. Storhoff, Nature, 1996, 382, 607–609 CrossRef CAS; (b) A. P. Alivisatos, K. P. Johnsson, X. Peng, T. E. Wilson, K. P. Johnsson, C. J. Loweth, M. P. Bruchez, Jr and P. G. Schultz, Nature, 1996, 382, 609–611 CrossRef CAS; (c) R. Elghanian, J. J. Storhoff, R. C. Mucic, R. L. Letsinger and C. A. Mirkin, Science, 1997, 277, 1078–1081 CrossRef CAS; (d) C. J. Loweth, W. Caldwell, X. Peng, A. P. Alivisatos and P. G. Schultz, Angew. Chem. Int. Ed., 1999, 38, 1808–1812 CrossRef CAS.
- M. A. Hayat, Colloid Gold: Principles, Methods and Applications, Vol. 1, Academic Press, San Diego, 1989 Search PubMed.
- N. T. K. Thanh and Z. Rosenaweig, Anal. Chem., 2002, 74, 1624–1628 CrossRef CAS.
- N. Levit-Binnun, A. B. Lindner, O. Zik, Z. Eshhar and E. Moses, Anal. Chem., 2003, 75, 1436–1441 CrossRef.
- (a) Z. F. Ma and S. Sui, Angew. Chem. Int. Ed., 2002, 41, 2176–2179 CrossRef CAS; (b) T. A. Taton and C. A. Mirkin, Science, 2000, 289, 1757–1760 CrossRef CAS.
- B. S. Mann, W. Shenton, M. Li, S. Connolly and D. Fitzmaurice, Adv. Mater., 2000, 12, 147–150 CrossRef CAS.
- J. Masai, T. Sorin and S. Kondo, J. Vac. Sci. Technol., A, 1990, 8, 713–717 CrossRef.
- (a) J. A. Creighton, C. G. Blatchford and M. G. Albrecht, J. Chem. Soc., Faraday Trans., 1979, 75, 790–798 Search PubMed; (b) P. C. Lee and D. Meisel, J. Phys. Chem., 1982, 86, 3391–3395 CrossRef CAS; (c) A. M. Ahern and R. L. Garrell, Anal. Chem., 1987, 59, 2813–2816 CrossRef CAS; (d) J. Neddersen, G. Chumanov and T. M. Cotton, Appl. Spectrosc., 1993, 47, 1959–1964 CAS; (e) M. S. Sibbald, G. Chumanov and T. M. Cotton, J. Phys. Chem., 1996, 100, 4672–4678 CrossRef CAS; (f) U. Nickel, A. Zu Castell, K. Po ppl and S. Schneider, Langmuir, 2000, 16, 9087–9091 CrossRef CAS.
- X. Dou, T. Takama, Y. Yamaguchi, H. Yamamoto and Y. Ozaki, Anal. Chem., 1997, 69, 1492–1495 CrossRef CAS.
- J. Ni, R. J. Lipert, G. Dawson and M. D. Porter, Anal. Chem., 1999, 71, 4903–4908 CrossRef CAS.
- S. Link, Z. L. Wang and M. A. El-Sayed, J. Phys. Chem., B, 1999, 103, 3529–3533 CrossRef CAS.
- P. F. Liao, J. G. Bergman and D. S. Chemla, etc., Chem. Phys. Lett., 1981, 82, 355–359 CrossRef CAS.
- B. Hu, W. Xu, K. Wang, Y. Xie and B. Zhao, Acta Sci. Nat. Univ. Jilin., 2001, 2, 57–61 Search PubMed.
- N. H. Kim, S. J. Lee and K. Kim, Chem. Commun., 2003, 6, 724–725 RSC.
- P. Baudhuin, P. Smissen, S. Beauvois and P. Courtoy, in Colloidal Gold Principles, Methods, and Applications, ed., M. A. Hayat, Academic Press, New York, 1989, vol. 2, p. 1 Search PubMed.
- G. Frens, Nat. Phys. Sci., 1973, 241, 20–21 Search PubMed.
- C. S. Weisbecker, M. V. Merritt and G. M. Whitesides, Langmuir, 1996, 12, 3763–3772 CrossRef CAS.
- S. Murali, Curr. Sci., 2000, 78, 1089–1097 Search PubMed.
- L. H. Dubois and R. G. Nuzzo, Annu. Rev. Phys. Chem., 1992, 43, 437–463 CrossRef CAS.
- A. Michota and J. Bukowska, J. Raman Spectrosc., 2003, 34, 21–25 CrossRef CAS.
| This journal is © The Royal Society of Chemistry 2004 |