On-site monitoring of biogenic emissions from Eucalyptus dunnii leaves using membrane extraction with sorbent interface combined with a portable gas chromatograph system
Xinyu
Liu
,
Richard
Pawliszyn
,
Limei
Wang
and
Janusz
Pawliszyn
*
Department of Chemistry, University of Waterloo, Ontario, Canada N2L 3G1
First published on 11th December 2003
Abstract
Membrane extraction with sorbent interface, combined with a portable gas chromatograph system (MESI-Portable GC) for continuous on-line monitoring of biogenic volatile organic compounds (BVOCs) emissions (from leaves of Eucalytus dunnii in a greenhouse), is presented herein. A sampling chamber was designed to facilitate the extraction and identification of the BVOCs emitted by the Eucalytus dunnii leaves. Preliminary experiments, including; enrichment times, microtrap temperatures, stripping gas flow rates, and desorption temperatures were investigated to optimize experimental parameters. The main components of BVOCs released by the Eucalytus dunnii leaves were identified by comparing the retention times of peaks with those of authentic standard solutions. They were then confirmed with solid phase microextraction coupled with gas chromatography and mass spectrometry (SPME-GC-MS). BVOC emission profiles of α-pinene, eucalyptol, and γ-terpinene emitted by intact and damaged Eucalytus dunnii leaves were obtained. The findings suggest that the MESI-Portable GC system is a simple and useful tool for field monitoring changes in plant emissions as a function of time.
1. Introduction
Plants contain a number of volatile organic compounds. The volatile and semi-volatile organic atmospheric traces gases, other than carbon dioxide and monoxide, produced by plants and other live species are known as biogenic volatile organic compounds (BVOCs). They include isoprene, mono- and sesquiterpenes, alkanes, alkenes, carbonyls, alcohols, esters, ethers, and acids, and are typically present in the atmosphere in concentrations between several ppt and several ppb.1,2BVOCs play an active and dynamic role in mediating the interaction between plants and other organisms. They are a defensive mechanism against pathogenic insects and herbivores.3–5 BVOCs can also serve as a chemical signal to attract natural enemies (such as parasitic and predatory insects) of the herbivore to the damaged plant. For example, in response to insects feeding on leaves, a plant will release elevated levels of certain BVOCs. The chemical identities of the BVOCs vary with the plant species and the insect species. BVOCs also participate as semiochemicals, inducing defence responses in neighbouring plants.6,7
Because BVOCs comprise a significant fraction of the total VOC inventory and possess high reactivity with other atmospheric constituents, BVOC emissions have a significant influence on tropospheric chemistry. They may react with anthropogenic compounds and form photochemical smog and tropospheric ozone.8 Accurate estimates of BVOC emissions are critical for air quality planning in some areas.9
In order to model biogenic emissions and determine the chemical composition of BVOCs, efforts have been directed toward the development of techniques for the identification, characterization, and quantification of BVOCs. Previous work in studying plant volatiles has usually involved the use of cut plants,10–13 macerated plants,10,14,15 vacuum steam distillates16 or organic solvent extractives.17,18 The most common methods for extraction and preconcentration are the headspace technique,19 purge-and-trap,20 liquid–liquid extraction,21 and solid-phase extraction.22 Although these methods may be suitable for determining the types of volatile compounds present, they are not suitable for determining the identity of the specific compounds emitted, since artefacts may be introduced during analysis. For example, steam distillation may result in artefact formation through the heating of unstable target analytes. Solvent extraction can introduce contaminants via the solvents, and tissue maceration or grinding can induce the formation of enzyme-catalyzed oxidation products. In addition to artefact formation, other disadvantages of these methods are that they are time consuming (and as such, not real-time monitoring), are tedious, and often result in loss of analytes. Although these techniques offer important information about BVOCs of the plant, they may not reflect the real BVOC profiles of the living plant.23,24 Moreover, the release of BVOCs by a given plant species exhibits important temporal and spatial variation. Many environmental factors such as temperature, light radiation, air composition, foliar moisture, and mechanical stress and injury can affect BVOC emissions.1 Most of the aforementioned analytical techniques require relatively long collection periods.25,26 Consequently, they do not provide information on the release of compounds emitted over short periods of time.
An ideal extraction system should be solvent-free, highly selective, rugged, possess a simple design for long-term reliable performance, and an integrated and uninterrupted process. It should be amenable to field monitoring. A relatively novel technique, membrane extraction with sorbent interface (MESI), which embodies several of these characteristics, has been developed.27,28
The MESI technique has been used to investigate air, water, and plants.29–31 But the majority of these studies have been performed in the laboratory. In this study, we describe an on-site application of MESI, combined with a portable GC (MESI-Portable GC), to study the characterization and quantification of BVOCs emitted by a living Eucalyptus dunnii tree in a greenhouse using a specially designed sampling chamber. To optimize the experimental conditions and obtain real-time data, preliminary experiments to determine the enrichment time, trap temperature, stripping gas flow rate, and desorption temperature have been pursued. A group of monoterpenes, including eucalyptol, α-pinene, and γ-terpinene, were selected as target analytes and their circadian profiles emitted by intact and damaged leaves were investigated.
2. Apparatus and experimental design
2.1 MESI-Portable GC system
The MESI-Portable GC system (Fig. 1) includes a membrane extraction module, a microtrap, a control unit for the cooler and heater, a portable GC, and a computer system. To expose the leaf under sunlight and reduce the effect of adsorption by the wall of the sampling device, the sampling chamber was designed and assembled using plastic materials (Fig. 2). It consisted of a PET plastic cylinder (195 mm wide, ø = 95 mm) into which leaves from a Eucalyptus dunnii tree could be inserted through a hole in one of its ends. A microfan (Startech, Taipei), powered by a 12 V DC, was fitted to the other end of the chamber. The analytes were agitated with the fan on the surface of the membrane to improve the diffusion of analytes molecules from the surface of the sample to the boundary layer and through the boundary layer to the membrane outer surface. At the top of the chamber, the membrane module was placed into the chamber. Beside the membrane module, a 5 mm hole sealed with half-hole-type Thermogreen LB-1 septa (Supelco, Bellefonte, PA, USA) was used to introduce the SPME fibre for simultaneous sampling. The entire system was airtight.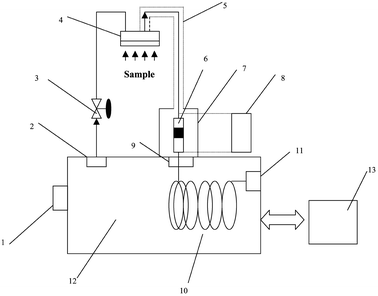 | ||
| Fig. 1 Schematic diagram of the MESI-Portable GC system: 1 = attached hydrogen generator; 2 = pressure regulation valve; 3 = flow controller; 4 = membrane module; 5 = heating tape for sample transfer; 6 = microtrap; 7 = control unit for heater and cooler; 8 = power supply for control unit; 9 = GC injector; 10 = capillary column; 11 = detector; 12 = GC oven; 13 = computer. | ||
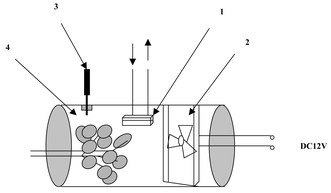 | ||
| Fig. 2 On-site sampling device for plant monitoring: 1 = membrane module; 2 = microfan; 3 = SPME holder and fibre; 4 = plastic cylindrical body. | ||
A flat sheet of PDMS membrane (dimethylsilicone membrane, SSP-M100C.001, 25 µm thickness) was purchased from Membrane Components (Ballston Spa, NY, USA). It was fixed in a membrane module from Restek Corp. (Bellefonte, PA, USA). The design of the membrane module was presented in previous work.32 One side of the membrane was exposed to the sample and the other side to the carrier gas. Teflon washers and stainless steel plates were used on both sides of the membrane. A fine stainless steel wire mesh, mounted in a stainless-steel plate, supported the exterior of the membrane that was exposed to the sample. Both plates were fastened with screws. The carrier gas pressure lifted the membrane and allowed the free passage of gas to the outlet tubing on the opposite side of the membrane surface. After leaving the membrane module, the carrier/stripping gas and analytes proceeded to the microtrap.
A Tenax microtrap obtained from Restek Corp. (Bellefonte, PA,USA) was conditioned under nitrogen at 200 °C for 2 h before being used. A schematic representation of the microtrap design was shown in previous work.32 It was prepared by packing the polymer material into a piece of silicosteel tube (5 cm × 0.75 mm id). The bed length was 1.7 cm and the sorbent was 60/80 mesh. Quartz wool was placed at both ends of the sorbent bed to retain the packing material. It was placed at the entrance to the GC column and acted alternately as an accumulator and an injector.
A control unit (Fig. 3) was designed to facilitate the temperature control of the microtraps. It consisted of a cooler and a heater and allowed the microtrap to work as both an enrichment well and an injection port. During the period of enriching, a one-stage semiconductor-based cooler (Melcor Corp., Trenton, NJ, USA), which was assembled in the unit, was used to lower the temperature of the microtrap to −10 °C. An adjustable DC current power supply (AB-8, ABRA, Ontario, Canada) was used to drive this cooler. After a specified trapping period, a separated DC current was applied to the microtrap to thermally desorb all the analytes into the carrier stream for GC analysis. For these experiments, the DC current was controlled manually by applying a DC power supply. A Variac was used to regulate the AC power to a given level before it was delivered to the DC power supply. The microtrap temperature was heated to 200 °C and maintained for 1 min by slightly adjusting the Variac. A Fluke 53II thermocouple thermometer (Fluka Corp., Everett, WA, USA), with a sensor wire tightly wrapped around the microtrap, was used to monitor the changes of temperature during desorption.
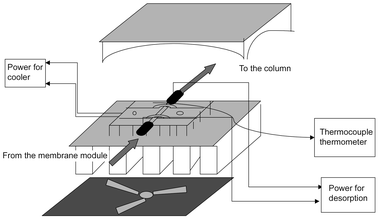 | ||
| Fig. 3 Schematic diagram of the MESI control unit. | ||
A connection between one end of the microtrap and the membrane module was installed with 0.04 in. od Teflon tubing. The other end of the microtrap was connected with 0.165 in. od Teflon tubing. The arrangement of the tubing connected with the microtrap prevented the heat loss, back-flushing, and possible short circuits with other parts of this system during desorption. The transfer lines used to connect the other components were 1/16 in. deactivated stainless steel tubing. In order to eliminate the signal measured by the detector that could come from the analyte condensed on the walls of the tubing, all of the transfer lines were heated to approximate 170 °C with Omegalux™ heating tape (Omega, Stamford, Connecticut, USA).
An attached hydrogen generator and a built-in “whisper quiet” air compressor provided all of the gases required for operation, so this system could easily be deployed to the greenhouse. A desktop computer was used to control the overall operation of the GC system and process the results.
2.2 Standard gas generation system
A “liquid injection” standard gas generation system was built for supplying standard gas mixture because of its flexibility in generating standard gases of widely varying concentration and composition. By measuring the flow rate of gas used and the weight loss of the syringe, the outgoing concentration was calculated.332.3 Materials and procedures
Branches and leaves from a Eucalyptus dunnii tree growing in the greenhouse of the Department of Biology at the University of Waterloo were monitored on site. α-Pinene, eucalyptol, and γ-terpinene were purchased from Sigma-Aldrich (Mississauga, ON, Canada). SPME fibre with 65 µm divinylbenzene/polydimethylsiloxane (DVB/PDMS) coating was obtained from Supelco (Bellefonte, PA, USA). Nitrogen was purchased from Praxis (Waterloo, ON, Canada).MESI-Portable GC continuous on-site monitoring was performed using a portable model 8610C GC (SRI instruments, Torrance, CA, USA) equipped with a flame ionization detector (FID), a hydrogen generator, and an MXT-VOL® silicosteel capillary column (diphenyl/dimethyl polysiloxane) (10 m × 0.53 µm id, df 3.0 µm) (Restek Corp., Bellefonte, PA, USA). Hydrogen produced by the SRI hydrogen generator was used as carrier gas/stripping gas at a flow rate of 5 ml min−1. The initial column temperature was 50 °C, held for 2 min, then increased at a rate of 5 °C min−1 to 200 °C. The temperatures of the injection port and detector were set at 250 °C.
GC-MS analyses with SPME were performed using an Agilent 6890A GC coupled with an Agilent 5973 MS detector. It was equipped with an Rtx-5MS capillary column (30 m × 0.25 mm, df 0.25 µm) (Restek Corp., Bellefonte, PA, USA). Helium (TAG grad) obtained from Praxis (Waterloo, ON, Canada) was used as the carrier gas at 1 ml min−1. The initial column temperature was 50 °C, held for 3 min, and then increased at a rate of 10 °C min−1 to 250 °C, and then held for 2 min. The MS spectra were recorded by the electron ionization (EI) mode with a scan range from 50 to 300 amu at a scan frequency of 2.94 scans s−1. The filament emission current was 39.6 µA. The temperature of the transfer line was 280 °C. Identification of eluants was performed using a NIST 98 spectra database.
A standard gas generator as described above was used to deliver the standard gas mixture of α-pinene, eucalyptol, and γ-terpinene for studying the breakthrough of the target analytes and the determination of the extraction time profile. The same standard gas mixture was also used to investigate the effects of the stripping gas flow rate, the temperature of the membrane module, the microtrap sampling temperature, the desorption temperature, humidity, and UV light radiation. The mixture contained 0.8535 g of α-pinene, 0.9237 g of eucalyptol, and 0.8468 g of γ-terpinene. The diluting flow rate (high purity nitrogen) was 500 ml min−1, and the standard gas mixture was supplied from the syringe pump at a rate of 30.6 ng min−1.
Breakthrough time was determined using two Tenax microtraps in series. The first microtrap was cooled at −5 °C with a one-stage semiconductor-based cooler. The second microtrap was dipped in a small styrofoam box (8.5 × 9 × 2 cm) filled with dry ice. The temperature of the second microtrap was kept around −65 (±2 °C) by adding dry ice intermittently. The heater part of the control unit was connected with the second microtrap. It was used to heat the second microtrap to 200 °C and maintained for 1 min during the analysis period. At 10 min intervals, the second microtrap was analyzed to determine whether the analyte had been eluted from the first microtrap, indicating breakthrough. The breakthrough time was defined as the time required for the peak areas to be greater than 3 times the noise level. Gas flow rate experiments were performed at 3.5, 5.0, and 7.0 ml min−1, and each experiment was repeated twice.
During the extraction time profile experiments, trapping times included 10, 30, 50, 70, 90, and 110 min. To determine the effect of the stripping gas flow rate on extraction efficiency, different flow rates (4, 7.5, and 11.5 ml min−1) were obtained by adjusting the flow controller (Fig. 1). The actual flow rates were verified using a calibrated flowmeter (Brooks Instrument Division, Emerson Electric Canada, Markham, ON, Canada). When the effect of microtrap sampling temperature was examined, different voltages (0, 2, 4, and 8 V) were used to drive the one-stage semiconductor-based cooler, and 25, 10, 0, and −5 °C temperatures were obtained, respectively. When the effect of the desorption temperature was studied, after a given extraction time the membrane module was removed from the sampling chamber, and the outside surface of the membrane module was cleaned by purging with nitrogen gas. The microtrap was then thermally desorbed three times at the same desorption temperature. Three desorption temperature levels (110, 160, and 200 °C) for the microtrap were obtained by supplying 26, 40, and 53 V to the heater in the control unit.
During the experiments to examine the effect of the membrane module temperature, a heating block (4.2 × 4 × 1.2 cm) was set up on the top of the membrane module and was fastened with a clip. The bottom of the membrane module was completely exposed above the sample without any interference. A thermocouple sensor wire was put into one hole in the block and was sealed with asbestos. Both the heating block and thermocouple sensor were connected to an electronic heat control device designed and constructed by the Electronics Science Shop at the University of Waterloo. The set temperatures (25, 60, 120 °C) were maintained steadily. The effects of some possible environmental factors (humidity, sunlight) on the extraction efficiency of this system were also studied. Humidity of the standard gas mixture was adjusted by introducing a glass vessel containing water into the carrier gas lines. The diluting carrier gas (high quality nitrogen) was bubbled through the water prior to sampling. A hygrometer, purchased from a local hardware store, was connected with the vent of the sampling chamber of the standard gas generator and was used to monitor the humidity in the chamber. When determining the effect of UV radiation, the samples were exposed under ZETA® 7500 portable UV spot lamp (Loctite, CT, USA). The vertical distance between the sample and the bulb (100 W) was 10 cm and the radiation area had a 1 inch diameter. Different exposure times of 0, 4, and 8 h were applied to the samples, and then the samples were analyzed by GC.
The system response to the target analytes was calibrated using the standard gas mixture. The standard gas generator, as described herein, was used to prepare a mixture of the three compounds in nitrogen. The calibration curve was constructed for α–pinene, eucalyptol, and γ-terpinene. For this experiment, a mixture containing 0.9535 g of α–pinene, 0.9437 g of eucalyptol, and 0.8568 g of γ-terpinene was used. High purity nitrogen was used as the diluting gas at a flow rate range of 100–900 ml min−1. The standard mixture was supplied from the syringe pump at a rate of 30.6 ng min−1.
In the greenhouse, a branch of Eucalyptus dunnii with 20 adult leaves and 15 young leaves was sealed in the sampling device (Fig. 2). The carrier gas flow rate was 5.0 ml min−1. The desorption temperature was 200 °C and was sustained for 1 min. To monitor the changes of BVOC emissions this procedure was performed every 25 min for about 8 h. The sampling container was continuously sealed during the sampling periods. At the end of the monitoring, the leaves were cut into pieces (∼1 cm2) in order to determine whether the corresponding peaks of the target analytes had increased. At the same time a SPME fibre (DVB/PDMS) was inserted into the sample chamber. Working solutions of authentic standards were prepared as methanolic dilutions, directly injected into the column, and analyzed under the same experimental parameters. Their retention times were used to identify the compounds. The fibre was transferred to the lab and the absorbed analytes were immediately desorbed and chromatographed under the conditions described herein.
In addition to the assays of intact leaves, the same procedure was used to measure emission profiles of mechanically damaged leaves. In these studies, immediately before sealing the branch inside the sampling devices, 12 small holes (diameter roughly 2 mm) were randomly made in the leaf surface with a stainless steel needle to simulate lesions resulting from insect aggressions. The branch was kept sealed overnight and was analysed on day two. These experiments were performed in the lab and daily blank runs were carried out to check for the presence of artefacts and contaminants from previous analyses.
2.4 Quantification of BVOCs emitted from Eucalyptus dunnii
The concentration of unknown can be calculated using the following equation.34 | (1) |
3 Results and discussion
3.1 Breakthrough of the analytes
A key problem of on-line monitoring with a MESI system involves the collection of a representative sample. The collection technique must ensure that the analyte can be quantitatively recovered and sufficiently concentrated to provide the necessary sensitivity. To ensure that the experimental results reflect the actual information of the analytes, particular attention should be paid to determine the “breakthrough”. Breakthrough is an important parameter that is often used in evaluating the collection properties of a sorbent trap in the process of sampling and it can indicate the reliability of the MESI method. The results of breakthrough times of the target analytes are presented in Table 1. As expected, physico-chemical properties of the sorbent (Tenax) and sorbate determine the extracted amounts of the analytes, and adsorption of the analytes increases with the heavier molecular weights, higher boiling points, and more similar structures of adsorbent materials.37,38 Thus, at the same flow rate (e.g. 3.5 ml min−1), α-pinene, the compound with lowest molecular weight and the lowest boiling point among the three analytes, had the shortest breakthrough time (36 min). γ-Terpinene, the compound with a similar “benzene” structure to Tenax, the largest molecular weight, and the highest boiling point among the three analytes, exhibited the longest breakthrough time (more than 240 min).| Breakthrough time/min (n = 2) | |||
|---|---|---|---|
| Flow rate/ml min−1 | α-Pinene | Eucalyptol | γ-Terpinene |
| a Experimental parameters: Microtrap temperature −5.0 °C; stripping gas flow rate varied. The concentration of each component was 0.0585 µg ml−1 of α–pinene, 0.1115 µg ml−1 of eucalyptol, and 0.0576 µg ml−1 of γ-terpinene respectively. | |||
| 3.5 | 36 | 68 | >240 |
| 5.0 | 29 | 54 | 228 |
| 7.0 | 20 | 32 | 102 |
As presented in Table 1, the breakthrough time was also related to the flow rate of stripping gas. When the flow rate was increased from 3.5 to 7.0 ml min−1, the breakthrough times of α-pinene, eucalyptol, and γ-terpinene were reduced from 36 to 20 min, 68 to 32 min, and more than 240 to 102 min, respectively. The use of high flow rates can improve permeation of analytes through the membrane and accelerates the rate of enrichment on the microtrap. However, high flow rates will also increase the risk of stripping the analytes from the microtrap and reduce breakthrough times. This phenomenon can be explained by the Mecklenburg equation:39
 | (2) |
3.2 Extraction time profile
Extraction time profile was an additional parameter that was examined to confirm the breakthrough time. Based on eqn. (1), the amount of analytes expected was proportional to the extraction time before the breakthrough of analytes. As shown in Fig. 4, the extraction amounts of eucalyptol and α-pinene increased slowly after 50 min, whereas γ-terpinene increased from the beginning of the experiment. The correlation coefficients (r) of α-pinene and eucalyptol between the extraction time (no more than 50 min) and the extraction amount were 0.980 (n = 3) and 0.998 (n = 3), respectively. But for γ-terpinene, the linearity of extraction time and the extraction amount could be extended to 110 min (r = 0.998, n = 6). The reason was that γ-terpinene had the longest breakthrough time and was easily enriched in the microtrap, while α-pinene had a detectable breakthrough after 29 min (see Table 1). Based on the breakthrough time and extraction time profile experiments, 25 min interval with a stripping gas flow rate of 5 ml min−1 was selected for the sampling time.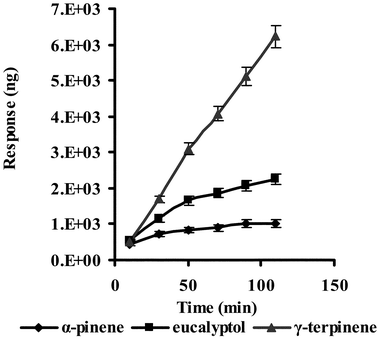 | ||
| Fig. 4 Effect of extraction time on extraction efficiency of analytes: stripping gas flow rate: 5 ml min−1. Other parameters as described in Table 1. | ||
3.3 Effect of stripping gas flow rate
The stripping gas flow rate affects the extraction efficiency. A high flow rate will increase the concentration gradient between the outer and inner surfaces of the membrane and lead to higher permeability of analytes. But at the same time, a high flow rate may shorten the breakthrough time of the microtrap and decrease its extraction efficiency. The selection of an optimum gas flow rate is a trial and error procedure. In this study, the enrichment of analytes was increased concurrently with the flow rate. From 4.0 to 11.5 ml min−1, the signal intensities of α-pinene, eucalyptol, and γ-terpinene increased 18.9%, 34.4%, and 39.0%, respectively. A plateau was not reached because the attached hydrogen generator could not generate a flow rate that exceeded 15 ml min−1. However, if used, high flow rates would consume more generated hydrogen and reduce the continuous operation capability of this system. If a stripping gas flow rate of 5 ml min−1 was applied, this system could perform continuous analyses for more than 48 h.3.4 Effect of temperature of membrane module
Experimentally, membrane temperatures of 25 °C, 60 °C, and 120 °C were investigated to determine the effect of the temperature of the membrane module on the extraction efficiencies of the system. The average extracted amounts of α-pinene, eucalyptol, and γ-terpinene were 1889, 1370, and 2431 ng (at 25 °C); 1650, 1207, and 2154 ng (at 60 °C); 1507, 1270, and 2359 ng (at 120 °C), respectively. Temperature is an important factor in the extraction, affecting both the distribution constant and the diffusion coefficient of analytes. The effects are opposite for these two parameters. A relatively low extraction temperature results in a higher extraction rate.40,41 Thus, when the membrane temperature was increased from 25 °C to 60 °C, it was observed that the response intensities of α-pinene, eucalyptol, and γ-terpinene decreased by 12.6%, 11.9%, and 11.4%, respectively. However, when the temperature was increased to 120 °C, the response intensity of α-pinene continued to decrease as expected, but the responses of extracted amounts of eucalyptol and γ-terpinene slightly elevated to those at 60 °C. Eucalyptol and γ-terpinene are higher boiling points compounds (more than 176 °C) and the stripping of semivolatile compounds is not very efficient at relatively low temperature.40,42 If the membrane temperature increased to the higher temperature (120 °C in this experiment), effectively desorbing (evaporating) the analytes from the inner side of the membrane, it could compensate to some extent for the decrease of the distribution constant due to the increase of temperature. So the total extraction efficiencies of eucalyptol and γ-terpinene were slightly higher at 120 °C than at 60 °C. The effects of temperature change on distribution constant, diffusion coefficient, and the desorption from the membrane explain why the effect of the temperature on the PDMS membrane was different for various analytes.3.5 Effect of sampling temperature of microtrap
For a given analyte-adsorbent, the capacity factor depends upon the microtrap temperature. An empirical equation of the following form has been suggested43:| K = K0eΔH/RT | (3) |
3.6 Effect of desorption temperature
Most regulatory quality control requirements allow carryover that is either less than the minimum detectable limit (MDL) or less than 10% of the reported analyte concentration. The boiling points of α-pinene, eucalyptol, and γ-terpinene are relatively high and the affinities between compounds and packing materials are strong, so the system should exhibit carryover without a suitable desorption temperature. In order to reduce the extent of carryover, high desorption temperatures must be applied. The Tenax microtrap can sustain relatively high temperatures (375 °C), but if the temperature is too high (>230 °C), the polymeric material will shrink, resulting in poor extraction capacity. Table 2 displays data for the efficiency of desorption in terms of ANi, which is defined as follows: | (4) |
is the total area of 3 times the desorption, at a selected temperature. AN1 > 90% indicates an acceptable desorption temperature. The desorption efficiencies of α-pinene, eucalyptol, and γ-terpinene at different desorption temperatures are listed in Table 2. For α-pinene, 110 °C was high enough such that no significant carryover was observed, but for eucalyptol and γ-terpinene, higher desorption temperatures were required (at 110 °C a high degree of carryover was observed, and at 160 °C carryover was still needed to be reduced). As such, a temperature of 200 °C was selected as a suitable desorption temperature for the three target analytes (Table 2).
| α-Pinene | Eucalyptol | γ-Terpinene | |||||||
|---|---|---|---|---|---|---|---|---|---|
| Desorption temperatures/°C | AN 1 | AN 2 | AN 3 | AN 1 | AN 2 | AN 3 | AN 1 | AN 2 | AN 3 |
| 110 | 98.5 | 1.3 | 0.2 | 88.2 | 6.8 | 5.0 | 85.7 | 9.1 | 5.2 |
| 160 | 99.1 | 0.8 | 0.1 | 91.8 | 4.4 | 3.8 | 92.9 | 5.9 | 1.2 |
| 200 | 99.3 | 0.6 | 0.1 | 94.1 | 4.0 | 1.9 | 95.6 | 4.0 | 0.4 |
3.7 Effect of humidity
The effect of humidity on the extraction efficiency is an important factor in field analysis. Although PDMS membrane is hydrophobic, a small amount of water can still penetrate into the membrane and result in an increase in the tortuosity of the diffusion path. The partition coefficient of the analytes between the membrane and air will be reduced with the increase in relative humidity (RH), because the partition coefficient of an analyte between the membrane and air is usually greater than that between the membrane and water. The permeability is the product of diffusivity and solubility, and with the reduction of the two factors, the extract efficiency is decreased. Experimentally, when the humidity was increased from 24% to 72% RH, the extraction amounts of α-pinene, eucalyptol, and γ-terpinene were reduced by 12.1%, 10.6%, and 5.9%, respectively.3.8 Effect of UV light radiation
It was observed that α-pinene and eucalyptol were stable under UV radiation. However, γ-terpinene was not as stable, and the amount of unknown compound, possibly the rearrangement product of γ-terpinene,44 was proportional to the length of time that γ-terpinene was exposed directly to UV radiation. In the chromatogram of γ-terpinene standard solution, an unidentified peak existed but the peak area ratio of this peak to the peak of γ-terpinene was 1.5:100. When the UV radiation exposure time was extended from 4 to 8 h, the peak area ratio of unidentified peak to γ-terpinene increased from 54:100 to 370:100. These findings emphasize the need to prevent the exposure of the standard gas to the sunlight radiation when it is used as a calibration gas.3.9 System calibration
The calibration curves obtained showed good linearity. α-pinene was linear to 45.2 µg l−1 (r2 = 0.987, n = 6), eucalyptol was linear to 49.0 µg l−1 (r2 = 0.990, n = 6), and γ-terpinene was linear to 45.0 µg l−1 (r2 = 0.999, n = 6). The slightly lower regression coefficient for α-pinene may be due to the fact that α-pinene exhibited breakthrough at a higher concentration. Detection limits, measured on the basis of S/N = 3, for α-pinene, eucalyptol, and γ-terpinene were 0.8, 0.5, and 0.8 µg l−1, respectively. The coefficient of variation (CV %) from repeating seven samples for each concentration of the three monoterpenes was in the range 3.5–4.9%.3.10 Identification of target analytes
Fig. 5A represents a chromatogram of the BVOCs emitted from intact Eucalyptus dunnii leaves. Fig. 5B illustrates a chromatogram of the analytes from cut Eucalyptus dunnii leaves. The suspected target analytes with the retention times of 8.36 min, 10.64 min, and 10.82 min (shown in Fig. 5A) were tentatively identified as α-pinene, eucalyptol, and γ-terpinene by comparing the retention times of the standard solution because their corresponding retention times were within ±5% tolerance level. Fig. 5B demonstrates the significant increase in the intensity of the specific peaks extracted by the MESI system following the cutting of the Eucalyptus dunnii leaves. Levels of α-pinene, eucalyptol, and γ-terpinene were raised 2.96, 17.0, and 19.3 times, respectively. The existences of α-pinene, eucalyptol, and γ-terpinene were confirmed by SPME-GC-MS experiments.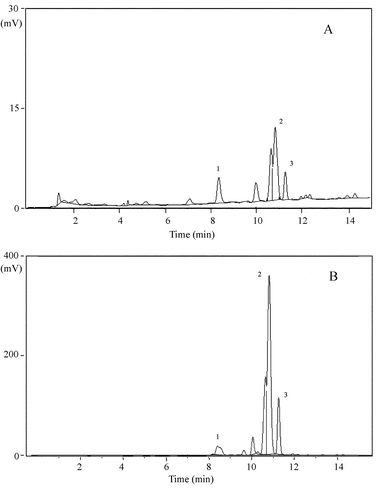 | ||
| Fig. 5 Chromatograms for the identifications: (A) a typical chromatogram of BVOCs emitted by intact leaves; (B) a typical chromatogram of BVOCs emitted by cut leaves. | ||
3.11 Circadian profiles for compounds emitted by intact Eucalytus dunnii leaves
Five primary factors that influence biogenic emission include vegetation type and density, solar radiation, cloud cover, and ambient temperature.5 As Fig. 6 illustrates, α-pinene, eucalyptol, and γ-terpinene emissions from the leaves of Eucalytus dunnii fluctuated as the sampling day progressed. The sampling device was set at the bottom of the canopy and was exposed to the sun from two directions (eastern in the morning and western in the afternoon) during the sampling day at 12:00 am and 5:00 pm, respectively. At these times, the sampling device had the most intensive solar radiation flux and exhibited the highest temperatures. Both temperature and light are known to influence biogenic emission instantaneously.1 Correspondingly, it can be observed that there were two emission peaks during the sampling day at 12:00 am and 5:00 pm ( Fig. 6). The emission peaks decreased as the temperature in the greenhouse decreased. That the concentration of eucalyptol emitted was larger than that of α-pinene and γ-terpinene might be due to the fact that eucalyptol is the main emission of this kind of tree. Therefore, it is suggested that the circadian variations observed in the target analyte emission profiles are a result of the variations of temperature and illumination conditions during the sampling day.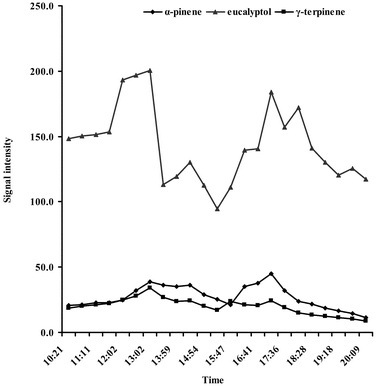 | ||
| Fig. 6 Circadian profiles of BVOCs emitted by intact Eucalytus dunnii leaves. | ||
3.12 Circadian profiles for compounds emitted by damaged Eucalytus dunnii leaves
It was well known that monoterpenes contained in resin ducts have constitutive or induced defensive functions.4 The release and synthesis of monoterpenes may be related to herbivore attack, insect damage and other biotic causes of wounding.45,46 In these research findings, leaves were damaged to simulate lesions resulting from the action of insects as illustrated in Fig. 7. It is still unclear what causes the rapid reduction in the emission of monoterpenes from wounded Eucalytus dunnii leaves, but may be explained by two hypotheses.47 First, a cover of induced monoterpenes may solidify when exposed to the open air, thereby sealing the wound. Second, the reduction in emission may reflect the period during which the monoterpene reservoirs (resin ducts ) within the plant are emptied. This time depends on the compound volatility and the internal pool size of the monoterpene emitted. α-pinene is the most volatile of the three target analytes, and it was observed that the emission of the α-pinene was rapidly reduced. At the end of the experiment (at 3:00 pm), the emission intensity of α-pinene was only 34% of the intensity of the initial signal (illustrated in Fig. 7A). While the emission of the less volatile and more abundant eucalyptol and γ-terpinene initially declined after the leaves were damaged, the emissions plateaued after approximately 3 h following cutting (at 12:00 am) (as shown in Fig. 7B and C).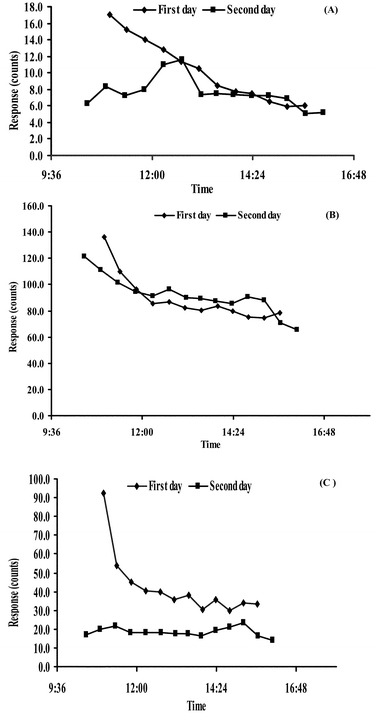 | ||
| Fig. 7 Circadian profiles of BVOCs emitted by damaged Eucalytus dunnii leaves in two days. (A) α-pinene, (B) eucalyptol, and (C) γ-terpinene, respectively. | ||
In the second day of the experiment, it is hypothesized that the wounded leaves might be repaired, resulting in a subsequent similarity in monoterpene emission profiles to those of healthy tissue. It was, however, observed that the ability of biogenic production and emission of monoterpene compounds was somewhat reduced in “Day 2 wounded” plants. That might be due to incomplete rehabilitation or other facts such as plant stress (produced by enclosure of the leaf inside the sampler), air composition, and/or foliar moisture (leaf wetting).1,2
Conclusions
The MESI-Portable GC system described in this article exhibits attractive characteristics for the continuous monitoring of biogenic volatile organic compounds. It can be operated in the field and allows reliable ecological studies to be undertaken on living plants under undisturbed field conditions. The collection of the kinetic data on BVOC emissions for extended periods of time (with limited supervision) becomes possible with simple software modifications. Such data would be helpful for physiological investigations. This system provides a promising approach for field monitoring of biogenic emissions because of its simplicity and convenience of deployment. The application of this system can be extended to study volatile emissions from animals, foods, and other plants.Acknowledgements
This work has been financially supported by the Natural Science and Engineering Research Council of Canada. The authors thank Tiemin Huang and Carolyn Goodridge for their encouraging remarks and helpful editorial comments.References
- J. Kesselmeier and M. Staudt, J. Atmos. Chem., 1999, 34, 23 CrossRef CAS.
- A. Z. Claudia, A. Fabio, C. Eva, P. S. Benjiamin, B. C. Elina and Pawliszyn, Anal. Chem., 2001, 73, 4729 CrossRef CAS.
- J. Gershenzon, J. Chem. Ecol., 1994, 20, 1281 Search PubMed.
- J. Gershenzon and R. Croteau, Terpenoids, Herbivores, Their Interactions with Secondary Metabolites, ed. G. A. Rosenthal and M. R. Berenbaum, Academic Press, New York, pp. 169–219 Search PubMed.
- M. Michelozzi, Acta Bot. Gallica, 1999, 146, 73 Search PubMed.
- P. W. Pare and J. H. Tumlinson, Plant Physiol., 1997, 114(4), 1161 CAS.
- P. W. Pare and J. H. Tumlinson, Plant Physiol., 1999, 121(2), 325 CrossRef CAS.
- F. Fehsenfeild, T. Calvert, R. Fall, P. Goldan, A. B. Guemther and C. N. Heuitt, Global Biogeochem. Cy., 1992, 6, 389 Search PubMed.
- W. Vizuete, V. Junquera, E. McDonald-Buller, G. McGaughey, G. Yarwood and D. Allen, Atomos. Environ., 2002, 36, 3421 Search PubMed.
- L. Tollesten and G. Bergstrom, Phytochemistry, 1988, 27, 4013 CrossRef.
- R. G. Buttery, C. Xu and L. C. Ling, J. Agric. Food Chem., 1985, 34, 115 CrossRef.
- T. R. Hamilton-Kemp, J. H. Loughrin and R. A. Anderson, Phytochemistry, 1990, 29, 2874 CrossRef.
- C. J. Sutton, S. J. Keegans, W. D. J. Kirk and E. D. Morgan, Phytochemistry, 1992, 31, 3427 CrossRef CAS.
- T. R. Hamilton-Kemp and R. A. Anderson, Phytochemistry, 1984, 23, 1176 CrossRef CAS.
- A. Hatanaka and T. Harada, Phytochemistry, 1973, 12, 2341 CrossRef CAS.
- G. R. Takeoka, R. A. Flath, M. Guntert and W. Jennings, J. Agric. Food. Chem., 1988, 36, 553 CrossRef.
- T. L. Potter and I. S. Fagerson, J. Agric. Food Chem., 1990, 38, 2054 CrossRef CAS.
- G. MacLeod and A. J. MacLeod, Phytochemistry, 1990, 29, 1183 CrossRef CAS.
- H. P. Hernandez, T. C.-Y. Hsieh, C. M. Smith and N. H. Fishcher, Phytochemistry, 1989, 28, 2959 CrossRef CAS.
- A. J. Cessna and L. A. Kerr, J. Chromatogr., 1993, 39, 185.
- M. F. Kok, F. M. Yong and G. Lim, J. Agric. Food Chem., 1987, 35, 779 CrossRef CAS.
- G. Antinescu, C. Doneanu and V. Radulescu, Flavour Frag. J., 1997, 12, 173 Search PubMed.
- B. D. Mookherjee, R. W. Trenkle and R. A. Wilson, Pure Appl. Chem., 1990, 62, 1357 CAS.
- L. Tollsten and G. Bergstrom, Phytochemistry, 1988, 27, 4013 CrossRef.
- K. Stransky and I. Valterova, Phytochemistry, 1999, 52, 1387 CrossRef CAS.
- M. F. Kok, F. M. Yong and G. Lim, J. Agric. Food Chem., 1987, 35, 779 CrossRef CAS.
- M. J. Yang, S. Harms, Y. Z. Luo and J. Pawliszyn, Anal. Chem., 1994, 66, 1349.
- M. Yang, M. Adams and J. Pawliszyn, Anal. Chem., 1996, 68, 2782 CrossRef CAS.
- Y. Z. Luo and J. Pawliszyn, Anal. Chem., 2000, 72, 1064 CrossRef CAS.
- A. Segal, T. Gorecki, P. Mussche, J. Lips and J. Pawliszyn, J. Chromatogr., A, 2000, 873, 13 CrossRef CAS.
- L. Wang, H. Lord, R. Morehead, F. Dorman and J. Pawliszyn, J. Agric. Food Chem., 2002, 50, 6281 CrossRef CAS.
- H. Lord, Y. Yu, A. Segal and J. Pawliszyn, Anal. Chem., 2002, 74, 5650 CrossRef CAS.
- J. Koziel, M. Y. Jia, A. Khaled, J. Noah and J. Pawliszyn, Anal. Chim. Acta, 1999, 400, 153 CrossRef CAS.
- J. Pawliszyn, in Comprehensive Analytical Chemistry, Vol. 37, Sampling and Sample Preparation for Field and Laboratory, ed. D. Barcelo and J. Pawliszyn, Elsevier, Amsterdem, 2002, pp. 253––278 Search PubMed.
- Y. Z. Luo and J. Pawliszyn, Anal. Chem., 2000, 72, 1058 CrossRef.
- Y. Z. Luo, M. Adams and J. Pawliszyn, Anal. Chem., 1998, 70, 248 CrossRef CAS.
- N. Vahdat, P. M. Swearengen, J. S. Johson, S. Priante, K. Mathews and A. Neidhardt, Am. Ind. Hyg. Assoc. J., 1995, 56, 32 CrossRef CAS.
- R. H. Brown and C. T. Purnell, J. Chromatogr., 1979, 178, 79 CrossRef CAS.
- J. Namiesnik, Talanta, 1988, 35(7), 567 CrossRef CAS.
- J. Pawliszyn, in Comprehensive Analytical Chemistry, Vol. 37, Sampling and Sample Preparation for Field and Laboratory, ed. D. Barcelo and J. Pawliszyn, Elsevier, Amsterdem, 2002, pp. 479––502 Search PubMed.
- M. H. Soni, J. H. Callahan and S. W. McElvany, Anal. Chem., 1998, 70, 3103 CrossRef CAS.
- Y. Z. Luo and J. Pawliszyn, Anal. Chem., 2000, 72, 1064 CrossRef CAS.
- W. R. Betz, S. G. Maroldo, G. D. Wachob and M. C. Pirth, Am. Ind. Hyg. Assoc. J., 1987, 50, 181 CrossRef.
- D. Zabaras and S. G. Wyllie, J. Sep. Sci., 2002, 25, 685 Search PubMed.
- M. E. Litvak and R. K Monson, Oecologia, 1998, 114, 531 CrossRef.
- P. W. Pare and J. H. Tumlinson, Phytochemistry, 1998, 47, 521 CrossRef CAS.
- F. Loreto, P. Nascetti, Graverini and M. Mannozzi, Funct. Ecol., 2000, 14, 589.
| This journal is © The Royal Society of Chemistry 2004 |

