Application of wavelet transforms and an approximate deconvolution method for the resolution of noisy overlapped peaks in DNA capillary electrophoresis
Virginia
Olazábal
a,
Lakshman
Prasad
b,
Peter
Stark
c and
José A.
Olivares
*a
aLos Alamos National Laboratory, Bioscience Division, P.O. Box 1663, Los Alamos, New Mexico 87545, USA
bLos Alamos National Laboratory, Nonproliferation and International Security, P.O. Box 1663, Los Alamos, New Mexico 87545, USA
cLos Alamos National Laboratory, Chemistry Division, P.O. Box 1663, Los Alamos, New Mexico 87545, USA
First published on 25th November 2003
Abstract
A new procedure for resolving noisy overlapped peaks in DNA separations by capillary electrophoresis (CE) is developed. The procedure combines both a wavelet-based denoising method that effectively denoises the signal and a novel approximate deconvolution technique that resolves the fragment peaks and improves the ability to separate highly overlapped peaks early in the electrophoresis process. Different kinds of overlapped peaks with and without noise simulated by computer as well as some DNA experimental electropherograms were submitted to the new procedure. A second order differential operator with variable coefficients is applied to the entire electrophoresis signal at any given time and approximate deconvolutions of the individual Gaussian peaks are performed. The operator incorporates the effect of the superposition and gives exact annihilation in the neighborhood of each peak. Overlapped peaks with a resolution higher than 0.46 can be resolved directly. Also, the method can determine the peak components of signals with a signal to noise ratio higher than 1.4
1 Introduction
Capillary electrophoresis has become the standard technique in DNA fragment sizing and sequencing due to its rapidity, sensitivity, and low cost. Recently, we demonstrated the use of an imaging system based on a liquid-core waveguide for full imaging of capillary electrophoresis processes for DNA and isoelectric focusing separations of proteins.1 This new method showed potential to optimize parameters that would lead to improved analysis. However, most instrumental systems have some limitations due to experimental signals with associated noise. The noisy signals can be induced by either imperfections in the optical and electronic components, interferences of chemical or physical processes, and/or other noise sources that add fluctuations to the pure signal. Moreover, the signals usually obtained by capillary electrophoresis show overlapped peaks if the data are acquired in the early stages of the DNA separation. Both noise and overlapped peaks complicate the data analysis and adversely affect the accuracy of the results. Subsequently, resolving or recovering noisy overlapping bands becomes a crucial problem.Different approaches have been taken to improve the analysis of data. The use of wavelet transforms (WT), a processing technique, to eliminate noise from the original spectra has received considerable attention in the last decade. It has been shown that WT are more efficient in denoising signals than traditional methods such as Fourier filtering (FT)2 and Savitzky-Golay smoothing (SG).3–5 Ehrentreich6 showed the advantage of wavelet transform over Fourier transform enabling principal new application fields. Alsberg et al.2 applied wavelet denoising to infrared spectra and showed that at high signal-to-noise ratio (SNR) the wavelet denoising methods are better than the standard Fourier filtering, and that these are also better in restoring the visual quality of the denoised infrared spectra. Perrin et al.5 demonstrated that when wavelets are applied to electropherograms in capillary electrophoresis a better denoising and peak shape preservation than traditional denoising methods (SG and FT) are obtained.
Furthermore, different mathematical methods such as Fourier self-deconvolution (FSD),7,8 curve fitting,9–11 principal component regression,12,13 and wavelet transforms14–17 have been applied to resolve overlapped bands existing in infrared spectra,6,9 and voltammetric8 and chromatographic11 signals.
Curve fitting is one of the most utilized techniques for the resolution of overlapped peaks, but reliable and accurate initial estimations of the number of peaks, their positions, shapes, and widths are necessary to find acceptable solutions.18–20 Also, the resolving ability is limited by noise level.21 One of the main drawbacks is that as the number of overlapping peaks increases, either small errors in the data (e.g., noise or baseline distortions), or errors in the mathematical model can be magnified, leading to large errors in the parameters of the final model22,23 and to ambiguous fitting results.24
Fourier self-deconvolution (FSD) has proved useful in resolving overlapped bands but it is known that this method creates artifacts,25 and very good signal-to-noise ratio (SNR) is required since FSD is quite sensitive to noise.26
In our procedure, since the instrument noise characteristics are not known, an additive white noise with zero mean and an unknown probability distribution function is assumed. Also, the use of wavelet transforms (WT) to eliminate noise from the original spectra is applied. Accordingly, the wavelet shrinkage27 approach to denoising the signal is taken, as this method, which is nonparametric, is best adapted to dealing with noise profiles whose characteristics are unknown.
The deconvolution of a signal convolved with a Gaussian is equivalent to dividing the Fourier transform of the signal by the Fourier transform of the Gaussian, which is also a Gaussian. This is easy enough if the parameters of the Gaussian are known. In the case of the electrophoresis data, the peaks are Gaussians whose parameters are governed by the injection profile, the laser point spread function, and the diffusion parameters of the analyte. Thus the correct estimation of the lumped parameters for the individual analyte peaks is a far from straightforward task. In addition, the interference due to the overlapping of neighboring Gaussian peaks makes the estimation of the parameters of the individual peaks inaccurate. The main purpose of deconvolving the electrophoresis data is to obtain a better resolution of the overlapping Gaussians. With this in mind, we have developed an approximate deconvolution scheme that makes a pointwise estimation of the effective local parameters to reduce the peak spread and resolves the peaks satisfactorily. The approximate deconvolution is implemented as a second order differential operator with variable coefficients. The differential operator is a first order approximation of the annihilator of the Gaussian. That is to say, the operator which when applied to the Gaussian yields a dirac delta function. The coefficient values at each point are determined by the local values of the signal and its second derivative, ensuring perfect cancellation outside a finite neighborhood of the local peaks' maxima. The size of this neighborhood is twice the standard deviation of the Gaussian peak at that point.
In this work, computers generated simulated signals with and without noise were submitted to the denoising and deconvolution procedure and the ability of the method to resolve the overlapped peaks is discussed in detail. It is established that the wavelet-based denoising method described in this paper effectively denoises the signal and the proposed deconvolution technique resolves the fragment peaks and dramatically improves the early time resolution of DNA separation in the electrophoresis process.
2 Theory
The application of wavelet transform in different scientific fields has been widely spread28–32 and recently, the application of wavelet to analytical chemistry6,33 and to denoising and deconvolution has been reviewed.34,35 A detailed description of the wavelet and wavelet transform can be found in the above references28–35 and in different books written about the subject (see, http://www.wavelet.org/). Here we present a brief overview of these theories in order to support our work.2.1 Wavelet transforms
Wavelet transforms (WT) consist of the decomposition of a signal into basis functions ψa,b(t) that are shifted and scaled versions of the original (or mother) wavelet ψ(t).36,37 A general expression for the construction of the basis functions, ψa,b(t), through the mother wavelet, ψ(t), is shown in eqn. (1), where a is a scaling (dilation or contraction) parameter playing the role of frequency and b the position (translation) parameter.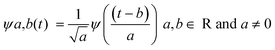 | (1) |
If f(t) is a signal, then the continuous wavelet transform (CWT) of the function f(t) is defined as
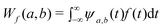 | (2) |
Therefore, the wavelet coefficients, Wf(a,b), are obtained as a function of the scale, a, and position, b. Because the CWT is invertible, the function f(t) can be reconstructed from ψa,b(t) using eqn. (3), where the function f(t) can be noted as a combination of the wavelet functions with the coefficients {Wf(a,b)} as:
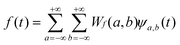 | (3) |
Usually, the signals to be analyzed are discrete, where scales and positions are chosen based on powers of two (called dyadic scales and positions). This method is known as the Discrete Wavelet Transform (DWT). A common used rapid algorithm for calculating discrete wavelet coefficients is the Mallat algorithm.38 In this case, at each scale, high (H) and low (L) filters are applied to the input signal. The output from the high-pass filter (H) at each scale is recorded as the wavelet coefficients and constitutes the details of the signal. The low-pass filter (L) extracts the low-frequency components or approximations for the next scale where another set of high- and low-pass filters is employed.
In this work we used the stationary wavelet transform (SWT), an implementation of the undecimated wavelet transform (UWT). It has been demonstrated that many of the artifacts created around the discontinuities, when DWT's are used, can be suppressed by using a SWT.39,40 The SWT, being shift-invariant, allows the restoration of the translation invariance lost when the discrete wavelet transform (DWT) is used. The algorithm used for its computation is the so called “a trous”.41,42
2.2 Denoising with wavelet transforms
The goal of denoising is to obtain an estimate of the signal and remove the noise components. The noise components are localized in the finer detailed levels of the transform. In these levels, the coefficients of the true signal have high amplitude, and the coefficients of the noise will have the lowest magnitude coefficients. Thus, removal of the noise can be accomplished by eliminating the coefficients that are smaller than a predetermined value or threshold. This is the basis of the wavelet shrinkage method developed by Donoho et al.27 There are extensive studies on thresholding the wavelet coefficients for signal denoising.43–45The procedure using wavelet shrinkage27,46 consists of (1) obtaining an orthogonal wavelet transform of the signal to be denoised, (2) applying a nonlinear shrinkage (i.e., reduction in magnitude) of the resulting wavelet coefficients, and (3) reconstruct the denoised signal via the inverse wavelet transform that contains the processed wavelet coefficients.
We realized the noise removal by using the nonlinear shrinkages, soft thresholding.43 In this case, the values below a threshold value were set to zero and all values above were reduced by the value of the threshold, t. Of the different statistical methods that have been developed to determine the threshold value,47 (VisuShrink universal,48 Minimax,49 Stein's Unbiased Risk Estimate (SURE)50 and, Minimum Description Length (MDL)51,52) the VisuShrink thresholding scheme by Donoho and Johnstone.48 was applied.
2.3 Deconvolution of the signal
We adopt an operator-based approach to signal deconvolution as this is best suited for estimating effective unknown parameters at the time of deconvolution without prior knowledge or estimation of actual parameters governing the process that generated the signal. This approach can be thought of as a reverse-engineering technique based on expectations of the deconvolved signal.If a signal g is the convolution of a known kernel, K, and the original signal, f, which we want to obtain. The signal can be written in the following form where ⊗ denotes convolution:
| g = K ⊗ f | (4) |
The deconvolution of a signal that is convolved with a known kernel K can be seen as applying a differential operator Dk that is the annihilator of K. That is,
| Dk(K) = δ | (5) |
| Dk(g) = Dk(K ⊗ f) = Dk(K) ⊗ f = δ ⊗ f = f | (6) |
 | (7) |
The successive numerical differentiation of noisy signals amplifies the noise. Also, the numerical implementation of a high order polynomial differential operator can be computationally expensive. We therefore seek to obtain noise-free, efficient, albeit approximate deconvolutions of Gaussian convolved signals by using a second order differential operator with a variable coefficient:
| 1 − k2d2/dx2 | (8) |
If y(x) is a Gaussian, then setting
 | (9) |
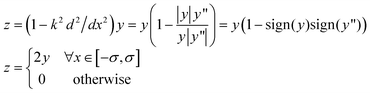
Indeed, the second derivative of the Gaussian has the same sign as the Gaussian everywhere except in the interval [−σ,σ], where σ is the standard deviation of the Gaussian (with zero mean). Thus, the second order differential operator annihilates the Gaussian everywhere except in the interval [−σ,σ], where the value of the resulting function is 2y. The effect of this operator is to narrow the effective support of a Gaussian by half while doubling the height of the Gaussian in the interval. This resulting function z can be viewed as an approximate Dirac distribution:
 | (10) |
In general we expect the deconvolved signal to be a train of dirac deltas or very narrow square waves. We also assume that the signal is essentially a train of Gaussian peaks due to the effect of a very narrow Gaussian or square wave injection profile of DNA sample, a concentration profile that undergoes a diffusion process that is Gaussian, and a beam that is used to image the fragments that is also Gaussian. Thus, our kernels are Gaussians whose parameters are unknown. The above described approximate deconvolution scheme then makes a pointwise estimation of the effective local parameters to reduce the peak spreads and resolve the peaks satisfactorily. Each deconvolved peak will have a width of two standard deviations of the corresponding Gaussian, and serves as an approximate square wave representing the injection profile. These deconvolved peaks, being narrower than the Gaussians convolving them, provide satisfactory resolution of the early time electrophoresis data.
3 Experimental
3.1 Reagents
DNA fragment analysis via capillary electrophoresis was realized using a mixture containing 0.5% (w/v) poly(vinylpyrrolidone)(PVP, 1 000 000 Mr, Polyscience, Warrington, PA) and 0.9% (w/v) hydroxypropylmethyl cellulose (HPMC, Sigma Chemical, St. Louis, MO) and 2 × Tris–boric acid–EDTA (TBE, Fisher Scientific Fairlawn, NL) as a sieving matrix. Fluorescently labeled DNA samples were prepared by contacting a 100 base pair (bp) DNA ladder (Promega Corp. Madison, WI) with PicoGreen nucleic acid stain (Molecular Probes, Eugene, OR). The PicoGreen DNA stain is specific for double-stranded DNA and exhibits fluorescence excitation and emission maximums at 480 and 520 nm. The Promega ladder consists of 11 fragments ranging in size from 100 to 1000 base pairs in 100 bp increments, with an additional fragment at 1500 base pairs. The 500 bp fragment is present at approximately three times the concentration of the other fragments.The separation was carried out using 1.5 kV electrokinetic injection for 12 s and run at 1.25 kV.
3.2 Equipment
The instrumental setup has been previously described.1 Briefly, the system utilizes a Teflon AF-coated capillary as a liquid-core waveguide, (LCW), providing an efficient window for the excitation of samples and the collection of light through total internal reflectance. A fiber optic coupled argon ion laser (Model Reliant 50S, Laser Physics, Salt Lake City, UT), 488 nm emission line, was coupled to a 15 mm focal length lens and focused to 50 μm spot. A 400 µm core diameter fiber optic (Model FVP400440480UVM, Polymicro Technologies) was inserted directly opposite the Teflon AF-coated capillary. The fiber optic and lens were mounted on a stepper motor XY translational table (Model MD-2, Arrick Robotics, Hurst, TX). A LabView program (National Instruments, Austin, TX) controls the XY table and acquires the photomultiplier output data from a 12 bit ADC board (Model PCI-MIO-16E-4, National Instruments, Austin, TX). The XY table allowed the positioning of the fiber optically coupled laser along the entire length of the Teflon AF-coated capillary.3.3 Experimental signals
A LabView program acquired the electropherogram from the photomultiplier signal and the laser position. The DNA fragments were excited using a 488 nm emission fiber optic coupled argon ion laser. Our system collects an electropherogram using a moving excitation source that can be used to collect an electropherogram of all of the analyte peaks within the separation channel at any one time. The number of data points was set to 512 since the signal length had to be a power of two, 2t, being t = 9.3.4 Data simulation
In order to illustrate the performance of the proposed method for resolving overlapped peaks, different signals were synthesized using the Gaussian equation: | (11) |
Four sets of experiments were designed to test the effect of the different parameters on the method performance.
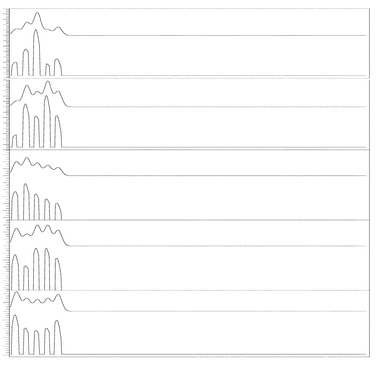
Data Set 1. The first simulated signals were generated using m = 5, and fixed μ0 and h0. The value of μ0 and h0 was the same for the different Gaussians, μ0 = 10, 25, 40, 55, and 70, and h0 = 2 respectively, and σ was varied. In this case, the effect of the resolution was tested (Fig. 1), and no noise was added to the simulated signal. The resolution between two sample bands, R, was determined from the peak separation and their full width at half-maximum, σ1/2.53
 | (12) |
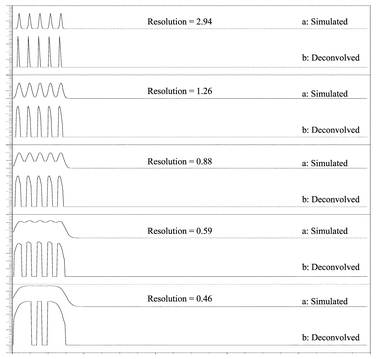 | ||
| Fig. 1 Simulated and deconvolved signals obtained using different resolutions. Simulated signals were generated using m = 5, and μ0 = 10, 25, 40, 55, and 70 and y0 = 2. The value of μ0 and y0 was the same for the different Gaussians. | ||
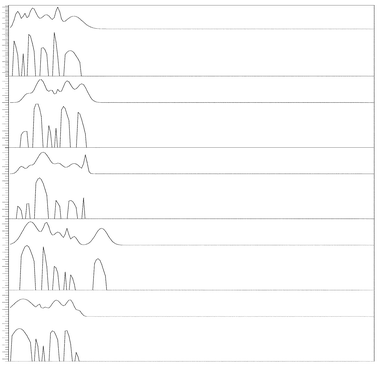
Data Set 2. Different signals were simulated using m = 5, fixed resolution, R = 0.74, and position, μ0 = 10, 25, 40, 55, and 70, and σ = 12, testing the effect of the height (Fig. 2). The peak heights, h0 were uniformly distributed random numbers in the interval of 2–10. The peak height was set to values where the ratio between peaks was lower than 1:5. In this case, no noise was added to the simulated signal.
 | ||
| Fig. 2 Simulated and deconvolved signals obtained using different heights, y0, in the simulation. The signals were simulated using m = 5, fixed resolution, R = 0.74, and position, μ0, 10, 25, 40, 55, and 70. The peak heights, y0 were uniformly distributed random numbers in the interval of 2–10 and were set to values where the ratio between peaks was lower than 1:5. | ||
Data Set 3. Different signals were simulated using m = 6. The peak parameters: peak width at half height, σ1/2, peak height, y0, and the peak position, μ0, were uniformly distributed random numbers in the interval, 2–14, 2–10, and 1–51 respectively. The peak height was set to values where the ratio between peaks was lower than 1:5. The resolution was maintained fixed to a value of 0.74, (Fig. 3).
 | ||
| Fig. 3 Simulated and deconvolved signals obtained using uniformly distributed random numbers in the interval of 2–14, 2–10, and 1–51 for the peak width at half height, peak height, and the peak position, respectively. The resolution was maintained fixed to a value of R = 0.74. | ||
Data Set 4. Same as set 3, but with random noise added. Random Noise was created using the following equation:
 | (13) |
Noisy signals were generated adding the random noise to the simulated signals. The noise was set to different Signal-to-Noise ratio, SNR. The SNR is used in many signal-detection disciplines (electronics, imaging, etc.) as a quantitative measure of the ability to resolve true signal from background noise. SNR is commonly calculated as
 | (14) |
To measure the performance of the denoising process the root mean square error, RMS defined as:
 | (15) |
3.5 Computation
The computations were performed using Matlab, version 6.5.0 for Windows, and our own written programs. The Matlab toolbox for wavelets was used for the library of wavelet filter coefficients.PeakFit, version 4.11,54 (Systat Software Inc., Richmond, CA) was used to analyze the denoised signals obtained after submitting the noisy simulated signals to wavelet denoising. PeakFit is a peak analysis package designed to separate and analyze multiple peaks or functional form data. It uses sophisticated non-linear curve fitting techniques to ensure accurate determination of peak parameters and to distinguish between overlapping peaks. The denoised data were fit using PeakFit's automated procedure based on residuals. The program provided initial estimates of peak location and number. Peak widths were allowed to vary independently during the fitting. A linear baseline, determined initially by the two points, was also fitted during the peak modeling. Fitting analysis was performed using a linear combination of Gaussian chromatographic functions and no smoothing.
3.6 Procedure of the method
The proposed method is comprised of two parts, a wavelet denoising and an approximate deconvolution method.In the experimental case, all the data vector lengths (number of data points) corresponding to the experimental electropherograms were converted into a dyadic length: 29 = 512. A stationary wavelet transform using Coiflet 255–58 and a level of decomposition 5 was applied to the noisy signal to obtain the wavelet coefficients.
In the absence of a priori knowledge of the noise model, we apply a uniform threshold of
 | (16) |
A soft thresholding was applied and the coefficients were reduced eliminating the noise component of the signal. The processed signal is reconstructed via the inverse wavelet transform to obtain the denoised signal.
Once the denoised signal is obtained, it is submitted to the approximated deconvolution process following the method explained in Section 2.3.
4 Results and discussion
4.1 Simulated data
Initially, several data sets were simulated using different parameter values to test the performance of the approximate deconvolution procedure in preserving peak positions. We want to point out that in Data Sets 1 to 3 noise has not been added and, therefore, in these cases we have not used the denoising process.In Fig. 1 different simulated signals corresponding to Data Set 1 are shown. In this case, the effect of different resolution between peaks on the deconvolution results has been evaluated. Resolution measurements are usually used to provide an evaluation of the performance of the capillary electrophoresis system and to evaluate how different parameters such as capillary length, electric field, temperature, etc… may affect performance.59 In this case, the resolution will determine the limits of applicability of the deconvolution procedure method.
Fig. 1a is the superposition (i.e., simple addition) of five Gaussians. The five Gaussians have means 10, 25, 40, 55 and 70 and may be thought of as the convolutions of a Gaussian with zero mean convolved with 5 injection samples at times 10, 25, 40, 55 and 70 where each injection sample is a dirac delta (i.e., a spike). When the deconvolution procedure is applied, approximations of the injection profiles at positions 10, 25, …70 are obtained, Fig. 1b. The recovered peaks are approximate dirac deltas, as the deconvolution operator is only a second order approximation to the actual annihilator of the Gaussian. It can be seen that the deconvolved peaks are at the original Gaussian peak positions when the resolution is 0.59 or greater, and the deconvolution method is able to resolve the overlapped peaks, Fig. 1b.
Previously, we calculated the lowest resolution for the liquid-core waveguide system as R = 1.34.1 Since the deconvolution method is able to resolve overlapped peaks with R > 0.46, we expect a successful determination of the components of noisy overlapped peaks on the experimental electropherograms when this method is applied.
If we had higher order approximations to the annihilator of the Gaussian, we would get even better localizations at these positions at low resolutions. This however, would require very high sampling rate of data to reduce numerical errors. Our method offers a reasonable practical and useful compromise in the face of limitations on data resolution and computational time to achieve fast early time deconvolution.
Fig. 2 shows the effect of the existence of different height peaks in the simulated signals on the deconvolution results. In this case, simulated signals with the same resolution, 0.74, and different heights were generated, Data Set 2, Fig. 2a, also, the peak height was set to values where the ratio between peaks was lower than 1:5. No significant influence of the height of the different peaks on the deconvolution performance has been observed when the ratio between consecutive peaks is less than 1:5. However, the method fails to determine the number of peak components at height ratios greater than of 1:5. This is in agreement with similar observations made by Zhang et al.60 They applied their method of curve fitting using wavelet transforms for resolving simulated overlapped spectra and they were not able to fit overlapped peaks with peak height ratios of 1:10:1.
In Fig. 3, several different simulated electropherograms (Data Set 3) were obtained when uniformly distributed random numbers were used to define the peak width at half height, peak height, and the peak position. The peak height was set to values where the ratio between peaks was lower than 1:5. In this case the number of components was increased to 6. It can be seen that the deconvolution method is able to resolve each of the different overlapped signals independently of the width, and height used in the simulation.
Once the performance of the approximate deconvolution procedure to resolve simulated signals without noise was tested, the ability of the denoising and the approximate procedure to solve simulated noisy overlapped signals was investigated, Data Set 4. In Fig. 4a, a simulated signal created using a resolution of 0.88, and uniformly distributed random numbers for h0, μ0, and σ1/2, is presented. In this case, white noise created using eqn. (13) was added to the simulated signal, Fig. 4b. The signal to noise ratio was set to 3.5. To illustrate the performance of our method, the reconstructed or denoised, and deconvolved signals are reported in Fig. 4c and Fig. 4d, respectively. The denoised and deconvolved signals were obtained using the procedures described in Section 3.6. Fig. 4 shows that the method satisfactory resolves the noisy overlapped peaks. The RMS value computed from the denoised signal using eqn. (15) was 0.0053. The error committed during reconstruction using Coiflet 2 level of decomposition 5 was very low. Different levels of signal-to-noise ratio, SNR, were tested, as shown in Fig. 5. As one can observe, the denoising process allows the removal of the noise getting an RMS of 0.0075; 0.011; 0.018 and 0.023 for the signal with a SNR equal 34.7; 2.3; 1.7, and 1.4 respectively. As the SNR decreases to 1.4, the approximate deconvolution method failed to obtain the number of components in the original signal.
 | ||
| Fig. 4 Simulated signal, as in Fig. 3, Simulated + Noise, Denoised and Deconvolved signals. The resolution used to construct the simulated signal was fixed to a value of R = 0.74. | ||
 | ||
| Fig. 5 Simulated signal + Noise with different values of SNR at 34.7, 2.3, 1.7, and 1.4. Other parameters as in Fig. 3. Denoised signals were obtained using Coiflet 2, level of decomposition 5. | ||
The effectiveness of the approximate deconvolution method was compared with the resolution of a commercial software package, PeakFit. PeakFit has been widely used in different fields of science to determine the components of a signal and the area and amplitudes of the different peaks integrating the signal.61,62Fig. 6 displays the results obtained after applying the PeakFit algorithm to the same denoised signals used in our approximate deconvolution method. Only when the SNR > 2.3, the software is able to identify all the individual peaks in the signal.
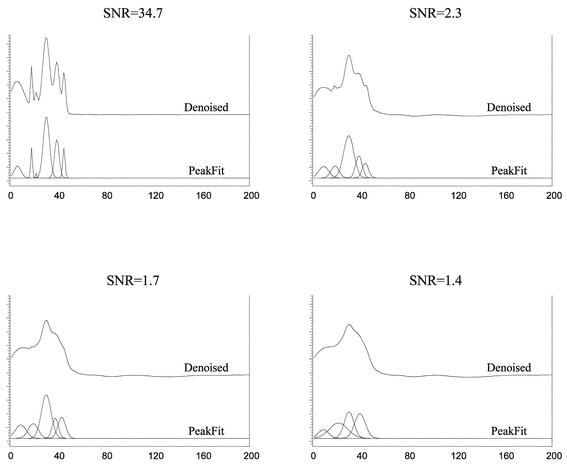 | ||
| Fig. 6 Denoised signals used in Fig. 5, deconvolved using PeakFit software. | ||
4.2 Experimental data
In Fig. 7, a DNA fragment ladder is separated and the electropherogram recorded at various times during the electrophoresis run. The peaks are due to DNA fragments with sizes of 100, 200, 300, 400, 500, 600, 700, 800, 900, 1000, and 1500 bp. The smaller the DNA fragment size the greater its mobility and the further it travels in anyone time frame. A small peak that appears before the 100 bp fragment is of unknown origin possibly associated with an impurity in the sample. The largest peak corresponds to the 500 bp fragment.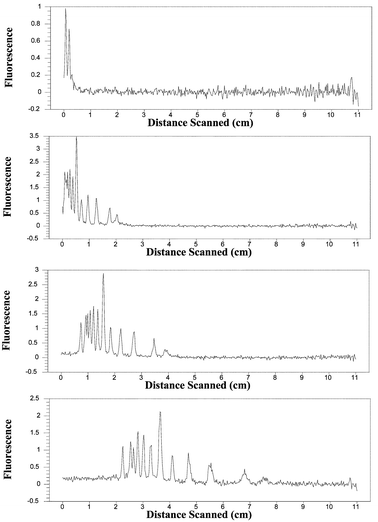 | ||
| Fig. 7 Experimental DNA electropherograms obtained for separations running at different times. From the top to the bottom: (a) some time after 0 s; (b) 180 s, (c) 360 s and (d) 720 s. | ||
In traditional electropherograms, obtained with a fixed detector, the signal amplitude is plotted as the y-axis against time as the x-axis. Our system collects an electropherogram using a moving excitation source; therefore it can be used to collect an electropherogram of all of the analyte peaks within the separation channel at any one time. Thus, the analyte signal amplitude is plotted as a function of position in the capillary.
In all the scans, a considerable quantity of noise is evident. The noise is possibly induced by mainly two factors: the stepper motors of the scanning table used to position the fiber optically coupled laser along the entire length of the capillary and the low integration time per step employed in the data collection. Also, in the early stages of the separation highly overlapped peaks are observed.
Since the instrument noise characteristics are not known, an additive white noise with zero mean and an unknown probability distribution function was assumed in the denoising procedure. Accordingly, the wavelet shrinkage approach, which is nonparametric, is applied to denoising the signal, as this method is best adapted to dealing with noise profiles with unknown characteristics. The main idea behind the wavelet shrinkage method for denoising is that wavelet transforms are good at compressing signal information into a few large coefficients across various scales. On the other hand, white noise, no matter what the model, is represented by small wavelet coefficients present at all locations and at all scales. That is to say, noise compresses poorly while signals compress very well under a wavelet transform.
In Fig. 8, the reconstructed signal for the scan at 180 s obtained after submitting the original signal to the denoising process is shown. All the filtered signals were obtained by using the same level of decomposition. Similar results have been obtained when processing signals corresponding to scans obtained at other times.
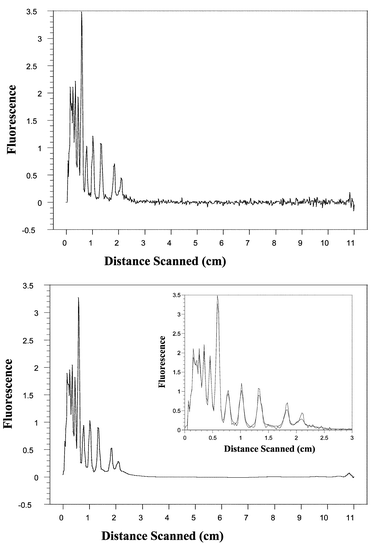 | ||
| Fig. 8 Top: Electropherogram obtained for separation running at 180 s. Bottom: (The inset is the superposition of the original signal and denoised signal). Denoised signal using Coiflet 2. | ||
We have observed that the use of a maximally symmetric orthogonal wavelet, such as the Coiflet 2, to perform the transform gives very good noise removal while maintaining the characteristics of the original signal. This is because adapting the wavelet to share known signal characteristics such as smoothness, symmetry, etc., enhances the contrasting behavior of signal versus noise in the wavelet transform domain.
In this case, we assumed that the injection profile of the DNA sample would be a very narrow Gaussian or square wave. As the fragments separate over time, their concentration profile undergoes a diffusion process that is Gaussian. In addition, the point spread of the laser beam that is used to image the fragments is also Gaussian. Since the convolution of Gaussians is a Gaussian, the analyte appears as a train of overlapped Gaussian peaks traversing the length of the capillary. Therefore, a wavelet that shares the properties of smoothness and (near) symmetry characteristics of Gaussians will perform the best.
Moreover, the reconstructed signal doesn't create artifacts. That is mainly due to (a) the success of the translation-invariant denoising method and (b) a good selection of the wavelet shape. The Coiflet wavelet is a good choice because it has 2N vanishing moments and, consequently, it can be used to represent Gaussian or quadratic functions providing near null details. Also, it has vanishing moments not only in the wavelet function but also in the scaling function implying that this wavelet provides a very good approximation of the polynomial function at different resolution. However, other wavelet families such as Haar or Daubechies will fail to suppress the polynomial signal because their vanishing moments are N.
Furthermore, the denoised peaks show the same width and shape as the original signal but a slight decrease in the intensity of the peaks is observed due to the subtraction of the noise contribution.
The results of the signal deconvolution using the process described in Section 2.3 are displayed in the Fig. 9. The approximately deconvolved signal exhibits well-resolved peaks corresponding to each of the expected DNA fragments. The peaks in the approximately deconvolved signal are twice the height and half the width of the original peaks. This is because the deconvolution operator effectively doubles the values of a Gaussian in the interval [−σ,σ], where σ is the standard deviation of the Gaussian, while canceling the values outside this interval. Thus the operator preserves the area under the peaks. This is equivalent to saying that this would be the true height of the peaks if there was no diffusion. The interference of the Gaussian peaks with one another shifts the peaks in the experimental signal in different directions. Upon deconvolution these shifts are lessened, and as expected the deconvolved peaks are slightly shifted back. This is equivalent to saying that, to some extent, the deconvolution restores true peak positions.
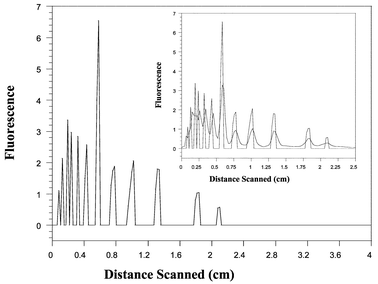 | ||
| Fig. 9 Approximately deconvolved electropherogram for the separation obtained at 180 s. Inset: Superposition of denoised signal and deconvolved signal. | ||
5 Conclusions
A new method was developed through which the removal of noise and deconvolution of overlapped peaks for capillary electrophoresis is obtained. The performance of the method is limited by the resolution of the signal. Also, it has been shown that this method has a better performance than the commercial software PeakFit for signals with significant quantity of noise. This new method has been used to resolve experimental electropherograms determining DNA fragment peaks and improving the ability to separate highly overlapped peaks early in the electrophoresis process. This new method for denoising and deconvolution can also be applied to noisy overlapped peaks in different analytical techniques such as spectrometry, and chromatography.Acknowledgements
The authors want to acknowledge the financial support received from the Laboratory Directed Research and Development program. Los Alamos National Laboratory is operated by the University of California for the US Department of Energy under contract no. W-7406-ENG-36.References
- José A. Olivares, P. C. Stark and P. Jackson, Anal. Chem., 2002, 74, 2008–2013 CrossRef CAS.
- B. K. Alsberg, A. M. Woodward, M. K. Winson, J. Rowland and D. B. Kell, Analyst, 1997, 122, 645–652 RSC.
- V. J. Barclay, R. F. Bonner and I. P. Halmilton, Anal. Chem., 1997, 69, 78–90 CrossRef CAS.
- C. R. Mittermayr, S. G. Nikolov, H. Hunter and M. Grasserbauer, Chemom. Intell. Lab. Syst., 1996, 34, 187–202 CrossRef CAS.
- C. Perrin, B. Walczak and D. L. Massart, Anal. Chem., 2001, 73, 4903–4917 CrossRef CAS.
- F. Ehrentreich, Anal. Bioanal. Chem., 2002, 372, 115–121 CrossRef CAS.
- J. K. Kauppinen, D. J. Moffatt, H. H. Mantsch and D. G. Cameron, Appl. Spectrosc., 1981, 35, 271–276 CAS.
- W. J. Yang, P. R. Griffiths, D. M. Byler and H. Susi, Appl. Spectrosc., 1985, 39, 282–287 CAS.
- X. Q. Zhang, J. B. Zheng and H. Gao, Analyst, 2000, 125, 915–919 RSC.
- W. Huang, T. L. E. Henderson, A. M. Bond and K. B. Oldham, Anal. Chim. Acta, 1995, 304, 1–15 CrossRef.
- P. C. Painter, S. M. Rimmer, R. W. Synder and A. Davis, Appl. Spectrosc., 1981, 35, 102–106 CAS.
- K. Y. Chang, C. W. Brown and R. K. Force, Appl. Spectrosc., 1993, 47, 1801–1807 CAS.
- J. F. Faigle, R. J. Poppi, I. S. Scarminio and R. E. Bruns, J. Chromatogr., 1991, 539, 123–132 CrossRef CAS.
- Y. Zhang, J. Mo, T. Xie, P. Cai and X. Zou, Anal. Chim. Acta, 2001, 437, 151–156 CrossRef CAS.
- X. G. Shao, W. S. Cai, P. Y. Sun, M. S. Zhang and G. W. Zhao, Anal. Chem., 1997, 69, 1722–1725 CrossRef CAS.
- X. G. Shao, H. Gu, J. H. Wu and Y. Y. Shi, Appl. Spectrosc., 2000, 54, 731–738 CrossRef CAS.
- X. G. Shao, W. S. Cai and P. Y. Sun, Chemom. Intell. Lab. Syst., 1998, 43, 147–155 CrossRef CAS.
- A. H. Anderson, T. C. Gibb and A. B. Littlewood, J. Chromatogr. Sci., 1970, 11, 640–646 Search PubMed.
- J. A. Pierce, R. S. Jackson, K. W. Van Every, P. R. Griffith and G. Hongjin, Anal. Chem., 1990, 62, 477–484 CrossRef CAS.
- W. F. Maddams, Appl. Spectrosc., 1980, 34, 245–267 CAS.
- P. Gans and J. B. Gill, Anal. Chem., 1980, 52, 351–352 CrossRef CAS.
- B. G. M. Vandeginste and L. De Galan, Anal. Chem., 1975, 47, 2124–2132 CrossRef CAS.
- J. R. Beacham and K. L. Andrew, J. Opt. Soc. Am., 1971, 61, 231–235 Search PubMed.
- A. H. Anderson, T. C. Gibb and A. B. Littlewood, Anal. Chem., 1970, 42, 434–440 CrossRef CAS.
- L. Smeller, K. Goossens and K. Heremans, Appl. Spectrosc., 1995, 49, 1538–1542 CAS.
- J. K. Kauppinen, D. J. Moffatt, D. G. Cameron and H. H. Mantsch, Appl. Opt., 1981, 20, 1866–1879.
- D. L. Donoho, I. M. Johnstone, G. Kerkyacharian and D. Picard, J. R. Statist. Soc., B, 1995, 57, 301–337 Search PubMed.
- M. Unser and A. Aldroudi, Proc. IEEE, 1996, 84, 626–638 CrossRef.
- O. Rioul and M. Vetterli, IEEE Signal Proc., 1991, 8, 14–38 Search PubMed.
- F. Abramovich, T. C. Bailey and T. Sapatinas, J. R. Statist. Soc., D., 2000, 49, 1–29 Search PubMed.
- P. Kumar and E. FoufoulaGeorgiou, Rev. Geophysics, 1997, 35, 385–412 Search PubMed.
- M. Kobayashi, Nonlinear Anal. Theory Methods Applic., 2001, 47, 1749–1760 Search PubMed.
- X. G. Shao, A. K. M. Leung and F. T. Chau, Acc. Chem. Res., 2003, 36, 276–283 CrossRef CAS.
- A. K. Leung, F. Chau and J. Gao, Chemom. Intell. Lab. Syst., 1998, 43, 165–184 CrossRef CAS.
- J. L. Starck, E. Pantin and F. Murtagh, Astron. Soc. Pac., 2002, 114, 1051–1069 Search PubMed.
- I. Daubechies, in Ten Lectures on Wavelets, ed. CBMS, SIAM Press, Philadelphia, 1994, 61, pp. 117–280 Search PubMed.
- C. K. Chui, in An Introduction to Wavelets, Academic Press, New York, 1992, pp. 49 Search PubMed.
- S. Mallat, IEEE Trans. Pattern. Anal. Machine Intell., 1989, 11, 674–693 CrossRef.
- R. R. Coifman, and D. L. Donoho, in Wavelets and Statistics, ed. A. Antoniadis and G. Oppenheim, Springer-Verlag, Berlin, 1995, vol. 103, pp. 125–150 Search PubMed.
- J. L. Starck, F. Murtagh, and A. Bijaoui, Image Processing and Data Analysis. The Multiscale Approach, Cambridge University Press, 1998 Search PubMed.
- M. Holschneider, R. Kronland-Martinez, J. Morlet, and P. Tchamitchian, in Wavelet, Time-Frequency Methods and Phase Space, ed. J. M. Combes, A. Crossmann, and Ph. Tchamitchian, Springer-Verlag, Berlin, 1989, pp. 298–304 Search PubMed.
- O. Rioul and P. Duhamel, IEEE Trans. Inform. Theory, 1992, 38, 569–586 CrossRef.
- D. L. Donoho, IEEE Trans. Inform. Theory, 1995, 41, 613–627 CrossRef.
- M. Jansen, Lecture Notes in Statistics, Springer-Verlag, 2001, vol. 161, p. 191 Search PubMed.
- I. K. Fodor and C. Kamath, J. Electron. Imag., 2003, 12, 151–160 Search PubMed.
- C. Taswell, IEEE Comp. Sci. Eng., 2000, 2, 12–19 Search PubMed.
- I. M. Johnstone and B. W. Silverman, J. R.. Statist. Soc., B, 1997, 59, 319–351 Search PubMed.
- D. L. Donoho and I. M. Johnstone, Biometrika, 1994, 81, 425–455 Search PubMed.
- D. L. Donoho and I. M. Johnstone, Ann. Statist., 1998, 26, 879–921 Search PubMed.
- C. M. Stein, Ann. Statist., 1981, 9, 1135–1151 Search PubMed.
- H. Krim and I. C. Schick, IEEE Trans. Inform. Theory, 1999, 45, 898–908 CrossRef.
- M. Hansen, and B. Yu, Model Selection and the Principle of Minimum Description Length, http://cm.bell-labs.com/cm/ms/departments/sia/doc/meth.html, http://cm.bell-labs.com/who/cocteau/papers/pdf/mdl.pdf Search PubMed.
- J. A. Luckey, T. B. Norris and L. M. Smith, J. Phys. Chem., 1993, 97, 3067–3075 CrossRef CAS.
- PeakFit software: http://www.systat.com/products/PeakFit.
- I. Daubechies, SIAM J. Math. Anal., 1993, 24, 499–519 Search PubMed.
- A. Antoniadis, Scand. J. Statist., 1996, 23, 313–330.
- J. Tian and R. O. Wells, Jr, Computational Math. Lab., Rice University, Houston, TX, Technical Report, 1995. CML TR95–01 Search PubMed.
- W. Dong and A. C. Bovik, IEEE Trans. Circuits Syst. II: Anal. Dig. Signal Proc., 1998, 45, 988–1001 Search PubMed.
- M. A. Quesada and S. Menchen, in Capillary Electrophoresis of Nucleic Acids, Vol. 1, Methods in Molecular Biology Series, vol. 162, ed. K. R. Mitchelson and J. Cheng, Humana Press, Totowa, NJ, 2001, pp. 154–166 Search PubMed.
- X. Zhang, J. Zheng and H. Gao, Anal. Chim. Acta, 2001, 443, 117–125 CrossRef CAS.
- S. M. Clark, J. Appl. Cryst., 1995, 28, 646–649 CrossRef CAS.
- M. Elsabee and R. J. Prankerd, Int. J. Pharm., 1992, 86, 211–219 CrossRef CAS.
| This journal is © The Royal Society of Chemistry 2004 |