Application of a contactless conductivity detector to the determination of inorganic ions in ion chromatography
Pavel
Kubáň
,
Marcel A.
Müri
and
Peter C.
Hauser
*
Department of Chemistry, University of Basel, Spitalstrasse 51, 4004 Basel, Switzerland
First published on 2nd December 2003
Abstract
The contactless conductivity detector was connected to ion chromatographs operating in both, the non-suppressed and suppressed modes and the analytical parameters of the contactless and the conventional commercial contact detectors were compared by using solutions of standards. The performance of the contactless detector in terms of reproducibility, linearity of calibration curve and detection limit was found to be largely identical to the commercial detectors in both systems. The usefulness of the new detector was further demonstrated with some real samples (tap, mineral and rain water). The contactless conductivity detector, which does not show electrode fouling and is simple in design and inexpensive, was thus found to be a suitable substitute for conventional detectors in ion chromatography.
Introduction
Capacitively coupled contactless conductivity detection (CCD) in its present form was introduced to capillary electrophoresis (CE) independently by two research groups in 1998.1,2 It has since been adopted by several other groups and gained wide popularity.3–11 The design of the CCD remains virtually the same as in the original publications1,2 and has only seen some slight modifications of the arrangement of the detection cell and/or electronic circuitry. In general, the CCD consists of two tubular electrodes of about 5 mm length placed directly, side by side, on the separation capillary with a gap of about 1 mm. An ac voltage of typically 200 kHz is applied to one of the electrodes (actuator) and after passing the detection gap between the electrodes, the signal is picked up on the second electrode (pick-up). Each electrode forms a capacitor with the solution inside the capillary and by using suitable amplifier electronics, conductivity changes of the solution in the detection gap between the electrodes can be monitored. The configuration of the CCD is advantageous as the electrodes are not in contact with the solution in the capillary and this prevents possible contamination from the solution. Furthermore, the fabrication of the CCD detector cell is greatly simplified compared with conventional conductivity detectors, which rely on a galvanic contact with the solution and require precisely machined cells.The scope of the detection method has steadily expanded since its introduction. Chvojka et al.4 presented a dual photometric and CCD detector and Vuorinen et al.12 incorporated the CCD into a commercial capillary cassette and also used it for simultaneous ultraviolet (UV) and conductivity detection. Macka et al.13 designed a movable miniaturized CCD cell, which can also be inserted into a commercial instrument and freely moved along the capillary length and was used for the simultaneous determination of inorganic anions and cations. Kappes et al.14 incorporated the CCD into a portable CE instrument for measurements in the field. Kubáň et al. demonstrated the coupling of the CCD to a flow injection–capillary electrophoresis (FI-CE) system for the repeated determination of inorganic anions15,16 and subsequently extended the FI system to the double opposite end injection for the simultaneous determination of anions and cations.17 Tanyanyiwa et al. showed that the sensitivity of the CCD is increased by operating the cell at excitation voltages of up to several hundred volts.8,18,19
The CCD has originally been developed for detection in capillary zone electrophoresis (CZE) and the conductivity difference between the background electrolytes and the analytes has favoured its application to the determination of small inorganic and organic ions.1–3,8–10 However, the detection method has not been restricted solely to this mode. Fracassi da Silva and do Lago20 extended contactless conductivity detection to the determination of non-ionic species in micellar electrokinetic chromatography and Muzikár et al.6 used non-aqueous solvents in the determination of organic ions. Hilder et al.7 employed the detector in anion exchange capillary electrochromatography.
Pungor and coworkers in 1988 described the application of a contactless oscillometric detector in conventional ion chromatography (IC) and reported improved stability compared to a detector with galvanic contact.21 The cell design was very different to the present arrangement, as was the circuitry operating at a much higher frequency of 42 MHz, but this clearly indicates that the new detector should also be useful for ion chromatography. Zemann and coworkers have indeed presented an encouraging preliminary result obtained with their contactless (CE-) detector for the chromatographic separation of some anions.22 As some of the advantages of the contactless detector should also have bearing on ion chromatography, such as ease of construction and inherent absence of electrode fouling, a further investigation was considered worthwhile.
Experimental
Apparatus
Eluent used for the non-suppressed IC determination of cations was prepared from tartaric acid (Merck, Darmstadt, Germany) and pyridine-2,6-dicarboxylic acid (Fluka, Buchs, Switzerland). For the non-suppressed IC determination of anions, eluent containing phthalic acid (Merck, Darmstadt, Germany) and Tris(hydroxymethyl)aminomethane, (Tris) (Fluka, Buchs, Switzerland) was employed. Eluent used for the suppressed IC determination of anions was prepared automatically using an EG40 eluent generator module (Dionex). Real water samples were used without any pretreatment or were diluted with deionized water prior to analysis.
Results and discussion
Non-suppressed conductivity ion chromatography
First an optimization of the operating parameters of the contactless conductivity detector was carried out. The detector had been designed for capillary electrophoresis and is therefore fitted with capillaries of an outer diameter of 375 µm. The influence of the internal diameter of the capillary on the signal intensity is illustrated in Fig. 1. It is obvious that the capillary with widest id (150 µm, trace a) gives the strongest signal while the capillary with narrowest id (75 µm, trace c) gives the weakest signal. An evaluation of the effect of excitation voltage and frequency, the other two variable parameters, showed that the best signal to noise ratio was obtained for a frequency of 150 kHz and a voltage of 50 Vp-p using the capillary with 150 µm internal diameter.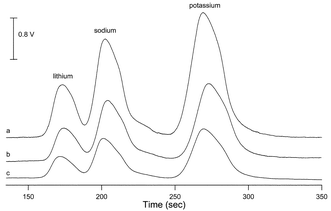 | ||
| Fig. 1 Influence of the internal diameter of the capillary in the detector cell on the sensitivity for the determination of three cations. (a) 150 µm id, (b) 100 µm id, (c) 75 µm id. 150 kHz and 100 Vp–p. Eluent: 1 mM tartaric acid, 0.185 mM pyridine-2,6-dicarboxylic acid, flow rate = 1.0 mL min−1. Cation concentrations: lithium 0.2 mg L−1, sodium 1 mg L−1 and potassium 3 mg L−1. | ||
The CCD was then directly compared using these conditions with the built-in contact conductivity detector, which is part of the commercial IC-system by arranging the two detectors in series. Resulting chromatograms of the analysis of a standard solution of cations obtained by the two detectors are depicted in Fig. 2A. Except for the variation in scale, which is caused by different intrinsic gain factors of the two systems, no differences are discernable from the two traces. Note, that the peak widths at half maximum are virtually identical for both detectors which indicates that the insertion of the contactless detector in front of the commercial detector does not introduce measurable dispersion. The results of a more detailed quantitative comparison are given in Table 1. The linearity of both detection systems was tested using a 4-point calibration of the three inorganic cations in the range from 0.02 to 0.2 mg L−1 for Li+, 0.1 to 1 mg L−1 for Na+ and 0.3 to 3 mg L−1 for K+. As can be seen, the relative standard deviations for the peak areas and peak heights, as well as the correlation coefficients for linear fits of calibration curves were found to be very good and very similar for both systems. Tap and mineral water, as examples of real samples, were also analysed on the system after a tenfold dilution with deionized water. The resulting chromatograms for tap water obtained with the two detectors in series are depicted in Fig. 2B, and further illustrate the use of the new detector.
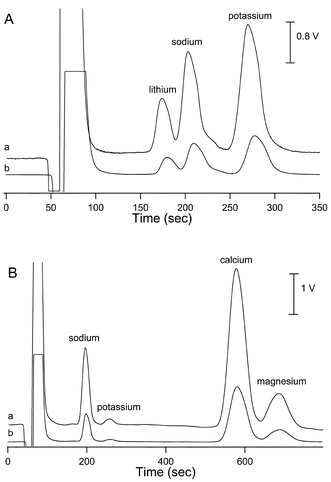 | ||
| Fig. 2 (A) Determination of three inorganic cations in the non-suppressed conductivity mode: (a) CCD (150 kHz and 50 Vp–p), (b) commercial conductivity detector. Cation concentrations and IC conditions are the same as in Fig. 1. (B) Determination of inorganic cations in tap water (diluted 1:10) in the non-suppressed conductivity mode: (a) CCD (150 kHz and 50 Vp–p), (b) commercial conductivity detector. IC conditions are the same as in Fig. 1. | ||
| Lithium | Sodium | Potassium | Fluoride | Chloride | Nitrate | |
|---|---|---|---|---|---|---|
| a Conditions as for Figs. 2 and 3. b RSD (P.A.) = relative standard deviation for peak area (n = 8). c RSD (P.H.) = relative standard deviation for peak height (n = 8). d r 2 (P.A.) = correlation coefficients for the calibration curves based on peak areas. e r 2 (P.H.) = correlation coefficients for the calibration curves based on peak heights. f LOD = limit of detection, concentration giving a peak height equal to 3 × baseline noise. g The values in parenthesis were obtained for the maximum sensitivity setting. | ||||||
| Contactless conductivity detection | ||||||
| RSD (P.A.)b (%) | 1.28 | 0.87 | 1.02 | 1.77 | 1.01 | 0.93 |
| RSD (P.H.)c (%) | 0.59 | 0.56 | 0.54 | 1.30 | 1.36 | 1.59 |
| r 2 (P.A.)d | 1.0000 | 0.9998 | 1.0000 | 1.0000 | 0.9999 | 0.9998 |
| r 2 (P.H.)e | 0.9997 | 0.9999 | 0.9998 | 0.9998 | 0.9998 | 0.9999 |
| LODf/µg L−1 | 2.9 | 7.0 | 22.2 | 160 | 110 | 250 |
| Conventional conductivity detection | ||||||
| RSD (P.A.)b (%) | 1.15 | 0.83 | 1.09 | 1.27 | 1.01 | 1.20 |
| RSD-(P.H.)c (%) | 0.74 | 0.69 | 0.61 | 1.23 | 1.17 | 1.68 |
| r 2 (P.A.)c | 1.0000 | 0.9998 | 1.0000 | 1.0000 | 0.9998 | 0.9997 |
| r 2 (P.H.)e | 0.9997 | 0.9999 | 0.9998 | 0.9999 | 0.9999 | 0.9997 |
| LODfg/µg L−1 | 3.4 (0.4) | 7.2 (0.75) | 23.2 (2.3) | 150 (18) | 110 (10.5) | 260 (26) |
Also investigated was the determination of anions in the non-suppressed mode. The chromatograms resulting from a standard mixture are shown in Fig. 3A and those for tap water in Fig. 3B. The salient performance data is given also in Table 1, with the results being very similar to those obtained for the cations. The linearity of both detection systems was tested using a 4-point calibration of the three inorganic anions in the range from 1 to 10 mg L−1 for F− and Cl− and 2 to 20 mg L−1 for NO3−. Note that the lower limit of detection for the commercial detector, for anions and cations, was found to be affected by the gain setting on the instrument employed (the scale setting on the detector itself), a feature not available for the contactless detector. The results for the new detector indicates a performance in this regard which is slightly better than that of the commercial detector on the standard gain setting but worse when using the highest gain setting. This was due to the fact that the absolute noise level (as voltage) was constant for the different gain settings of the commercial detector which however of course affected the peak height. This indicates that the dominant noise source lies in the electronic circuitry rather then the cell itself. Note however, that the maximum gain setting on the commercial instrument can only be used in exceptional circumstances, i.e. for trace analysis and when all concentrations to be measured are very low, as it severely limits the dynamic range of the measurements. The distinct difference in detection limit obtained between cations and anions for both detectors must be a feature of the eluent systems employed leading to different sensitivities.
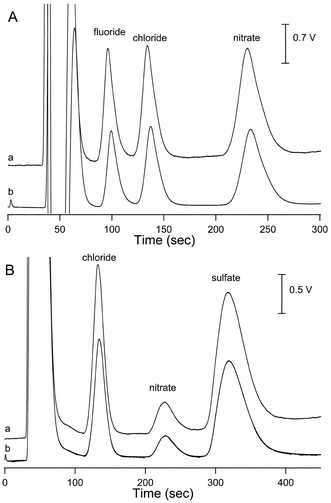 | ||
| Fig. 3 (A) Determination of three inorganic anions in the non-suppressed conductivity mode: (a) CCD (150 kHz and 50 Vp–p), (b) commercial conductivity detector. Eluent: 2.5 mM phthalic acid adjusted to pH 4.25 with Tris, flow rate = 1.5 mL min−1. Anion concentrations: fluoride, chloride 10 mg L−1 and nitrate 20 mg L−1. (B) Determination of inorganic anions in tap water in the non-suppressed conductivity mode: (a) CCD (150 kHz and 50 Vp–p), (b) commercial conductivity detector. IC conditions as in (A). | ||
Suppressed conductivity ion chromatography
In the next part of the experiment the CCD was connected to the chromatographic system operated in the suppressed conductivity detection mode. The CCD cell was connected to the IC system through the 150 µm id capillary only. When the capillaries with narrower id were used for connecting the CCD to the outlet of the suppressor the backpressure was increased significantly indicating a danger of rupturing the suppressor membrane. However, the choice of the 150 µm id capillary should not negatively affect the sensitivity of the CCD system since in the previous experiments the capillary with largest id gave the best results in terms of S/N ratio. Therefore, all the CCD optimization procedures described in this section were carried out using only the capillary with the id of 150 µm.The IC method for the determination of inorganic anions in the suppressed conductivity mode was as follows: a gradient method linearly increased the concentration of KOH from 2 mM (0 min) to 27 mM (in 12 min), to 30 mM (in 13 min), decreased to 2 mM (in 13.1 min) and equilibrated the column at 2 mM until 20 min total time. The flow rate was set to 0.4 mL min−1 and the suppressor current to 100 mA during the whole analysis. This method also allowed the complete separation of carbonate, which is omnipresent in virtually all samples, from nitrate and sulfate and therefore no coelution of these ions has occurred. A standard solution containing 1 mg L−1 of F−, Cl−, NO3− and SO42- was prepared for the CCD optimization procedures.
The eluent leaving the suppressor is converted to nearly pure water, which contains separated zones of eluted analytes. This means that in contrast to capillary electrophoresis and non-suppressed ion-chromatography, the eluent solution entering the CCD cell has very low conductivity, except for the analyte zones. This results in a low background current through the cell and implies that the amplification circuitry might need adjustment for best signal to noise ratio in the new situation.
Firstly, one has to consider that the first step in the signal processing chain is a current to voltage conversion according to the following equation:
| Vout = −Icell × R | (1) |
It is to be expected that generally a high value of Vout would give best S/N ratio, unless the main source of noise is located in a part of the system ahead of this amplification stage. Therefore the only adjustable variable in eqn. (1), the value of the feedback resistor (R), was changed from the original 1 MΩ to 220 kΩ, then to 5.6 MΩ and 10 MΩ. A standard solution containing the four anions was analyzed three times for each feedback resistor and the S/N ratios for fluoride were compared. A slight decrease in the S/N ratio was observed when the feedback resistor value was changed from 1 MΩ to 220 kΩ, but no improvement was observed for the two higher resistors (5.6 and 10 MΩ). For this reason the 1 MΩ feedback resistor was retained and used in all subsequent experiments.
Secondly, the two parameters affecting the sensitivity of CCD (excitation frequency and voltage) also might need to be adjusted. The excitation frequency was varied between 25 kHz and 200 kHz. The highest signal intensity (and best signal to noise ratio) was obtained at the lowest frequency investigated, i.e. at 25 kHz. This is surprising as, for the buffers with comparatively high background conductivity, as used in capillary electrophoresis and non-suppressed ion-chromatography, the frequency behaviour was found to be substantially different. Under those conditions a plateau in sensitivity was obtained, but only at frequencies higher than about 100 kHz.8 The reason for this difference is not understood. The best S/N ratio was achieved at an excitation voltage of 70 Vp-p. The values for the excitation frequency and voltage determined in these two steps were used in all subsequent measurements.
A standard solution containing 1 mg L−1 of four inorganic anions was used for the performance comparison of the CCD and the contact conductivity detector, which is part of the commercial instrument. Resulting chromatograms of the analysis of the standard solution obtained by the two different detectors are depicted in Fig. 4A and again, except for variations in the scale factor, no discernable differences were found. The relative standard deviation for peak heights and areas obtained for both detectors are given in Table 2 as are the correlation coefficients for 5-point linear calibration curves for the four inorganic anions in the range from 0.05 to 1 mg L−1. The LOD values obtained for the four inorganic anions are also summarized in Table 2. As can be seen, the performance data is excellent for both detectors and surprisingly similar. In order to test the application of the new detector for real samples in the suppressed mode tap and mineral water were diluted 1:25 and rain water was diluted 1:5 and injected into the IC system. The chromatograms of Fig. 4B illustrate the successful analysis of the tap water sample.
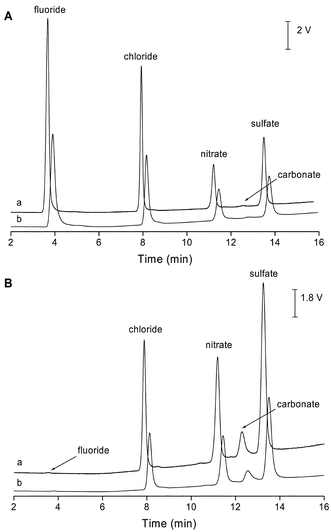 | ||
| Fig. 4 (A) Determination of four inorganic anions in the suppressed conductivity mode: (a) CCD (25 kHz and 70 Vp–p), (b) commercial conductivity detector. Anion concentrations 1 mg L−1. Eluent: linear gradient 2–30 mM KOH in 13 min (for details see text), flow rate = 0.4 mL min−1. (B) Determination of inorganic anions in tap water (1:25) in the suppressed conductivity mode: (a) CCD (25 kHz and 70 Vp–p), (b) commercial conductivity detector. IC conditions as in (A). | ||
| Fluoride | Chloride | Nitrate | Sulfate | |
|---|---|---|---|---|
| a Conditions as for Fig. 4. b RSD (P.A.) = relative standard deviation for peak area (n = 8). c RSD (P.H.) = relative standard deviation for peak height (n = 8). d r 2 (P.A.) = correlation coefficients for the calibration curves based on peak areas. e r 2 (P.H.) = correlation coefficients for the calibration curves based on peak heights. f LOD = limit of detection, concentration giving a peak height equal to 3 × baseline noise. | ||||
| Contactless conductivity detection | ||||
| RSD (P.A.)b (%) | 0.95 | 1.25 | 0.89 | 1.55 |
| RSD (P.H.)c (%) | 1.43 | 0.69 | 1.02 | 1.40 |
| r 2 (P.A.)d | 0.9999 | 0.9999 | 0.9998 | 0.9998 |
| r 2 (P.H.)e | 0.9996 | 0.9997 | 0.9998 | 0.9997 |
| LODf/µg L−1 | 1.5 | 2 | 5 | 4 |
| Conventional conductivity detection | ||||
| RSD (P.A.)b (%) | 1.00 | 1.45 | 0.67 | 1.62 |
| RSD (P.H.)c (%) | 1.71 | 1.09 | 1.09 | 1.38 |
| r 2 (P.A.)d | 0.9999 | 0.9999 | 0.9998 | 0.9998 |
| r 2 (P.H.)e | 0.9997 | 0.9996 | 0.9999 | 0.9996 |
| LODf/µg L−1 | 1.5 | 2 | 5 | 4 |
Conclusion
The self-made capacitively coupled contactless conductivity detector showed a performance in non-suppressed as well as suppressed ion-chromatography, which in all aspects are comparable to that of the conventional commercial detectors. The surprising similarity of the results for both types of detector indicates that, at least for the configurations used, the performance was largely limited by the chromatographic systems and not the detectors. In comparison with the contactless high frequency oscillometric detector reported previously for ion-chromatography,21 the performance of the new and, in terms of cell design as well as electronic circuitry, significantly simpler arrangement is favourable. This could be achieved using a detector cell originally designed for capillary electrophoresis. It is thus possible to employ the same system as a dual-use detector for both analytical methods. The construction of the detector cell itself is much simpler than that of conventional ones with electrodes in contact, and electrode fouling is not possible. The cell and its circuitry may be built in any electronic workshop at modest cost providing a suitable substitute for the more expensive commercial units.Acknowledgements
Financial support from the Swiss National Science Foundation (Grant No. 2000-67830) is gratefully acknowledged. The authors also would like to thank Professor Vlastimil Kubáň from the Department of Chemistry and Biochemistry, Mendel University, Brno, Czech Republic, for help with the IC measurements using the Dionex DX600 system.References
- A. J. Zemann, E. Schnell, D. Volgger and G. K. Bonn, Anal. Chem., 1998, 70, 563 CrossRef CAS.
- J. A. Fracassi da Silva and C. L. do Lago, Anal. Chem., 1998, 70, 4339 CrossRef.
- K. Mayrhofer, A. J. Zemann, E. Schnell and G. K. Bonn, Anal. Chem., 1999, 71, 3828 CrossRef CAS.
- T. Chvojka, I. Jelínek, F. Opekar and K. Štulík, Anal. Chim. Acta, 2001, 433, 13 CrossRef CAS.
- P. Tůma, F. Opekar and I. Jelínek, Electroanalysis, 2001, 13, 989 CrossRef CAS.
- J. Muzikár, T. Van de Goor, B. Gaš and E. Kenndler, J. Chromatogr., A, 2001, 924, 147 CrossRef CAS.
- F. E. Hilder, A. J. Zemann, M. Macka and P. R. Haddad, Electrophoresis, 2001, 22, 1273 CrossRef.
- J. Tanyanyiwa, B. Galliker, M. A. Schwarz and P. C. Hauser, Analyst, 2002, 127, 214 RSC.
- P. Kubáň, B. Karlberg, P. Kubáň and V. Kubáň, J. Chromatogr., A, 2002, 964, 227 CrossRef CAS.
- V. Unterholzner, M. Macka, P. R. Haddad and A. Zemann, Analyst, 2002, 127, 715 RSC.
- P. Kubáň, P. Kubáň and V. Kubáň, Electrophoresis, 2002, 23, 3725 CrossRef CAS.
- P. S. Vuorinen, M. Jussila, H. Siren, S. Palonen and M.-L. Riekkola, J. Chromatogr., A, 2003, 990, 45 CrossRef CAS.
- M. Macka, J. Hutchinson, A. Zemann, Z. Shusheng and P. R. Haddad, Electrophoresis, 2003, 24, 2144 CrossRef CAS.
- T. Kappes, B. Galliker, M. Schwarz and P. C. Hauser, Trends Anal. Chem., 2001, 20, 133 CrossRef CAS.
- P. Kubáň, P. Kubáň and V. Kubáň, Electrophoresis, 2003, 24, 1935 CrossRef CAS.
- P. Kubáň, P. Kubáň and V. Kubáň, Anal. Bioanal. Chem., in press Search PubMed.
- P. Kubáň, P. Kubáň, P. C. Hauser and V. Kubáň, Electrophoresis, in press Search PubMed.
- J. Tanyanyiwa, S. Leuthardt and P. C. Hauser, J. Chromatog., A, 2002, 978, 205 CrossRef CAS.
- J. Tanyanyiwa and P. C. Hauser, Electrophoresis, 2002, 23, 3781 CrossRef CAS.
- J. A. Fracassi da Silva and C. L. do Lago, Electrophoresis, 2000, 21, 1405 CrossRef CAS.
- F. Pál, E. Pungor and E. Kováts, Anal. Chem., 1988, 60, 2254 CrossRef CAS.
- K. Mayrhofer, E. Schnell, G. Bonn and A. Zemann, HPLC 1999, Symposium on High Performance Liquid Phase Separations and Related Techniques, Granada, Spain, May 30–June 4, 1999 Search PubMed.
| This journal is © The Royal Society of Chemistry 2004 |