Binding patterns of vanadium to transferrin in healthy human serum studied with HPLC/high resolution ICP-MS
Megumi Hamano Nagaoka, Hiroshi Akiyama and Tamio Maitani*
National Institute of Health Sciences, Kamiyoga 1-18-1, Setagaya, Tokyo 158-8501, Japan
First published on 27th November 2003
Abstract
Vanadium (V) is an essential metal for mammals. It has different valence states. In blood, V is bound to transferrin (Tf), a glycoprotein that has two metal-binding sites (C-lobe site and N-lobe site). In the present study, the binding patterns of V to serum Tf were analyzed by combined on-line HPLC and high-resolution ICP-MS (HPLC/HR-ICP-MS). The levels of 51V, 56Fe and 32S, which are interfered with polyatomic ions such as 35Cl16O+, 38Ar13C+ and 37Cl14N+, 40Ar16O+ and 40Ca16O+, and 16O2+, respectively, when using quadrupole ICP-MS, could be monitored simultaneously by HR-ICP-MS at a resolution of m/Δm = 4000. Sample (a 1 ml portion of serum from a healthy person or 2 mg of human serum Tf (hTf)) was directly subjected to HPLC equipped with an anion-exchange column. V in human serum without any in vitro V spike was detected as VC–Tf (V bound to C-lobe site of Tf) and metal2–Tf. Since V(III) was most favorable in terms of the binding to hTf in the presence of bicarbonate and V bound to the C-lobe site of hTf was detected only in the case of V(III) among the three valence states of V, it was suggested that a part, at least, of V in the VC–Tf in healthy human serum may be present as V(III), in addition to the generally accepted V(IV).
Introduction
Vanadium (V) is an essential metal for mammals,1,2 although its role in humans has not been elucidated yet. Recently, it has been reported that V compounds lower the blood glucose level in rodent models of diabetes mellitus.3–6 Therefore, much attention has been focused on the activity of V in the body.Transferrin (Tf) is a glycoprotein of about 80 kDa with the characteristic property of requiring a synergistic anion.7 Although its principal role in the blood is to transfer iron (Fe) to cells,8 it can bind a large number of other metals. Vanadium is bound to Tf in the blood.9,10 It has two homologous lobes for metal-binding (hereafter called the N-lobe site and the C-lobe site) connected by a single short peptide.11 Although the amino acid sequence of the two lobes reveals extensive identity12 and the ligands for each Fe-binding site consist of two tyrosines, one histidine, one aspartic acid and a bidentate anion such as carbonate,1 the binding affinity of the two lobes is not identical.13,14 The preferential site depends on the kinds of Tf, metal and synergistic anion.15 For example, we reported the preferential binding of Fe and aluminium (Al) to the N-lobe site in the presence of bicarbonate as the synergistic anion.16,17
Vanadium ions are present in several valence states including V(III) (vanadic), V(IV) (vanadyl) and V(V) (vanadate). Since V(IV) and V(V) ions are present as oxovanadium ions (VO2+ and VO2+, respectively), they are bulky. Moreover, the oxo group(s) of oxovanadium ions may supply ligands supplied usually by synergistic anions.18 The fact that V(V) binding to Tf does not require the presence of bicarbonate19,20 may support this explanation, although the synergistic anion is required for the binding of V(IV) to Tf.21,22 Thus, the preferential binding lobe and the binding affinity of V ion to Tf differ markedly depending on its valence state.
An on-line combination of HPLC and metal-detection spectrometry is widely used for the speciation of metals in biological samples. For detecting metals, ICP-MS has an extremely high sensitivity,23 which is preferable for trace metals in biological samples. However, polyatomic-isotope interference from argon gas, atmospheric gas and biological materials can cause serious errors in the determination with common quadrupole ICP-MS instruments.24 In the case of V in biological samples, 35Cl16O+ (m/z 50.964 u), 38Ar13C+ (m/z 50.966 u) and 37Cl14N+ (m/z 50.969 u) interfere with the detection of 51V (m/z 50.944 u and the natural abundance is 99.75%). Moreover, in the measurement of Fe, which is essential for the study of Tf, the detection of 56Fe (m/z 55.935 u and natural abundance is 91.72%) is affected by 40Ar16O+ (m/z 55.957 u), because an argon plasma is used in the ICP spectrometry. However, by using a double focusing high-resolution ICP-MS (HR-ICP-MS), the analyte signal is separated from the interference.25
In our previous study, the binding of V ions to two lobes of apo-human serum Tf (hTf) in the presence and absence of bicarbonate was studied in three different valence states (V(III), V(IV) and V(V)), using an on-line combination of HPLC and HR-ICP-MS (HPLC/HR-ICP-MS) with an anion-exchange column.26 The three ions ranked V(III) > V(IV) > V(V) in affinity to hTf in the presence of bicarbonate.
In the present study, we studied the binding patterns of both V and Fe in healthy human serum. Since the V level was quite low, a 1 ml sample was required to obtain the V peak even with HR-ICP-MS. The established new analytical system and the new finding on the valence state of V in the serum are reported in the present study.
Experimental
Reagents
Apo-hTf (>97%) was purchased from Sigma (St. Louis, MO) and used without further purification. Vanadium(III) chloride, ferric chloride hexahydrate, sodium citrate and sodium bicarbonate were purchased from Wako Pure Chemicals Industries, Ltd. (Osaka, Japan). The calibration solution for ICP-MS measurements was obtained from SPEX (Metuchen, NJ) as a multi-element standard stock solution (10 µg ml−1). Nitric acid of ultra-pure analytical reagent grade (TAMAPURE-AA-10) was purchased from Tama Chemicals Co., Ltd. (Kawasaki, Japan). Other chemicals were of reagent grade or of the highest grade commercially available. All laboratory ware used was immersed in about 2 M HNO3 for at least one night and rinsed with ultra-pure water (>18 MΩ cm), which was prepared with a Milli-Q SP Reagent Water System (Millipore, Bedford, MA), to avoid contamination from various ions. The ultra-pure water was bubbled with nitrogen gas for 30 min to remove dissolved oxygen completely and used throughout the experiment.Sample preparation for HPLC/HR-ICP-MS
Blood collections from the healthy volunteers were carried out following the guidelines of the ethics regulations of our institute. Serum was obtained by centrifugation at 3000 g.Apo-hTf was dissolved in 10 mM Tris–HCl (pH 7.4) containing 25 mM NaHCO3 as the synergistic anion. Each solution was added to the apo-hTf solution (2 mg apo-hTf ml−1) and the mixture was allowed to stand for the indicated times. After preparing each reagent solution, all tubes and bottles were sealed under a nitrogen gas atmosphere.
HPLC/HR-ICP-MS
An HPLC apparatus (LC-10Ai, Shimadzu, Kyoto, Japan) equipped with an anion-exchange column (TSKgel BioAssist Q analytical column (4.6 mm id × 50 mm, TOSOH, Tokyo, Japan) (column 1) or two TSKgel BioAssist Q preparative columns (20 mm id × 40 mm each, TOSOH, two columns were directly connected) (column 2) was connected directly with an HR-ICP-MS instrument (ELEMENT, Finnigan MAT, Bremen, Germany). A 100 µl sample (serum or 0.2 mg hTf) and a 1 ml sample (serum or 2 mg hTf) were applied to column 1 and column 2, respectively. Two solvents were used for gradient elution: solvent A (50 mM Tris–HCl (pH 7.4)) and B (A + 0.25 M ammonium acetate). HPLC conditions 1 and 2 for columns 1 and 2, respectively, are shown in Table 1. The eluate was transferred to a UV detector (at 280 nm, SPD-10AVi, Shimadzu) and then introduced into the Meinhard nebulizer of the HR-ICP-MS. Under HPLC condition 1, the levels of 32S, 51V and 56Fe were monitored continuously in the medium resolution mode (m/Δm = 4,000). Under HPLC condition 2, the levels of 34S, 51V and 54Fe were monitored. After each analysis, the column was washed to eliminate the V ions adsorbed by the column according to the clean-up procedures reported previously.26 The operating parameters for HR-ICP-MS were as follows: radio frequency power, 1.3 kW: argon gas flow rate, 15 l min−1 (outer), 0.85 l min−1 (intermediate), 0.93 l min−1 (carrier). Mass calibration was performed with a 1 ng ml−1 multi-element standard solution prepared from the standard stock solution, the ultra-pure nitric acid and ultra-pure water. The detection limit (S/N = 3) estimated for 51V in the medium resolution mode was 10 pg ml−1.| HPLC condition 1 for column 1 | ||
|---|---|---|
| Time/min | B (%) | Flow/ml min−1 |
| 0–0.1 | 0–8 | 1 |
| 0.1–8 | 8 | 1 |
| 8–22 | 8–18 | 1 |
| 22–35 | 18 | 1 |
| HPLC condition 2 for column 2 | ||
|---|---|---|
| Time/min | B (%) | Flow/ml min−1 |
| 0–2 | 0 | 0.7 |
| 2–3 | 0 | 0.7–1 |
| 4–7 | 0–7 | 1 |
| 7–19 | 7 | 1 |
| 19–20 | 7 | 1–3 |
| 20–28 | 7 | 3 |
| 28–33 | 7–9 | 3 |
| 33–36 | 9–14 | 3 |
| 37–38 | 14 | 3–1 |
| 38–95 | 14 | 1 |
HR-ICP-MS data acquisition parameters are as follows: E-scan, mass window, 100%; search window, 60%; integration window, 60%; acquisition time, 2.22 s per each run.
Results and discussion
Binding patterns of V in human serum (column 1)
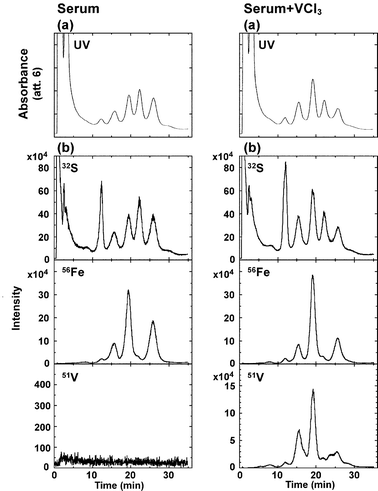
Previously we could detect Al bound to Tf in serum from a healthy person with column 1 under HPLC condition 1. Fig. 1 (left panel) shows the HPLC/HR-ICP-MS chromatograms for serum from a healthy person with column 1 under HPLC condition 1. Though 100 µl serum was subjected to column 1, no V peak was detected, probably due to the low level of V in serum. To ascertain that V peaks can be detected if the amount of V is sufficient, V(III) was added to the serum. As shown in Fig. 1 (right panel), the major three V peaks were detected at 16, 19 and 26 min, which were ascribed to VC–Tf, metal2–Tf and VN–Tf, respectively, in accordance with our previous report.26 | ||
| Fig. 1 HPLC-UV (280 nm, top) (a) and HPLC/HR-ICP-MS (32S (top), 56Fe (middle) and 51V (bottom) levels) (b) chromatograms for serum from a healthy person before (left) and after (right) the addition of VCl3. The respective sample solutions were sealed under a nitrogen gas atmosphere and allowed to stand for 2 h before analysis. Column 1 and HPLC condition 1 were used. | ||
However, the heights of V peaks in the serum sample were different from those in the hTf sample of our previous report. Namely, V peaks ranked metal2–Tf > VC–Tf > VN–hTf for the serum sample in Fig. 1 (right panel) and ranked metal2–hTf > VN–hTf > VC–hTf for the hTf sample. Therefore, it was considered that various compounds in serum such as citrate, oxalate, etc. may have affected the binding affinity of V to Tf in the serum sample. In fact, though citrate is a non-synergistic anion, it is present in serum at the concentration of 0.1 mM and forms chelates easily with V(III).
Establishment of HPLC condition 2 with column 2
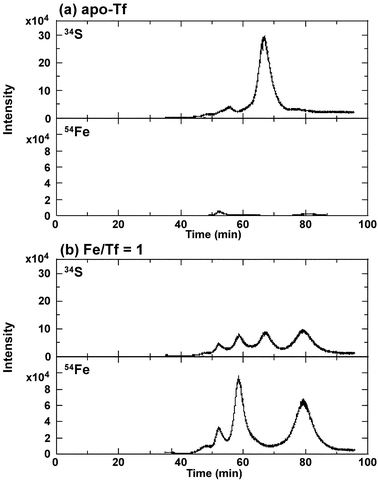
To apply the 1 ml portion of the serum sample to the HPLC column and to separate all peaks of metal-binding Tf and apo-Tf, we adopted the preparative column and devised the gradient conditions as shown in Table 1. The major three Fe-binding hTfs and apo-hTf were detected at 53, 59, 67 and 79 min in Fe-supplemented apo-hTf and were assigned to FeC–hTf, metal2–hTf, apo-hTf and FeN–hTf, respectively, based on the comparison with the chromatogram from column 1.In our previous study,17 beside the FeC–hTf peak at 16 min, a small Fe peak was observed at 10 min and it was ascribed to Fe bound to hTf with smaller numbers of sialic acid molecules, as sialidase-treated hTf eluted faster than non-treated hTf.27 Therefore, in establishing HPLC condition 2, it was ensured that FeC–hTf could be distinguished from Fe bound to disialo- or trisialo-hTf. Thus, the HPLC condition 2 was prudently established to perfectly separate the peaks of V bound to native-hTf and that of V bound to disialo- or trisialo-hTf.
Since the 1 ml portion of the sample, which is ten times that used with column 1 in Fig. 1, was analyzed, the levels of 34S (m/z 33.968, natural abundance 4.21%) and 54Fe (m/z 53.940, natural abundance 5.80%) were monitored instead of 32S (m/z 31.972, natural abundance 95.02%) and 56Fe (m/z 55.935, natural abundance 91.72%), respectively. The eluate from 0 to 38 min was rich in ionic and organic compounds and so the flow rate under HPLC condition 2 was frequently changed. The HPLC apparatus was thus not combined with the HR-ICP-MS instrument until 38 min to avoid damage to the HR-ICP-MS instrument. Hence, the chromatograms started at 38 min in Fig. 2.
 | ||
| Fig. 2 HPLC/HR-ICP-MS (34S and 54Fe levels) chromatograms for apo-hTf solution (a) and apo-hTf solution supplemented with Fe-citrate (1:1) (Fe/hTf molar ratio = 1) (b) in the presence of bicarbonate. The mixed solution was allowed to stand for 24 h. Column 2 and HPLC condition 2 were used. | ||
Binding patterns and total amount of V in serum
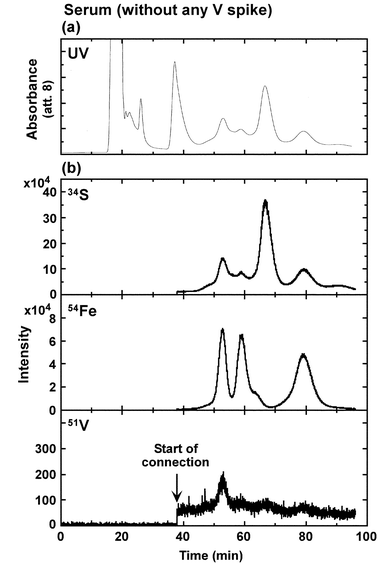
Fig. 3 represents the HPLC chromatograms obtained by UV absorption (280 nm) and HR-ICP-MS (34S, 54Fe and 51V) for a 1 ml portion of serum from a healthy person. Since Milli-Q water was introduced to the HR-ICP-MS instrument until 38 min, V levels (about 10 cps) detected between 0 and 38 min were considered to be due to Milli-Q water or instrumental noise. In the V-level chromatogram, only one peak was apparently detected at the retention time of FeC–Tf (53 min) and was ascribed to VC–Tf. Although not definite, very small peaks were also observed at the retention times of metal2–Tf (59 min) and FeN–Tf (79 min). | ||
| Fig. 3 HPLC-UV (280 nm, top) (a) and HPLC/HR-ICP-MS (32S (top), 56Fe (middle) and 51V (bottom) levels) (b) chromatograms for serum from a healthy person without any V spike. Column 2 and HPLC condition 2 were used. | ||
The V concentration in the serum sample was measured with a 20 fold diluted sample. The V concentration in the serum was 140 pg ml−1. The total area of V from 38 to 95 min corresponded to about 60% of the injected V content. The peak area of VC–Tf peak occupied 42% of the total V area. Therefore, it was considered that most of the total V in the serum was detected by HPLC/HR-ICP-MS. The reported serum V concentrations were 50 pg ml−1 from electrothermal atomic absorption spectrometry,28 and 31 pg ml−1 from radiochemical neutron activation analysis29 and reported to be 10–760 pg ml−1 with HR-ICP-MS.30 The serum V concentration in the present study (140 pg ml−1) was comparable with the reported values.
Binding patterns of V added as V(III) or V(IV) in serum from a healthy person and valence state of V in serum
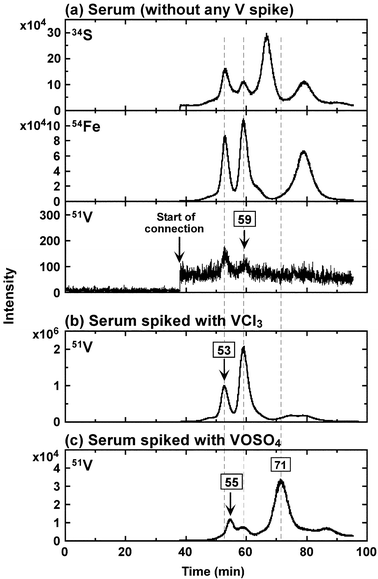
To confirm the binding site of V bound to Tf in vivo, V was added as V(III) or V(IV) to serum from a healthy person. Fig. 4 depicts the HPLC/HR-ICP-MS (34S, 54Fe and 51V) chromatograms for healthy human serum without any V spike (top) and supplemented with VCl3 (middle) or VOSO4 (bottom). | ||
| Fig. 4 HPLC/HR-ICP-MS (34S, 54Fe and 51V levels) chromatograms for serum from a healthy person without any V spike (a), serum spiked with VCl3 (b) or VOSO4 (c) at 25 µM. The mixed solution was allowed to stand for 2 h. Column 2 and HPLC condition 2 were used. | ||
In Fig. 4 (top), two obvious V peaks were observed at the retention times of VC–Tf (53 min) and metal2–Tf (59 min) in the chromatogram for serum without any V spike. In the previous study, the N-lobe site was the preferential binding site of Fe in the presence of bicarbonate.16 On the other hand, V(III) preferred both the C-lobe and N-lobe as affirmed by the Urea–PAGE.26 Therefore, it seems plausible that V(III) binds to the C-lobe in serum and metal2–Tf is VC,FeN–Tf.
When the serum was supplemented with V(III) at the molar ratio (V/Tf) of 1, two major peaks were observed at the same retention times of FeC–Tf (53 min) and metal2–Tf (59 min). On the other hand, V(IV) gave a peak at a slightly longer retention time (55 min) as well as the peak of N-lobe in an “open form”26 at the retention time of 71 min. The observed slightly longer retention time (55 min) may suggest that when bound to the C-lobe site, bulky V(VI) (VO2+) is bound to Tf in an “open form” as also observed in the previous study26.
In the previous study,26 VC–hTf in the “closed form” corresponding to the peak at 53 min in this study could not be detected by the HPLC/HR-ICP-MS after the addition of V(IV) or V(V) ion to apo-hTf in the presence of bicarbonate. Moreover, a part of the V ions was removed from V–hTf during the column procedure.26 It was also reported that V(V)–hTf binding was dissociated during the elution in the anion-exchange column procedure.31 Therefore, the possibility that the V bound to the C-lobe site of Tf in the serum detected by the HPLC/HR-ICP-MS is V(IV) and/or V(V) seems low.
Consequently, it was considered that the V detected as VC–Tf in the “closed form” was V(III). Thus, the interpretation that the V peak detected in the serum from a healthy person is of V(III) bound to the C-lobe site was confirmed by the standard addition experiment. This is the first report that demonstrates the V-binding lobe of Tf in healthy human serum.
Recently, it has been demonstrated that V compounds show insulin-like activity.3–6 The effectiveness of V(IV) and V(V) compounds has been reported previously.32 Since V(III) has a much higher affinity for hTf, the possibility that V ions are transferred in serum as V(III) may have to be studied further to clarify the action of V in the body.
References
- K. Schwarz and D. B. Milne, Science, 1971, 174, 426–428 CAS.
- L. L. Hopkins, Jr and H. E. Mohr, Fed. Proc., 1974, 33, 1773–1775 Search PubMed.
- C. E. Heyliger, A. G. Tahiliani and J. H. McNeill, Science, 1985, 227, 1474–1477 CAS.
- J. Meyerovitch, Z. Farfel, J. Sack and Y. Shechter, J. Biol. Chem., 1987, 262, 6658–6662 CAS.
- S. Ramanadham, J. J. Mongold, R. W. Brownsey, G. H. Cros and J. H. McNeill, Am. J. Physiol., 1989, 257, H904–H911 Search PubMed.
- N. Cohen, M. Halberstam, P. Shlimovich, C. J. Chang, H. Shamoon and L. Rossetti, J. Clin. Invest., 1995, 95, 2501–2509 Search PubMed.
- J. M. Aramini, J. A. Saponja and H. J. Vogel, Coord. Chem. Rev., 1996, 149, 193–229 CrossRef CAS.
- P. F. Lindley, in Handbook of Metalloproteins, ed. A. Messerschmidt, R. Huber, T. Poulos and K. Wieghardt, Wiley, Chichester, 2001, vol. 2, pp. 793–811 Search PubMed.
- N. D. Chasteen, J. K. Grady and C. E. Holloway, Inorg. Chem., 1986, 25, 2754–2760 CrossRef CAS.
- W. R. Harris, S. B. Friedman and D. Silberman, J. Inorg. Biochem., 1984, 20, 157–169 CrossRef CAS.
- B. F. Anderson, H. M. Baker, G. E. Norris, S. V. Rumball and E. N. Baker, Nature, 1990, 344, 784–787 CrossRef CAS.
- R. T. MacGillivray, E. Mendez, J. G. Shewale, S. K. Sinha, J. Lineback-Zins and K. Brew, J. Biol. Chem., 1983, 258, 3543–3553 CAS.
- D. C. Harris and P. Aisen, Biochemistry, 1975, 14, 262–268 CrossRef CAS.
- C. A. Smith, B. F. Anderson, H. M. Baker and E. N. Baker, Biochemistry, 1992, 31, 4527–4533 CrossRef CAS.
- H. Sun, M. C. Cox, H. Li and P. J. Sadler, Struct. Bonding, 1997, 88, 71–102 CAS.
- M. H. Nagaoka and T. Maitani, Biochim. Biophys. Acta, 2000, 1523, 182–188 CrossRef CAS.
- M. H. Nagaoka and T. Maitani, Analyst, 2000, 125, 1962–1965 RSC.
- A. Butler and C. J. Carrano, Coord. Chem. Rev., 1991, 109, 61–105 CrossRef CAS.
- W. R. Harris and C. J. Carrano, J. Inorg. Biochem., 1984, 22, 201–218 CrossRef CAS.
- N. D. Chasteen, Met. Ions Biol. Syst., 1995, 31, 231–247 Search PubMed.
- R. F. Campbell and N. D. Chasteen, J. Biol. Chem., 1977, 252, 5996–6001 CAS.
- J. Mazurier, J. M. Lhoste, J. Montreuil and G. Spik, Biochim. Biophys. Acta., 1983, 745, 44–49 CAS.
- N. Jakubowski, L. Moens and F. Vanhaecke, Spectrochim. Acta, Part B, 1998, 53, 1739–1763 CrossRef.
- U. Giessmann and U. Greb, Fresenius’ J. Anal. Chem., 1994, 350, 186–193 CrossRef CAS.
- N. M. Reed, R. O. Cairns, R. C. Hutton and Y. Takaku, J. Anal. At. Spectrom., 1994, 9, 881–896 RSC.
- M. H. Nagaoka, T. Yamazaki and T. Maitani, Biochem. Biophys. Res. Commun., 2002, 296, 1207–1214 CrossRef CAS.
- M. H. Nagaoka and T. Maitani, Biochim. Biophy. Acta, 2001, 1526, 175–182 CrossRef CAS.
- G. Heinemann and W. Vogt, Clin. Chem., 1996, 42, 1275–82 CAS.
- Cornelis, J. Versieck, L. Mees, J. Hoste and F. Barbier, J. Radioanal. Chem., 1980, 55, 35–43.
- Yang, R. E. Sturgeon, D. Prince and S. Gabos, J. Anal. At. Spectrom., 2002, 17, 1300–1303 RSC.
- K. De Cremer, R. Cornelis, K. Strijckmans, R. Dams, N. Lameire and R. Vanholder, J. Chromatogr., B, 2002, 775, 143–152 CrossRef CAS.
- B. I. Posner, C. R. Yang and A. Shaver, in Vanadium Compounds Chemistry, Biochemistry, and Therapeutic Applications, ACS Symposium Series, No 711, ed. A. S. Tracey and D. C. Crans, American Chemical Society, Washington DC, 1998, pp. 316–328 Search PubMed.
| This journal is © The Royal Society of Chemistry 2004 |
