Sensitive and selective analysis of coenzyme Q10 in human serum by negative APCI LC-MS
Gregers Hansen, Peter Christensen, Erik Tüchsen and Torben Lund*
Department of Life Sciences and Chemistry, Roskilde University, DK-4000, Denmark
First published on 25th November 2003
Abstract
Two new sensitive and selective LC-MS methods have been developed for the quantification of the total coenzyme Q10 concentration in human blood serum. The sensitivity of the methods is based on the very efficient formation of the radical anions of CoQ10 [M−˙] by negative atmospheric pressure ionisation, APCI(−). The mass detection of the [M−˙] ions, m/z = 862.6, was performed either in selective ion monitoring (SIM) or in MS2 mode (m/z = 862.6 → m/z = 847.6) using an LCQ-deca ion-trap mass spectrometer. Two standard serum samples with medium (0.73 µg ml−1) and high (1.96 µg ml−1) total CoQ10 concentrations were analysed by LC-APCI(−)-SIM and LC-APCI(−)-MS2 and the results compared with a HPLC literature procedure with electrochemical detection (ECD). Both the LC-MS methods were shown to be more selective and with comparable or better sensitivity than the HPLC-ECD method. The LC-MS-SIM and LC-MS2 chromatograms of the medium concentration sample showed CoQ10 signal to noise ratios of 25 and 625, respectively. In addition, a simple and fast serum pre-treatment procedure was developed, in which the serum CoQ10H2 content was quantitatively oxidised quantitatively to CoQ10 in less than 15 min by 1,4-benzoquinone.
Introduction
Coenzyme Q10 (ubiquinone) plays an essential role in the mitochondria electron-transport chain, undergoing oxidation and reduction via a free-radical intermediate, ubisemiquinone (CoQH˙).1,2 Ubiquinone is produced in the body in varying amounts depending upon diet or diseases, (e.g. it is known that there is a deficiency in patients with myocardial diseases,3–5 angina pectoris,6 and alcoholism4 and it affects myocardial performance in general7). More than 90% of the CoQ10 content in human serum exists in its reduced form, CoQ10H2 (ubiquinole)8,9 and the total amount of CoQ10 in human plasma (the sum of the reduced and oxidized forms) for normal, healthy persons is in the range of 0.4 to 2.0 µg ml−1.10 Structures shown in Fig. 1.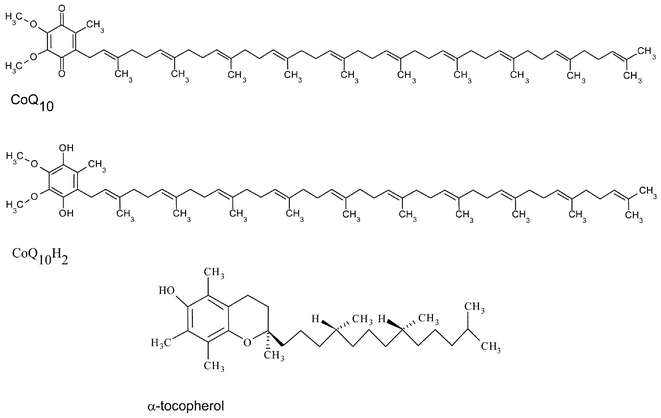 | ||
| Fig. 1 Structures of CoQ10, CoQ10H2 and α-tocopherol. | ||
Many procedures have been reported for the analysis of CoQ10 in human plasma.8–21 The total CoQ10 concentration may be obtained by the simultaneous detection of both the reduced and oxidized CoQ10.8–16 However, CoQ10H2 is very unstable10,17 and for routine clinical total CoQ10 determinations of many samples a better strategy is to oxidise the reduced form to CoQ10 before or during the extraction.15–21 The oxidation has been performed with O2,14,18–20 FeCl3,11 CuCl217 and 1,4-benzoquinone.21 The total CoQ10 concentrations are usually obtained by analysis of the extracts by reverse-phase, high-performance liquid chromatography (RP-HPLC) coupled either with a UV or electrochemical detector (ECD). For small serum sample volumes (<100 µl) the UV detector is, in general, not sensitive enough and the ECD, which is more sensitive and selective than the UV detector, has therefore become the preferred detector for CoQ10 analysis in human serum. The electrochemical detector, however, is sensitive to high concentrations of lipophilic plasma components, which may passivate the coulometric electrodes and shorten their lifetime considerably.
HPLC coupled to a mass spectrometer (LC-MS) has become a very popular analytical technique during the last 10 years, and many laboratories are now equipped with such instruments. The selectivity of the MS detector is even higher than that of the ECD, and its sensitivity is comparable or better. Determination of CoQ10 with LC-MS should therefore be an attractive alternative to the established HPLC-ECD methods. To our knowledge, LC-MS methods have not previously been reported in the analysis of ubiquinone in human serum and only very recently, LC-MS was used to analyse the ubiquinones Q4–Q14 in bacterial cells by positive electrospray MS.22
We therefore decided to develop a simple, robust and fast LC-MS method for the determination of total CoQ10 concentrations in human serum. CoQ10H2 was oxidised to CoQ10 by 1,4-benzoquinone in a very simple pre-handling procedure similar to the method reported very recently by Litterau and co-workers.21 The concentrations of CoQ10 obtained by the new LC-MS method have been compared with measurements obtained by a standard HPLC-ECD procedure.11
Experimental
Materials
Coenzyme Q10 was a gift from Pharma Nord, Denmark. CoQ9, sodium borohydride, 1,4-benzoquinone and 2,3-dichloro-5,6-dicyano-1,4-benzoquinone were purchased from Sigma Aldrich. All solvents used were HPLC grade. Two calibrated samples of human serum with medium and high concentration of CoQ10 were kindly donated by Prof. Litterau.23 The sera were obtained from a person who was supplemented orally with 150 mg CoQ10 per day for 30 days, and from a non-supplemented person. The two serum test samples are named supp and non-supp, respectively. The sera were obtained after informed consent in compliance with relevant laws and institutional guidelines.Instrumentation
The LC-MS instrument was equipped with an UV-diode array detector with a 5 cm flow cell in series with the MS detector. Its HPLC instrument (TSP Spectra system) was composed of an AS3000 auto sampler, P4000 gradient pump, and a vacuum degasser, in addition to the UV 6000 LP diode array detector. The fractionation of a 10 µl aliquot of a serum extract sample was performed isocratically within a 1:4 mixture of 2-propanol and methanol at room temperature, with a flow rate of 0.2 ml min−1. The analytical column was a 50 mm Xterra MS RP C18 column from Waters with an id of 2.1 mm fitted with a 10 mm guard column (Xterra RP C18). The mass detector was a LCQ-Deca ion-trap instrument from Thermo-Finnigan, equipped with an atmospheric pressure chemical ionisation interface (APCI) running in negative mode. A negative potential (−5 kV) was applied to the metal needle, with a discharge current of 4.5 µA, capillary voltage of −26 V, capillary temperature of 175 °C, vaporiser temperature of 350 °C, sheath gas (N2) and auxiliary gas (N2) 31 and 8 arbitrary units, respectively. The MS detector was run either in selective ion monitoring (SIM) at the mass intervals m/z = 426.9–431.9, 792.2–797.2 and 860.3–865.3 with a maximum scan time of 200 ms or in MS2 mode m/z 794.7 → m/z 779.7 and m/z 862.8 → m/z 847.8. The MS2 filtration was performed in two scan events, isolation of 5 mass units and relative fragmentation energy 32%. (Maximum scan time = 400 ms.) The LCQ software Xcalibur 1.2 controlled the chromatographic and mass spectrometric analyses.The HPLC-ECD measurements were performed on a system composed of a Dionex LC-10AD pump, a Dionex model 232 Bio sample injector, an Alltech 150 × 4.6 mm 5µ Prevail RP C18 column, and an ESA CoulochemII electrochemical detector equipped with a model 5021 conditioning cell and a model 5011 twin analytical cell (ESA, Bedford, MA). The 1 V analogue output of the ESA detector was connected to the ADC of the Dionex system and the data collected on a computer running Dionex Chromelon v. 6.4. The mobile phase consisted of MeOH/EtOH/iPrOH/1 M aqueous NH4Ac, pH 4.4 (53/24/21/2),24 flow rate 0.8 ml min−1. The conditioning cell was set at 0 V, and the analytical cell compartments were set at −1000 and +300 mV. The current of the latter cell was measured at a full scale sensitivity of 20 nA.
Serum preparation and extraction procedures
Oxidation experiments
Oxidation of CoQ10H2 with air was performed by two methods. In the first, the methanol serum extract was purged with air for 15 min. In the second, the methanol extract was passed through a Sep-Pak RP C18 column and then evaporated at 40 °C in a stream of nitrogen according to the method of Grossi et al.18 The residue was dissolved in a 1:4 mixture of 2-propanol and methanol.Tests of 1,4-benzoquinone (BQ) and 2,3-dichloro-5,6-dicyano-1,4-benzoquinone (DDQ) as oxidizing agents were performed by adding 50 µl of a stock solution of the benzoquinone (0.40 mg ml−1 in 1-propanol) into 4 Eppendorf tubes containing 50 µl of non-supp serum sample. CoQ10 was extracted after 5, 10, 15, and 60 min with 1.0 ml of 1-propanol as described above.
Standard solutions
Stock solutions of CoQ10 (1.0 mg ml−1) and the internal standard CoQ9 (0.20 mg ml−1) were prepared in isooctane. The stock solutions were protected from light by aluminium foil and stored at −20 °C for up to 2 months. The working standard solutions were made by dilution with 1-propanol to 1 µg ml−1. Before analysis the accurate concentrations of the stock solutions were obtained by spectrophotometry at 275 nm, ε = 14020 l mol−1 cm−1 and 14440 l mol−1 cm−1 for CoQ10 and CoQ9, respectively.15Calibration curves
Calibration curves were obtained by preparing five standards in the HPLC eluent with a fixed internal standard CoQ9 concentration (46.25 ng ml−1) and the CoQ10 concentrations 25, 50, 75 and 100 ng ml−1. These were run by the LC-MS-SIM or the LC-MS2 method. A calibration curve was typically obtained for every 15 samples and used by the Xcalibur software for the automatic calculations of CoQ10 concentrations.Results and discussion
Development of LC-APCI(−)-MS
Ionisation of CoQ10 prior to the MS analysis may be performed by atmospheric chemical ionisation (APCI) or electrospray ionisation (ESI) in either positive or negative mode. We have tested all four possible ionisation combinations in order to obtain the most efficient analytical MS detection method of CoQ10 in human serum. APCI, in positive mode, produces a single ion m/z = 863.8 [M + H]+ with high intensity and in negative mode the radical anion m/z = 862.8 [M−˙] is generated with a high yield. The APCI interface served as a source of low energy thermal electrons, and the radical anions [CoQ10]−˙ are produced by an electron capture mechanism similar to the ionisation mechanism of nitroaromatic compounds.25 The efficient formation of [CoQ10]−˙ may be explained by the high electron affinities of quinones.26 The positive ESI mass spectrum of CoQ10 dissolved in methanol with 10 mM ammonium acetate added is more complicated. More than seven adduct ions are produced. The seven most common ones are m/z = 863.8 [M + H]+; m/z = 880.5 [M + NH4]+; m/z = 885.8 [M + Na]+; m/z = 901.7 [M + K]+; m/z = 919.5 [M + 3H20]+; m/z = 924.2 [M + CH3CH2CH2OH ]+; m/z = 1748.2 [2M + Na]+. The sensitivity of CoQ10 obtained by LC-ESI(+)-MS is therefore expected to be low. ESI in negative mode produced the M−˙ ion with very low intensity. The LC-MS-SIM chromatograms of a representative total CoQ10 serum extract obtained by means of the four ionisation modes ESI(+), ESI(−), APCI(+) and APCI(−) are shown in Fig. 2a–d. The S/N improvement of the CoQ10 peak obtained by APCI(−) relative to APCI(+) and ESI(+) are 50 and 100, respectively. Very nice chromatograms are obtained for the standard solutions of CoQ9 and CoQ10 using APCI in the positive mode; however the noise levels in chromatograms of the serum extracts are much higher compared to those in chromatograms obtained by APCI in the negative mode (see Fig. 2c). This is probably due to the more efficient ionisation of the co-eluting lipid components in the positive mode compared to the negative mode. In conclusion, ionisation by APCI in the negative mode is the best ionisation method for the analysis of CoQ10 in human serum.![LC-MS analysis of a non-supp serum extract by four different ionization modes. (a) ESI+ (b) ESI− (c) APCI+ (d) APCI−. The MS detector was run in SIM mode. [CoQ9]
= 46.25 ng ml−1.](/image/article/2004/AN/b308690a/b308690a-f2.gif) | ||
| Fig. 2 LC-MS analysis of a non-supp serum extract by four different ionization modes. (a) ESI+ (b) ESI− (c) APCI+ (d) APCI−. The MS detector was run in SIM mode. [CoQ9] = 46.25 ng ml−1. | ||
The MS2 and MS3 spectra of CoQ10 obtained by APCI(−) showed the elimination of one methyl group in each ion isolation fragmentation step, m/z = 862.8 (M−) → m/z = 847.6 (M− −15) → m/z = 832.6 (M− −30). The MS and MSn spectra of the internal standard CoQ9 were similar to those of CoQ10, except that all m/z values were 68 mass units lower. Vitamin E is characterised by the ion m/z = 429 (M − H)−. LC-MS chromatograms with the ion-trap operating in selective ion monitoring (SIM), MS2 and MS3 were obtained on a typical serum extract (non-supp) in order to determine the optimal MS detection mode. Fig. 3 shows a typical chromatogram of a non-supp serum sample obtained by LC-MS2. The S/N ratios of CoQ10 obtained in the SIM, MS2 and MS3 modes were 25, 625 and 425, respectively. The MS2 ion filtration mode is therefore the most selective and efficient method of the three ion sampling techniques. The S/N ratios of the LC-MS-SIM method are, in general, sufficient for accurate CoQ10 analysis and we have applied both the SIM and MS2 mass filtration techniques in this work.
![LC-MS2 analysis of a non-supp serum sample with [CoQ9]
= 46.25 ng ml−1. The ion chromatogram is obtained as the sum of the two ion traces m/z
= 779.7 and 847.8 of CoQ9 and CoQ10 respectively. The insert shows the noise level on the MS2 trace of CoQ10 in the time interval 2.5–4.5 min.](/image/article/2004/AN/b308690a/b308690a-f3.gif) | ||
| Fig. 3 LC-MS2 analysis of a non-supp serum sample with [CoQ9] = 46.25 ng ml−1. The ion chromatogram is obtained as the sum of the two ion traces m/z = 779.7 and 847.8 of CoQ9 and CoQ10 respectively. The insert shows the noise level on the MS2 trace of CoQ10 in the time interval 2.5–4.5 min. | ||
In Table 1 the retention times of vitamin E, CoQ10H2, CoQ9 and CoQ10 and the corresponding SIM and MS2m/z values are shown. The LC-MS analysis of CoQ10H2 is discussed below.
| LC-APCI(−)-MS | Vitamin E | CoQ10H2 | CoQ9 | CoQ10 |
|---|---|---|---|---|
| Rt/min | 1.5 | 3.0 | 3.7 | 4.9 |
| Molecular ion | [M − H]− | [M − 2H]−˙ | M−˙ | M−˙ |
| SIM ions, m/z | 429.4 | 862.8 | 794.7 | 862.8 |
| MS2 | — | 863 → 848 | 795 → 780 | 863 → 848 |
Oxidation procedure
Air oxidation of CoQ10H2 by oxygen has been performed by air bubbling of the serum extract and by air exposure during a solid phase extraction procedure.18 We have tested both procedures on standard solutions of CoQ10H2 in methanol obtained by reduction of CoQ10 by NaBH4. Air purging for 15 min of a clear solution of CoQ10H2 (0.86 µg ml−1) in methanol did not develop the visible yellow colour of CoQ10 as expected. Careful quantitative analysis by UV, LC-UV and LC-MS of the solution before and after air oxidation showed that the CoQ10H2 had disappeared and only 10–20% of the expected CoQ10 concentration was found, based on the initial CoQ10H2 concentration. Instead 1,4-benzoquinone (BQ) (E0BQ/BQH2 = +0.29 V vs. NHE, pH = 7)27 and 2,3-dichloro-5,6-dicyano-1,4-benzoquinone (DDQ) (E0DDQ/DDQH2 = +0.84 V vs. NHE, pH = 7)28 were tested as possible oxidation agents. As seen from Table 2, relatively small concentrations of 1,4-benzoquinone (0.2 mg ml−1 = 0.2 mM) transformed the serum content of CoQ10H2 quantitatively to CoQ10 (E0CoQ10/CoQ10H2 = +0.097 V vs. NHE, pH = 7)29 in less than 15 min without oxidizing the vitamin E. (Eoxα-Tocopherol = +0.36 V vs. NHE, pH = 7).30 A first order rate constant kobs = 4.6 s−1 was obtained for the oxidation of a hydroquinone substituted with one triazolium and three methyl groups by a 1 mM solution of 1,4-benzoquinone at pH = 5.31 CoQ10H2 is somewhat easier to oxidize than triazoliumhydroquinone (E0 = +0.22 V) and the rate of oxidation of CoQ10H2 by 1,4-benzoquinone with the serum concentration of 0.2 mM is expected to be higher than kobs > 1/5 × 4.6 s−1 ≈ 1 s−1. Complete oxidation of CoQ10H2 by 1,4-benzoquinone (0.2 mM) is therefore expected to be complete after 10–20 s. The driving force of the oxidation of vitamin E by BQ is slightly uphill, explaining why the observed oxidation rate of vitamin E by BQ is negligible. DDQ is a stronger oxidant than BQ by nearly 0.5 V and oxidized both CoQ10H2 and vitamin E instantaneously.| Oxidant | [Ox]/mM | Reaction time/min | [CoQ10]/µg ml−1 |
|---|---|---|---|
| a Air bubbling through the serum extract.b Air oxidation during solid phase extraction of the serum extract.c BQ = 1,4-benzoquinone.d DDQ = 2,3-dichloro-5,6-dicyano-1,4 benzoquinone. | |||
| O2, aira | Saturated | 15 | <0.1 |
| O2, airb | Saturated | 15 | <0.1 |
| BQc | 0.2 | 5 | 0.97 |
| BQ | 0.2 | 10 | 0.72 |
| BQ | 0.2 | 15 | 0.75 |
| BQ | 0.2 | 60 | 0.74 |
| DDQd | 0.2 | 60 | 0.74 |
Validation of the LC-MS methods
The slope of the internal standard curve is equal to the response factor of CoQ10 relative to CoQ9 and, as expected, the response factor is close to one. During a 6 month period the average response factor RCoQ10/RCoQ9 = 1.08 ± 0.12 was obtained. The limit of detection (LOD) was found to be 10 pg injected on column which is similar to the reported LOD = 5 pg for the LC-ECD technique.16 LOD was obtained by increasing dilutions of a standard solutions of CoQ10 until the peak height was 3 times higher than the average noise level. Limit of quantification (LOQ) was 20 pg injected on column (10 × noise level). The sensitivity of the MS detector is therefore comparable to that of the electrochemical detector. The external standard curve is linear (r2 = 0.999) in the concentration interval 0–100 ng ml−1. The slope of the external standard curve, however, may vary from day to day depending on the performance of the instrument. During a 6 month period, a slope variation of 44% was observed. Quantification by the external standardization is therefore advisable only if the standard curve is obtained immediately before every series of analyses.
| Analytical method | Quantification method | [CoQ10]/µg ml−1 non-suppa | [CoQ10]/µg ml−1 suppb |
|---|---|---|---|
| a Serum sample taken from a person who did not get a supplement of CoQ10.b Serum sample from a person with an oral supplement of 150 mg CoQ10 per day for 30 days.c Average of four serum samples. IS = internal standard method.d Standard deviation of mean (SEM) for four concentrations.e Every row in the Table represents the analysis of new serum samples extracted on different days.f Spiking method. Four spiking levels.g Results obtained in the laboratory of Prof. Litterau, Ref. 23.h ES = external standard method. | |||
| LC-MS-SIM | ISc | 0.71 ± 0.05d | 1.91 ± 0.11 |
| LC-MS-SIMe | ISc | 0.74 ± 0.06 | 1.84 ± 0.12 |
| LC-MS2 | ISc | 0.76 ± 0.04 | 2.13 ± 0.07 |
| LC-MS-SIM | Spikingf | 0.70 | 1.97 |
| LC-MS2 | Spikingf | 0.73 | — |
| Average LC-MS methods | 0.73 ± 0.02 | 1.96 ± 0.11 | |
| LC-ECD | ISc | 0.72 | 1.52 |
| Reference lab.g (LC-UV) | ESh | 0.70 | 1.90 |
The S/N of the LC-MS2 method is approximately 25 times higher than the LC-MS-SIM method and LC-MS2 is therefore expected to be the most reliable and accurate method especially for low CoQ10 serum concentrations. The precision of the spiking method with 3–4 standard additions seems to be slightly better than the precision of the internal standard method applied to triplicate serum samples (see Table 3). In conclusion the spiking method combined with LC-MS2 detection is the best method for total CoQ10 measurements in human serum.
Comparison between the LC-MS and LC-ECD
The main advantage of the ECD coulometric detector is the constant and equal response factor for CoQ9 and CoQ10 while the response factor obtained by the MS detector may vary slightly from day to day (<10%). The price of the ECD detector is approximately 1/3 of the MS detector and the choice of method for total CoQ10 measurements should therefore be obvious. However, the MS detector is more selective than ECD, which is demonstrated by a comparison of Fig. 4 with Fig. 2d and Fig. 3. Fig. 4 shows the chromatogram of a reference serum sample (supp) obtained by LC-ECD (upper trace), and a 1:1 standard solution of CoQ9 and CoQ10 (lower trace). The signal to noise of the standard in Fig. 4 is very high (S/N > 100); however some background bumps near the CoQ9 peak are typically observed in the chromatograms of serum samples, which may disturb the integration procedure. Such problems are not observed by the LC-MS methods (Fig. 2d and Fig. 3) and this demonstrates that the selectivity of the LC-MS-SIM and LC-MS2 methods is superior to the LC-ECD even though the sensitivity of the LC-ECD method for pure standards is slightly higher than the LC-MS-SIM procedure and comparable with the LC-MS2 method. The LC-UV method used by Mosca et al.21 requires four times more serum sample (200 µl) and 20 times higher injection volume (200 µl) compared with the LC-MS. The main disadvantage, however, of the LC-UV method is the high background and low S/N ratios of the CoQ10 signal.![Upper trace: LC-ECD chromatogram of a supp serum extract. Lower trace: LC-ECD of a standard sample of a 1:1 mixture of CoQ9 and CoQ10. [CoQ9]
= 46.25 ng ml−1 in both samples.](/image/article/2004/AN/b308690a/b308690a-f4.gif) | ||
| Fig. 4 Upper trace: LC-ECD chromatogram of a supp serum extract. Lower trace: LC-ECD of a standard sample of a 1:1 mixture of CoQ9 and CoQ10. [CoQ9] = 46.25 ng ml−1 in both samples. | ||
Detection of CoQ10H2
If the 1,4-benzoquinone addition is omitted in the extraction procedure and the methanol is carefully purged with argon it is possible to obtain both the CoQ10H2 and CoQ10 serum concentrations. Experiments in our laboratory and by Kaikkonien et al.17 show that the CoQ10H2 is reasonably stable in the methanol solution for approximately 2 h at room temperature and simultaneous detection of both CoQ10 and CoQ10H2 should therefore be feasible with the two LC-MS methods. Fig. 5 shows a typical LC-MS-SIM chromatogram of a non benzoquinone treated serum extract in which CoQ10H2 is nicely eluted after 3.0 min just before the CoQ9 peak (3.7 min). The MS spectrum of CoQ10H2 was found to be identical to that of CoQ10, and CoQ10H2 is therefore apparently oxidized to CoQ10 during the passage through the APCI interface to the ion trap. A similar observation was recently noticed for other hydroquinones.32 During a 6 month period the response factor of CoQ10H2 relative to CoQ9 was found to vary between 0.25 and 0.55. This relative large variation in the response factor means that the accuracy of the CoQ10H2 determination is less reliable. In order to obtain precise CoQ10H2 quantification by APCI(−)-MS it is necessary to convert CoQ10H2 to CoQ10 after the elution from the column. This may be accomplished by means of a single electrochemical flow cell inserted between the column and the MS detector similar to the instrumentation described recently by Diehl et al.33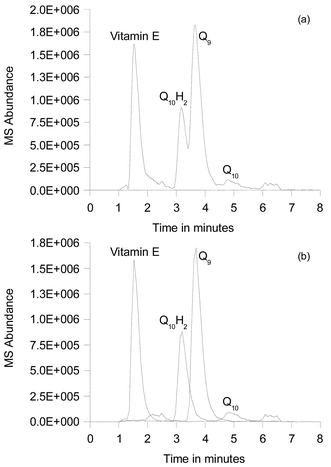 | ||
| Fig. 5 LC-MS-SIM analysis of a serum extract that has not been treated with 1,4-benzoquinone. (a) shows the total ion chromatogram and (b) shows the extracted ion chromatogram for vitamin E, CoQ10H2, CoQ9 and CoQ10. | ||
Conclusion
LC-APCI(−)-MS-SIM and LC-APCI(−)-MS2 are found to be very efficient methods for quantification of total CoQ10 in small volumes (50 µl) of human serum. The selectivity of both methods is much better than LC-ECD and LC-UV with less interference from other serum components, and the sensitivity obtained by the injection of pure CoQ10 standards is comparable with LC-ECD with a LOD = 10 pg injected on column. The high sensitivity and selectivity of the LC-MS methods were attributed to an efficient formation of [CoQ10]−˙ radical anions at the negative corona needle by an electron capture mechanism. The S/N was improved 25 times by the application of MS2 ion filtration relative to SIM and MS2 is therefore the best choice especially for serum analysis of patients with low CoQ10 serum concentration. A simple and fast serum pre-treatment procedure was developed, in which the serum CoQ10H2 content was oxidised quantitatively to CoQ10 in less than 15 min by 1,4-benzoquinone. The new LC-MS methods have been demonstrated to be very robust with a possible high sample throughput by a skilled technician of 40 serum samples in triplicate per day.References
- B. Halliwell and J. M. C. Gutteridge, Free Radicals in Biology and Medicine, Oxford University Press, 3rd edn., 1999 Search PubMed.
- P. J. Quinn, in Coenzyme Q: Molecular Mechanisms in Health and Disease, ed. V. E. Kagan and P. J. Quinn, CRC Press, 2000, pp. 29–42 Search PubMed.
- C. Morisco, B. Trimarco and M. Condorelli, Clin. Invest., 1993, 71, 134–136 Search PubMed.
- S. A. Mortensen, S. Vadhanavikit and K. Folkers, Drugs Exp. Clin. Res., 1984, X, 497 Search PubMed.
- Y. Hanaki, S. Sugiyama, T. Ozawa and M. Ohno, N. Engl. J. Med., 1991, 325, 814–815 CAS.
- T. Kamikawa, A. Kobayashi, T. Yamashita, H. Hayashi and N. Yamazaki, Am. J. Cardiol., 1985, 56, 247–251 CAS.
- R. Laaksonen, M. Fogelholm, J. J. Himberg, J. Laakso and Y. Salorinne, Eur. J. Appl. Physiol., 1995, 72, 95–100 Search PubMed.
- T. Okamoto, Y. Fukunaga, Y. Ida and T. Kishi, J. Cromatogr., 1988, 430, 11–19 Search PubMed.
- S. Yamashita and Y. Yamamoto, Anal. Biochem., 1997, 250, 66–73 CrossRef CAS.
- J. Lagendijk, J. B. Ubbink and W. J. H. Vermaak, J. Lipid Res., 1996, 37, 67–75 Search PubMed.
- P. O. Edlund, J. Chromtogr., 1988, 425, 87–97 Search PubMed.
- B. Finckh, A. Kontush, J. Commentz, C. Hübner, M. Burdelski and A. Kohlschütter, Methods Enzymol., 1996, 299, 341–348 CrossRef.
- P. H. Tang, M. V. Miles, A. DeGrauw, A. Hershey and A. Pesche, Clin. Chem., 2001, 47, 256–265 CAS.
- T. Menke, P. Niklowitz, S. Adam, M. Weber, B. Schlüter and W. Andler, Anal. Biochem., 2000, 282, 209–217 CrossRef CAS.
- M. Podda, C. Weber, M. G. Traber and L. Packer, J. Lipid Res., 1996, 37, 893–901 Search PubMed.
- M. Morita and K. Folkers, Biochem. Biophys. Res. Commun., 1993, 191, 950–954 CrossRef CAS.
- J. Kaikkonen, K. Nyyssönen and J. T. Salonen, Scand. J. Clin. Lab. Invest., 1999, 59, 457–466 CrossRef CAS.
- G. Grossi, A. M. Bargossi, P. L. Fiorella and S. Piazzi, J. Chromatogr., 1992, 593, 217–226 CrossRef CAS.
- K. Muratsu, J. Komorowski, S. Zong-xuan and K. Folkers, BioFactors, 1988, 1, 157–159 Search PubMed.
- S. Vadhanavikit, N. Sakamoto, N. Ashida, T. Kishi and K. Folkers, Anal. Biochem., 1984, 142, 155–158 CAS.
- F. Mosca, D. Fattorini, S. Bompadre and G. P. Littarru, Anal. Biochem., 2002, 305, 49–54 CrossRef CAS.
- C. A. Lytle, Y. D. M. Gan, K. Salone and D. C. White, Environ. Microbiol., 2001, 3, 265–272 Search PubMed.
- Prof. G. P. Litterau, Institute of Biochemistry, University of Ancona, Italy.
- P. Mattila, M. Lehtonen and J. Kumpulainen, J. Agric. Food Chem., 2000, 48, 1229–1233 CrossRef CAS.
- H. Hayen, N. Jachmann, M. Vogel and U. Karst, Analyst, 2002, 127, 1027 RSC.
- A. L. Farragher and F. M. Page, Trans. Faraday Soc., 1966, 62, 3072–3080 RSC.
- M. Catherine Depew and J. K. S. Wan, in The Chemistry of Quinoid Compounds, ed. S. Patai and Z. Rappoport, John Wiley & Sons Ltd, 1998, vol. II, ch. 16, pp. 961–1015 Search PubMed.
- M. E. Peover, J. Chem. Soc., 1962, 4540–4549 RSC.
- O. S. Ksenzhek, S. A. Petrova and M. V. Kolodyazhny, Bioelectrochem. Bioenerg., 1982, 9, 167–74 CrossRef CAS.
- L. I. Smith, L. J. Spillane and I. M. Kolthoff, J. Am. Chem. Soc., 1942, 64, 447–451 CrossRef CAS.
- M. P. Youngblood, J. Am. Chem. Soc., 1985, 107, 6987–6992 CrossRef CAS.
- T. Letzel, U. Pöschl, E. Rosenberg, M. Grasserbauer and R. Niessner, Rapid Commun. Mass Spectrom., 1999, 13, 2468–2468 CrossRef CAS.
- G. Diehl, A. Liesener and U. Karst, Analyst, 2001, 126, 288–290 RSC.
| This journal is © The Royal Society of Chemistry 2004 |