Non-steady-state kinetic study of the SN2 reaction between p-nitrophenoxide ion and methyl iodide in aprotic solvents containing water. Evidence for a 2-step mechanism
Yun
Lu
,
Kishan L.
Handoo
and
Vernon D.
Parker
*
Department of Chemistry and Biochemistry, Utah State University, Logan, Utah 84322, USA
First published on 8th November 2002
Abstract
Non-steady-state kinetic studies reveal that the SN2 reaction between p-nitrophenoxide ion and methyl iodide in acetonitrile containing water follows a 2-step mechanism involving the formation of a kinetically significant intermediate.
Introduction
We report the results of non-steady-state kinetic studies of the SN2 reactions of methyl iodide with p-nitrophenoxide ion in acetonitrile containing varying amounts of water. The extent of reaction–time profiles for these reactions deviate significantly from those expected for the classical single-step displacement of iodide ion by the nucleophile. The kinetic data are consistent with the reversible consecutive second-order mechanism [eqn. (1)]. | (1) |
In recent years the emphasis of studies of the SN2 reactions of alkyl halides with nucleophiles has shifted from reactions in solution1–3 to gas-phase reactions.4–6 In solution, the generally accepted mechanism for the classical SN2 reactions of methyl iodide with nucleophiles involves a single transition state between reactants and products,7 and the most recent studies have been directed toward adding detailed knowledge of the factors affecting the structure of the transition state. To the best of our knowledge, experimental data have not been presented which questions the single step mechanism for the reactions of alkyl halides with nucleophiles in solution.
The reactions of various methyl derivatives with phenoxide ion have been compared to those of p-nitrophenoxide ion in sulfolane solution.8 The selectivity, defined as the ratio of rate constants for the reactions of phenoxide to that of p-nitrophenoxide, was observed to increase from 2.8 for reaction with (CH3)3O+ to 28 for reaction with CH3I. No deviations from the classical SN2 mechanism were reported.
Our recent work employing non-steady-state kinetic measurements has shown that previously undetected kinetically significant intermediates are involved in a number of organic reactions including proton transfer reactions of arylmethyl radical cations,9–11 the proton transfer reaction between a nitroalkane and hydroxide ion,12,13 a hydride transfer reaction of an NADH model compound14 and the Diels–Alder reaction between anthracene and tetracyanoethylene.15 The purpose of the work reported here was to attempt to obtain data which implicate a kinetically significant intermediate in the classical SN2 reaction between methyl iodide and a nucleophile. The latter reaction has long been considered the prototype for single-step concerted reaction mechanisms.
Results and discussion
There are three experimental observations characteristic of the reversible consecutive second-order mechanism [eqn. (1)] which effectively serve to differentiate it from the irreversible second-order mechanism [eqn. (2)] for reactions that are not accompanied by significant primary kinetic isotope effects. These are (a) extent of reaction–time profiles that differ significantly from that expected for mechanism (2), (b) initial rate constants (kinit), which are significantly larger (if reactant decay is monitored) or significantly smaller (if formation of product is monitored) than the apparent pseudo first-order rate constants (kpfo) measured at longer times and (c) the ratio of times necessary to reach an extent of reaction equal to 0.50 and that required to reach extent of reaction equal to 0.05 (t0.50/t0.05) which are either significantly greater than 13.5 (reactant monitored) or less than 13.5 (product monitored). For reactions following mechanism (2), kinit/kpfo values are predicted to be equal to 1.00 and t0.50/t0.05 values are expected to be equal to 13.5. The latter are also the limiting values for the mechanism probes for mechanism (1) under conditions where the two mechanisms are kinetically indistinguishable. | (2) |
The experimental data summarized in Table 1 were derived from stopped-flow absorbance–time curves in which absorbance due to p-nitrophenoxide at 420 nm was monitored. The data are inconsistent with the irreversible second-order mechanism for the SN2 reaction between p-nitrophenoxide ion and methyl iodide. In all cases, kinit/kpfo are significantly greater than unity and t0.50/t0.05 are significantly greater than 13.5. On the other hand, the values of the mechanism probes suggest that the data are consistent with the reversible consecutive second-order mechanism (2).
| v/v % Water | [MeI]/M | 103kinit/s−1 | 103kpfo/s−1 | k init/kpfo | t 0.50/t0.05 |
|---|---|---|---|---|---|
| a The data in each line were derived from the average of 20–40 extent of reaction–time profiles processed from digitally smoothed absorbance (420 nm) – time data (2000 points) generated with either a Hi-Tech model SF-61 or SF-62 stopped-flow instrument. Extent or reaction defined as (1 − [ArO−]/[ArO−]o) where Ar is p-nitrophenyl. The numbers in parentheses are the standard deviations (σ) for all measurements. | |||||
| 0.04 | 2 | 15.6(1.6) | 14.0(0.8) | 1.11(0.06) | 15.0(0.8) |
| 1 | 8.50(0.61) | 7.06(0.13) | 1.20(0.08) | 16.1(1.0) | |
| 0.5 | 4.50(0.40) | 3.29(0.10) | 1.37(0.13) | 18.1(1.6) | |
| 0.6 | 2 | 7.35(0.42) | 5.61(0.41) | 1.31(0.15) | 17.1(1.9) |
| 1 | 3.51(0.18) | 2.79(0.17) | 1.26(0.09) | 16.8(1.1) | |
| 0.5 | 1.86(0.03) | 1.40(0.12) | 1.33(0.08) | 17.7(1.0) | |
| 2.0 | 2 | 3.00(0.17) | 1.71(0.04) | 1.75(0.09) | 22.7(1.2) |
| 1 | 1.20(0.17) | 0.816(0.023) | 1.47(0.18) | 19.3(2.3) | |
| 0.5 | 0.501(0.08) | 0.432(0.010) | 1.16(0.17) | 15.6(2.0) | |
The conclusions expressed in the previous paragraph are strongly reinforced by extent of reaction–time profiles shown in Fig. 1 (0.04 v/v % water), Fig. 2 (0.6 v/v % water) and Fig. 3 (2 v/v % water). In all three figures the experimental data are indicated with solid circles, the theoretical best-fit data (mechanism 1) are shown as solid lines and the response expected for the concerted SN2 (mechanism 2) are represented by the lower lines. The uniformly excellent fit between experimental data and theoretical data for mechanism (1) is the outstanding feature in all three figures. This is contrasted by the large deviations shown between the experimental data and the theoretical lines for mechanism (2).
![Extent of reaction–time profiles for the reactions of p-nitrophenoxide in acetonitrile containing water (0.04 v/v %). The ● represent experimental data, the solid lines describe theoretical data calculated assuming mechanism (1) and the lower lines in each set are theoretical data calculated assuming mechanism (2). [MeI] are indicated on the figure.](/image/article/2003/OB/b208635b/b208635b-f1.gif) | ||
| Fig. 1 Extent of reaction–time profiles for the reactions of p-nitrophenoxide in acetonitrile containing water (0.04 v/v %). The ● represent experimental data, the solid lines describe theoretical data calculated assuming mechanism (1) and the lower lines in each set are theoretical data calculated assuming mechanism (2). [MeI] are indicated on the figure. | ||
![Extent of reaction–time profiles for the reactions of p-nitrophenoxide in acetonitrile containing water (0.6 v/v %). The ● represent experimental data, the solid lines describe theoretical data calculated assuming mechanism (1) and the lower lines in each set are theoretical data calculated assuming mechanism (2). [MeI] are indicated on the figure.](/image/article/2003/OB/b208635b/b208635b-f2.gif) | ||
| Fig. 2 Extent of reaction–time profiles for the reactions of p-nitrophenoxide in acetonitrile containing water (0.6 v/v %). The ● represent experimental data, the solid lines describe theoretical data calculated assuming mechanism (1) and the lower lines in each set are theoretical data calculated assuming mechanism (2). [MeI] are indicated on the figure. | ||
![Extent of reaction–time profiles for the reactions of p-nitrophenoxide in acetonitrile containing water (2.0 v/v %). The ● represent experimental data, the solid lines describe theoretical data calculated assuming mechanism (1) and the lower lines in each set are theoretical data calculated assuming mechanism (2). [MeI] are indicated on the figure.](/image/article/2003/OB/b208635b/b208635b-f3.gif) | ||
| Fig. 3 Extent of reaction–time profiles for the reactions of p-nitrophenoxide in acetonitrile containing water (2.0 v/v %). The ● represent experimental data, the solid lines describe theoretical data calculated assuming mechanism (1) and the lower lines in each set are theoretical data calculated assuming mechanism (2). [MeI] are indicated on the figure. | ||
The procedure for fitting experimental and theoretical data13 involves systematically increasing kf from the apparent rate constant evaluated in the conventional manner (kapp) and at each kf varying kp until the best fit is found at the particular kf. The input files for the fitting program consisted of extent of reaction–time profiles for all three concentrations of methyl iodide and the iterations of rate constants were applied concurrently for all three data sets. The relationships between the various rate constants for mechanism (1) are given by eqn. (3) which is derived for the mechanism under steady-state conditions. The integrity of the fits between experimental and theoretical data are illustrated in Fig. 4 for reactions carried out in acetonitrile containing either 0.04 v/v %
(a), 0.6 v/v %
(b) or 2 v/v %
(c) water. The lower limit of kf is defined to be equal to kapp from the relationship in eqn. (3). The left-hand end of each plot corresponds to kf
= 1.05kapp. The minima of the plots of (% deviation/point)
vs. kf define the best-fit values of the latter. The steeper the curves descend to the minima, the smaller the fitting error. Each curve in Fig. 4 represents theoretical data for 50 kf values with 50 kp values applied in order to arrive at the best-fit at each kf for a total of 2![[thin space (1/6-em)]](https://www.rsc.org/images/entities/char_2009.gif) 500 calculations for each line.
500 calculations for each line.
| kapp = kfkp/(kp + kb) | (3) |
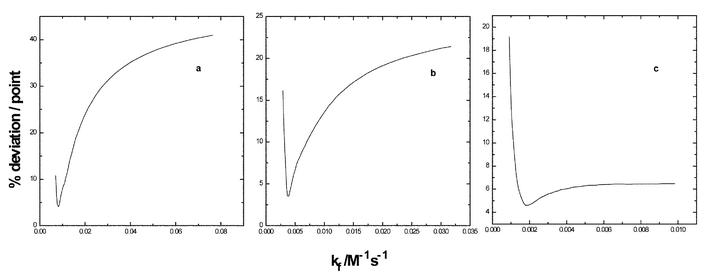 | ||
| Fig. 4 Illustrations of the procedure for fitting experimental to theoretical data for reactions in acetonitrile containing 0.04 (a), 0.6 (b) or 2.0 v/v % (c) water. | ||
The best-fit rate constants for the SN2 reactions at various water concentrations are summarized in Table 2. The magnitude of kapp decreases by a factor of about 7.4 as the water content is increased from 0.04 to 2 v/v %. The same trend is reflected in the kf values but in this case the rate constants decrease by only a factor of 4.5. The rate constant for the product forming step increased slightly as the water content was increased. The changes in kb are less significant since the best-fit values are obtained by finding optimal values of kf and kp resulting in disproportionate fitting errors in kb. The SN2 reactions were a central feature of the classic studies of protic-dipolar aprotic solvent effects on the rates of bimolecular organic reactions.16
| v/v % water | k app/M−1 s−1b | k f/ M−1 s−1c | k p/s−1d | k b/s−1e |
|---|---|---|---|---|
| a Reactions at 298.2 K, [MeI] = 2, 1, 0.5 M, [p-Nitrophenoxide]o = 0.00006 M. b Experimental value evaluated from t0.50 and refined in the fitting procedure. c Best-fit value obtained during the fitting procedure. d Best-fit value obtained during the fitting procedure. e Value calculated from eqn. (3) assuming the values of the other rate constants. | ||||
| 0.04 | 0.00644 | 0.00819 | 0.0150 | 0.00408 |
| 0.6 | 0.00284 | 0.00383 | 0.0164 | 0.00571 |
| 2.0 | 0.000874 | 0.00182 | 0.0193 | 0.0289 |
The SN2 reaction has been under intensive study for the past half-century. Many of the results prior to about 1990 have been reviewed in a monograph devoted to that topic.7 In solution the reaction coordinate is invariably represented as a single transition state between reactants and products that corresponds to the concerted bond breaking–bond formation process. In the gas phase, the reaction coordinate is represented as a double potential energy well system in which the association complex is at lower energy than reactants and the reaction barrier corresponds to the conversion of the association complex to products. The results presented here suggest that essentially the same mechanism takes place in solution as in the gas phase and that the primary difference in the two cases is the relative energies of reactants and the association complex. Formation of the latter in the gas phase is a barrier free process whereas there is a distinct barrier in solution. Further non-steady-state kinetic studies are required to confirm the generality of the 2-step SN2 mechanism in solution.
Conclusions
The results of our non-steady-state kinetic investigation of the SN2 reaction between p-nitrophenoxide ion and methyl iodide in aqueous acetonitrile force the conclusion that the classical formulation of the SN2 mechanism with a single transition state in which the central carbon atom undergoes concerted bond formation to the incoming nucleophile simultaneously with cleavage of the bond to the leaving group is not correct for this reaction. The consequence of the fact that the reaction coordinate must be represented with two transitions states is that any conclusions based on experimental data assuming that the apparent rate constants correspond to the free energy of activation for a single transition state require modification.Acknowledgements
We gratefully acknowledge the National Science Foundation (CHE-0074405) for support of this work.References
- T. Koerner, Y.-R. Fang and K. C. Westaway, J. Am. Chem. Soc., 2000, 122, 7342–7350 CrossRef CAS.
- G. C. Davico and V. M. Bierbaum, J. Am. Chem. Soc., 2000, 122, 1740–1748 CrossRef CAS.
- Y. Kondo, H. Takezama, T. Katsura, S. Nakanishi and X. Chen, J. Chem. Soc., Perkin Trans. 2, 2002, 77–82 RSC.
- J. Ren and J. I. Brauman, J. Phys. Chem. A, 2002, 106, 3804–3813 CrossRef CAS.
- A. A. Viggiano, S. T. Arnold, R. A. Morris, A. F. Ahrens and P. M. Hierl, J. Phys. Chem., 1996, 100, 14397–14402 CrossRef CAS.
- S. T. Graul, C. J. Carpenter, J. E. Bushnell, P. A. M. van Koppen and M. T. Bowers, J. Am. Chem. Soc., 1998, 120, 6785–6796 CrossRef CAS.
- S. S. Shaik, H. B. Schlegel, and S. Wolfe, Theoretical Aspects of Physical Organic Chemistry, The SN2 Mechanism; Wiley, New York, 1992 Search PubMed.
- E. S. Lewis and S. Vanderpool, J. Am. Chem. Soc., 1977, 99, 1946–1949 CrossRef CAS.
- V. D. Parker, Y. Zhao, Y. Lu and G. Zheng, J. Am. Chem. Soc., 1998, 120, 12720–12727 CrossRef CAS.
- Y. Lu, Y. Zhao and V. D. Parker, J. Am. Chem. Soc., 2001, 123, 5900–5907 CrossRef CAS.
- Y. Zhao, Y. Lu and V. D. Parker, J. Chem. Soc., Perkin Trans. 2, 2001, 1481–1487 RSC.
- Y. Zhao, Y. Lu and V. D. Parker, J. Am. Chem. Soc., 2001, 123, 1579–1586 CrossRef CAS.
- V. D. Parker and Y. Zhao, J. Phys. Org. Chem., 2001, 14, 604–611 CrossRef CAS.
- Y. Lu, Y. Zhao, K. L. Handoo and V. D. Parker, Org. Biomol. Chem., 2003, 1 (DOI: 10.1039/b208186e) Search PubMed.
- K. L. Handoo, Y. Lu and V. D. Parker, submitted for publication.
- A. J. Parker, Chem. Rev., 1969, 69, 1–32 CrossRef.
| This journal is © The Royal Society of Chemistry 2003 |