DNA recognition by the anthracycline antibiotic respinomycin D: NMR structure of the intercalation complex with d(AGACGTCT)2
Received
3rd September 2002
, Accepted 1st November 2002
First published on 5th December 2002
Abstract
Respinomycin D is a member of the anthracycline family of antitumour antibiotics that interact with double stranded DNA through intercalation. The clinical agents daunomycin and doxorubicin are the most well-studied of this class but have a relatively simple molecular architecture in which the pendant daunosamine sugar resides in the DNA minor groove. Respinomycin D, which belongs to the nogalamycin group of anthracyclines, possesses additional sugar residues at either end of the aglycone chromophore that modulate the biological activity but whose role in molecular recognition is unknown. We report the NMR structure of the respinomycin D–d(AGACGTCT)2 complex in solution derived from NOE restraints and molecular dynamics simulations. We show that the drug threads through the DNA double helix forming stabilising interactions in both the major and minor groove, the latter through a different binding geometry to that previously reported. The bicycloaminoglucose sugar resides in the major groove and makes specific contacts with guanine at the 5′-CpG intercalation site, however, the disaccharide attached at the C4 position plays little part in drug binding and DNA recognition and is largely solvent exposed.
Introduction
The anthracycline antibiotics represent a diverse group of potent chemotherapeutic agents that interact with double-stranded DNA.1–4 The molecular basis of their potent activity as anti-cancer drugs lies in their ability to inhibit transcription factor binding or interfere with topoisomerase activity through formation of a stable drug–DNA complex.5–7 Their molecular structures consist of an aglycone ring system capable of intercalating into the DNA helix. Daunomycin and doxorubicin, two of the most widely used clinically, have a simple architecture which places the pendant daunosamine sugar moiety in the DNA minor groove.8,9 In contrast, nogalamycin (Fig. 1) has carbohydrates at both ends of the aglycone ring system permitting the antibiotic to interact with the double helix in both the major and minor grooves once threaded through the DNA helix. Interactions in both grooves appear to enhance the binding affinity, but also produce slow binding kinetics as a consequence of the major structural disruption, or local melting of the helix, that is required for the association and dissociation events to occur.10 These properties have been linked to the potent activity of nogalamycin, but also to the higher levels of cytotoxicity than observed for other members of the anthracycline family.11
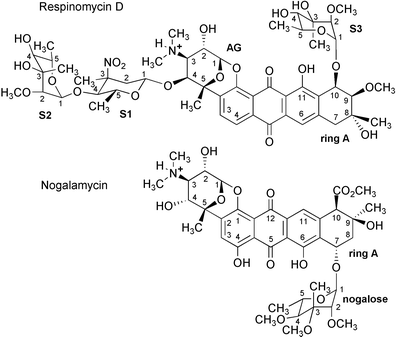 |
| | Fig. 1 Structures of respinomycin D and nogalamycin. The numbering scheme adopted is indicated with the sugar residues of the former labelled S1, S2 and S3 and AG for the aminoglucose sugar. The stereochemical information for nogalamycin is based on the X-ray data of Arora,24 while that of respinomycin is derived from the NMR data described previously by Ubukata et al.20–22 and in this work. | |
NMR and X-ray analysis of a number of nogalamycin–DNA complexes has revealed molecular details of the interaction.12–17 The pattern of substitution of sugar residues around the aglycone ring system gives nogalamycin a right-handed twisted geometry that complements that of the DNA helix. The highly methylated nogalose sugar lies within the minor groove interacting largely through hydrophobic contacts with the deoxyribose backbone. In contrast, the bicycloaminoglucose is hydrophilic with an N,N-dimethylammonium cation and hydroxy groups positioned close to the O6 and N7 of guanine in the major groove. These interactions appear to account for the specificity of binding to either 5′-TpG or 5′-CpG sites requiring an intact G–C basepair on the 5′-side of the intercalation site. Several other related anthracyclines, such as arugomycin,18 have been isolated that carry longer chains of sugar moieties, however, these all retain the same bicycloaminoglucose sugar, which, at least in the case of arugomycin, has been shown to interact with DNA in a similar fashion to nogalamycin. The role of the additional chains of sugars in DNA recognition and binding, and in modulating biological activity, has yet to be established. In an earlier NMR study with arugomycin, we reported the structure of a 2 ∶ 1 complex with the hexamer duplex d(GCATGC)2 in which two drug molecules are bound in symmetry related orientations, one at each of the TpG and CpA sites.19 The drug was shown to bind in a similar fashion to nogalamycin with the same DNA sequence, although the study was limited by the length of the duplex, which was unable to accommodate the long sugar chains of arugomycin within the grooves of the short helix.
More recently, the respinomycin family of antibiotics has been isolated from Streptomyces xanthocidicus.20–22 The aglycone skeleton, together with the bicycloaminoglucose sugar, resembles that of nogalamycin and relatives, but has some subtle structural differences (Fig. 1). The substitution pattern of the ring A sugar differs from that of its close relatives. A less hydrophobic sugar is attached to ring A at the C10 position rather than at C7, as found for nogalamycin. In contrast to nogalamycin, which has an hydroxy group at the C4 position that points towards the floor of the major groove in the DNA complex, arugomycin and the respinomycins are adorned with extra sugar residues through epimerisation at the C4 centre (Fig. 1). The biological activity of members of the respinomycin group differs according to the nature and number of sugar components attached to the aglycone framework.21 Oxidising the amino sugar of respinomycin A1 to a nitro sugar (respinomycin D) increases the cytotoxicity 30-fold, while having a 3-fold effect on rates of cell differentiation in human leukemia K562 cell lines. Though the carbohydrate components of these antibiotics clearly modulate biological activity their role in DNA recognition and binding has not been established.
In this paper we report the structure of the complex of respinomycin D with the octamer duplex d(AGACGTCT)2 in aqueous solution by 1H NMR spectroscopy. The drug forms a 1 ∶ 1 complex through intercalation at the single 5′-pyr-pur-3′
(5′-CpG) binding site at the centre of the sequence. NOE data unambiguously establish the position and orientation of the bound drug molecule, and show that the aglycone and bicycloaminoglucose sugar interact with the DNA through a similar subset of intermolecular interactions to those reported in an earlier NMR structure of nogalamycin with the same core sequence d(GACGTC)2.12 Thus, the two antibiotics share a common skeleton but differ in the position of a number of hydroxy substituents on the aglycone, and in the position and orientation of the various sugar components attached to ring A and the fused bicycloaminoglucose sugar. These structural features allow the drug to recognise the minor groove in a subtly different manor to nogalamycin.
Results and discussion
Conformation of respinomycin D
The isolation and determination of the covalent structure and physico-chemical properties of the respinomycins in organic solvents have previously been described.20–22 The antibiotics are soluble in aqueous solution at pH 5.0 and it is under these conditions that we have further investigated their structure and conformation by 1H NMR. A complete assignment was possible using 2D DQF-COSY, TOCSY, ROESY and NOESY data at 500 MHz.23 The structural and conformational analysis reported previously by Ubukata et al.,22 with the anomeric centres of S1, S2 and S3 assigned to β, α and α, respectively, are fully confirmed by NOE and coupling constant data from studies of the drug in aqueous solution. However, in addition to previously reported data, we have identified a number of inter-residue NOEs that have enabled us to establish the relative configurations of the various sugar units. The stereochemical information derived from studies of the free drug in aqueous solution is confirmed by NOE data in the drug–DNA complex, with additional configurational constraints that arise from satisfying drug–DNA NOE contacts. In this sense, the DNA duplex proved useful in resolving some aspects of the drug stereochemistry. As we show below, the drug intercalates at the 5′-CpG site of the octamer duplex d(AGACGTCT)2 with the bicycloaminoglucose sugar located in the major groove and interacting at the 5′-CpG site in a similar fashion to that observed for nogalamycin. This indicates that the stereochemistry of the bicycloaminoglucose ring system is identical in the two antibiotics and can be used as a common frame of reference for structural comparisons. This feature is also conserved in other members of the anthracycline family such as arugomycin.18 Modelling studies show that the orientation of the bicycloaminoglucose sugar with respect to the aglycone ring system plays an important part in establishing the right-handed twisted geometry of these antibiotics to match the twisted conformation of the DNA.
In Fig. 2a, we summarise the pattern of NOEs observed between S1 and S2, and between S1 (decilonitrose) and the aminoglucose (AG) ring system. The relative configuration of S1 and S2 is established on the basis of clear inter-residue NOEs. A strong interaction between S1 4-H and S2 1-H establishes the relative orientation of the two sugars. NOEs from S1 3-CH3 to S2 5-H, and from S1 5-CH3 to S2 2-H are consistent with the structure shown in Fig. 2a. NOEs between S1 and the AG sugar, as indicated by the arrows in Fig. 2, define the relative orientation as shown. In Fig. 2b, we illustrate the pattern of NOEs that define the relative orientation of S3 with respect to ring A, along with the structure of nogalamycin and the corresponding NOEs observed between ring A and the nogalose sugar. The latter are fully confirmed by the X-ray structure of nogalamycin reported by Arora.24 In both cases the sugar folds back over ring A forming hydrophobic interactions between the two. In the case of respinomycin D, the observed NOEs, together with some structural modelling, unambiguously determine the axial/equatorial orientation of the ring A substituents that are not readily resolved from the limited number of J-couplings. The NOEs from the ring A 8-CH3 to S3 3-CH3 and S3 5-H establish that the 8-CH3 is in an axial position on ring A. NOEs from 9-H also to S3 3-CH3 and S3 5-H establish that this proton must also be on the same face of ring A. No NOEs to S3 are observed from the 9-OCH3 group, which is also consistent with this group pointing down in an axial orientation, while a small 3J-value of < 2 Hz is observed between 9-H and 10-H on ring A. This configuration is further supported by a strong NOE from 9-H to S3 1-H. The NOEs observed for nogalamycin are virtually identical.
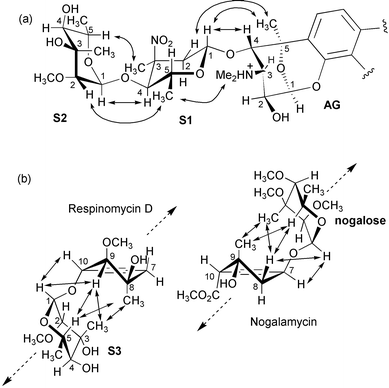 |
| | Fig. 2 (a) Schematic illustration of observed NOEs between the aminoglucose (AG) sugar and the pendant sugars S1 and S2 derived from 2D NOESY data (300 ms mixing time) of the drug in D2O solution (pH 5.0, 298K); (b) observed NOEs between ring A and S3 of respinomycin D from the same NOESY data set compared with data for nogalamycin collected under similar conditions; S3 and the nogalose sugar in the two antibiotics are attached on opposite faces of ring A but give an analogous pattern of NOEs. Arrows indicate the direction of the DNA minor groove. | |
The striking feature of the pattern of NOEs highlighted by Fig. 2b is that the two antibiotics achieved a similarly compact conformation despite the fact that the two sugars involved are located on opposite faces of ring A. While the nogalose sugar has been shown to bind in the minor groove of DNA, pointing upwards and away from ring A to match the right-handed twist of the DNA helix, it is equally apparent that respinomycin D may also achieve the same helical complementarity through its position and orientation on the lower face of ring A, retaining the necessary right-handed twist to lie along the minor groove (Fig. 3). These features are subsequently confirmed in the structural analysis of the DNA–drug complex.
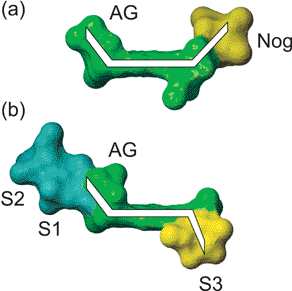 |
| | Fig. 3 Space filling representation of respinomycin D and nogalamycin demonstrating the relative orientation of the various sugar components with respect to the plane of the aglycone ring. In (a) AG and nogalose sugars are located on the same face of the aglycone; in (b) the AG and S3 sugars are on different faces “pointing” in opposite directions. Substitution of S3 at the C10 position of ring A and the nogalose at the C7 position (see Fig. 1) ensures that the right-handed twisted conformation is conserved. | |
Drug–DNA interactions in the complex with d(AGACGTCT)2
A large number of intermolecular NOEs are observed in the 1 ∶ 1 complex which have added considerable weight to the conformational analysis described above. NOEs between the various sugar components of respinomycin D confirm the structural features described above and also suggest that the conformation changes little on binding to DNA. The assignment of the 1H NMR spectrum of d(AGACGTCT)2 free and in the drug–DNA complex was established using a combination of 2D NMR experiments to map out sequential connectivities (Fig. 4a and 4b; see Table 1). The binding of the antibiotic at a single site lifts the two-fold symmetry of the octamer, as is evident by comparing Fig. 4a with 4b, giving a clean 1 ∶ 1 complex and NMR data of high quality (Fig. 4c). In the NOESY data of the complex we are able to identify all H6/H8↔H1′ intranucleotide and sequential connectivities with the exception of the sequential NOE at the C4↔G5 step (see Fig. 4b). The absence of this NOE together with perturbations to H1′ and H6/H8 chemical shifts (not shown), and subsequent NOE analysis, confirm the central CpG step as the intercalation site.
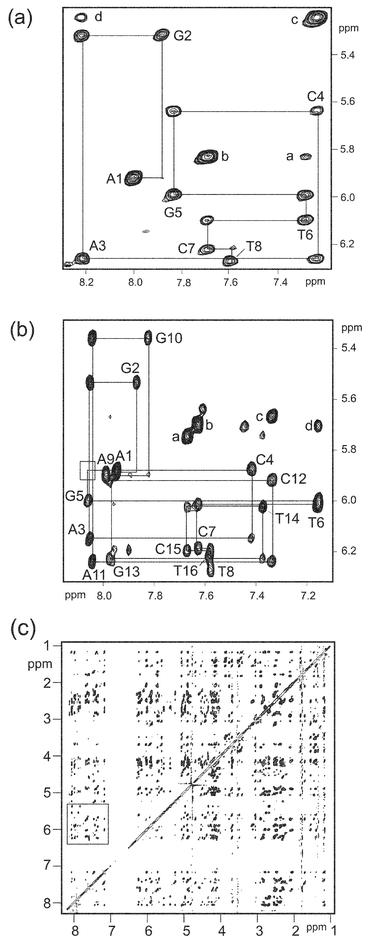 |
| | Fig. 4 2D NOESY data (300 ms mixing time) at 298 K in D2O of (a) free d(AGACGTCT)2 showing the base H6/H8 ↔ deoxyribose H1′sequential assignment pathway; intranucleotide NOEs are labelled according to position in the sequence (A1-G2-A3-C4-G5-T6-C7-T8); (b) same assignment pathway for the respinomycin D–d(AGACGTCT)2 complex; the bound drug lifts the dyad symmetry of the duplex such that the two strands are no longer equivalent. Each strand now has its own sequential assignment pathway with the two strands labelled A1-G2-A3-C4-G5-T6-C7-T8 and A9-G10-A11-C12-G13-T14-C15-T16. The box represents the position of the unobserved sequential connectivity between C4↔G5. Other peaks are labelled as follows: in (a) a, C7H5↔T6H6; b, C7H5↔C7H6; c, C4H5↔C4H6; d, C4H5↔A3H8, and in (b) a, C15H5↔C15H6; b, C7H5↔C7H6; c, C12H6↔AG-H1 d, C7H5↔T6H6. (c) NOESY data of the respinomycin D complex showing the large chemical shift dispersion; boxed region shown expanded in (b). | |
Table 1
1H Chemical shifts of d(AGACGTCT)2 free (a) and in the complex with respinomycin D (b); all data at 298 K and pH 7.0; nd = not determined, (c) respinomycin D 1H chemical shifts free (pH 5.0, 298 K) and bound (in parenthesis)
(pH 7.0, 298 K)
| (a) Free shifts |
| Residue |
H1′ |
H2′/H2″ |
H3′ |
H4′ |
H5′/H5″ |
H2/H5/CH3 |
H6/H8 |
| A1 |
5.91 |
2.35/2.53 |
4.80 |
4.18 |
3.66/3.66 |
8.01 |
7.96 |
| G2 |
5.32 |
2.72/2.72 |
4.99 |
4.34 |
4.07/4.07 |
— |
7.89 |
| A3 |
6.25 |
2.71/2.90 |
5.06 |
4.48 |
4.15/4.22 |
7.93 |
8.22 |
| C4 |
5.63 |
2.03/2.37 |
4.82 |
4.18 |
4.06/4.06 |
5.24 |
7.24 |
| G5 |
5.98 |
2.63/2.77 |
4.95 |
4.38 |
4.14/4.10 |
— |
7.84 |
| T6 |
6.09 |
2.12/2.49 |
4.88 |
4.22 |
4.10/4.10 |
1.41 |
7.29 |
| C7 |
6.21 |
2.33/2.52 |
4.87 |
4.24 |
4.12/4.12 |
5.82 |
7.70 |
| T8 |
6.26 |
2.32/2.32 |
4.57 |
4.10 |
4.11/4.11 |
1.78 |
7.60 |
| |
| (b) Bound shifts |
| Residue |
H1′ |
H2′/H2″ |
H3′ |
H4′ |
H5′/H5″ |
H2/H5/CH3 |
H6/H8 |
| A1 |
5.88 |
2.35/2.44 |
4.76 |
4.10 |
3.64/3.64 |
7.90 |
7.95 |
| G2 |
5.54 |
2.68/2.76 |
4.97 |
4.33 |
4.04/4.06 |
— |
7.87 |
| A3 |
6.15 |
2.47/2.83 |
5.01 |
4.37 |
4.21/4.21 |
7.90 |
8.05 |
| C4 |
5.89 |
2.25/2.31 |
4.91 |
4.27 |
nd |
5.23 |
7.42 |
| G5 |
6.00 |
2.70/2.79 |
5.05 |
4.52 |
4.23/4.18 |
— |
8.06 |
| T6 |
6.01 |
2.04/2.47 |
4.89 |
4.09 |
nd |
1.15 |
7.15 |
| C7 |
6.19 |
2.28/2.49 |
4.83 |
4.30 |
nd |
5.71 |
7.63 |
| T8 |
6.27 |
2.32/2.32 |
4.59 |
4.10 |
nd |
1.78 |
7.58 |
| A9 |
5.90 |
2.37/2.52 |
4.79 |
4.15 |
3.65/3.65 |
7.90 |
7.99 |
| G10 |
5.36 |
2.68/2.68 |
4.96 |
4.33 |
4.04/4.06 |
— |
7.82 |
| A11 |
6.24 |
2.53/2.86 |
5.03 |
4.43 |
4.18/4.18 |
7.90 |
8.04 |
| C12 |
5.92 |
2.36/2.36 |
4.99 |
4.15 |
nd |
4.82 |
7.34 |
| G13 |
6.23 |
2.42/2.81 |
4.88 |
4.49 |
4.24/4.30 |
— |
7.97 |
| T14 |
6.02 |
2.08/2.49 |
4.89 |
4.04 |
nd |
1.17 |
7.37 |
| C15 |
6.20 |
2.38/2.53 |
4.86 |
4.23 |
4.12/4.12 |
5.75 |
7.67 |
| T16 |
6.22 |
2.29/2.29 |
4.56 |
4.09 |
nd |
1.78 |
7.59 |
| |
| (c) Respinomycin D shifts (see Fig. 1 for numbering scheme) |
| S1 |
δ/ppm |
S2 |
δ/ppm |
S3 |
δ/ppm |
| 1-H |
5.74 (5.71) |
1-H |
5.04 (5.06) |
1-H |
5.56 (5.60) |
| 2′-H |
2.16 (2.10) |
2-H |
3.36 (3.41) |
2-H |
3.37 (3.05) |
| 2″-H |
2.87 (2.90) |
2-OMe |
3.48 (3.53) |
2-OMe |
3.66 (3.68) |
| 3-Me |
1.83 (1.82) |
3-Me |
1.17 (1.17) |
3-Me |
1.33 (1.40) |
| 4-H |
3.77 (3.76) |
4-H |
3.45 (3.45) |
4-H |
3.55 (3.53) |
| 5-H |
4.17 (4.16) |
5-H |
3.85 (3.86) |
5-H |
3.93 (3.87) |
| 5-Me |
1.44 (1.45) |
5-Me |
1.34 (1.34) |
5-Me |
1.43 (1.43) |
| |
| AG |
δ/ppm |
Ring A |
δ/ppm |
Aglycone |
δ/ppm |
| 1-H |
5.89 (5.67) |
7′-H |
3.11 (3.11) |
3-H |
7.53 (7.16) |
| 2-H |
4.63 (4.41) |
7″-H |
2.77 (2.50) |
4-H |
7.71 (7.44) |
| 3-H |
3.61 (4.13) |
8-Me |
1.44 (1.54) |
6-H |
7.07 (5.86) |
| 3-NMe |
3.07/3.07 (2.92/3.04) |
9-H |
3.60 (3.48) |
|
|
| 4-H |
4.87 (4.68) |
9-OMe |
3.68 (3.69) |
|
|
| 5-Me |
1.75 (1.71) |
10-H |
4.93 (4.89) |
|
|
The earlier studies of nogalamycin show that the bicycloaminoglucose sugar at one end of the aglycon, and the nogalose sugar at the other, are located on the same face of the molecule giving the molecule a “U” shape with these sugar substituents pointing in the same direction along the major and minor groove, respectively (Fig. 3). Our structural model of respinomycin D has the equivalent sugar residues attached to different faces of the aglycon such that we would expect them to point in opposite directions along the respective grooves. The pattern of intermolecular NOEs is completely consistent with this hypothesis. The intercalation site orientation is defined by a number of key NOEs: the aromatic 4-H is close to C4 H5, while contacts are observed between AG 1-H and C12 H5/H6 and H2′. The bicyclic sugar is located in the major groove such that weak NOEs are observed from the N,N-dimethylammonium group to T14 CH3. Interestingly, no NOEs are observed from the attached sugars S1 and S2 to any DNA protons in the major groove, suggesting little participation in direct binding interactions (see below). Numerous NOEs are observed from S3 to protons in the minor groove that confirm the orientation of this sugar. Hydrophobic contacts are observed, for example, from S3 3-CH3 to T6 H1′ and C7 H1′, and from S3 2-OCH3 to C12 H1′ and G13 H1′, confirming that the sugar lies along the groove pointing in the opposite direction to the aminoglucose sugar (Fig. 3). NOEs from 8-CH3 and 10-H on ring A to G5 H1′/H4′ and G13 H1′, respectively, confirm the orientation of the antibiotic with respect to the minor groove. NOEs from 9-OCH3 on ring A to G13 H1′ and T14 H1′, are consistent with its axial orientation on ring A, as discussed above (Fig. 2b). We identify 20 drug–DNA NOEs that define with some precision the various interactions in the major and minor grooves.
Structure calculations using NOE-restrained molecular dynamics simulations
NOE-based structure refinement was carried out over 500 ps of molecular dynamics simulation using an explicit solvation model within the AMBER suite of programs.25 The protocol has been outlined previously,26,27 and is summarised in methods. Stereo views of 50 structures, representing snapshots every 10 ps from the MD simulation, are shown in Fig. 5. The heavy atom RMSD with respect to the mean structure is 1.0 ± 0.2 Å, with a corresponding average NOE-restraint deviation of 0.02 ± 0.06 Å, showing that the NOE data is well satisfied by the final structures. A detailed analysis of helical parameters was performed using the programs CURVES28 and MOLMOL,29 and fluctuations in these parameters examined over the course of the MD simulation. For comparison purposes, we have carried out unrestrained MD simulations on the uncomplexed octamer duplex. Given that this is a rather short sequence of DNA, we confine our comparisons between free and bound largely to the central CpG intercalation site. Data for helical twist and base pair buckle are illustrated in Fig. 6, with error bars representing one standard deviation from the mean during the course of the dynamics simulation on the drug–DNA complex. Helical twist has a mean value of 36° in B-DNA and 32° in A-DNA, and values generally lie in this range. Although the drug intercalates at the CpG step, we do not observe a large degree of helix unwinding at this site, but typically at the adjacent sites. The distortions are by no means symmetrical in each strand. As observed in many other anthracycline–DNA complexes, there is a large buckling of base pairs at the intercalation site. This complex is no exception with values of +28° and −20° for the GC pairs in direct contact with the intercalated aglycone ring system, compared with ∼0° for the free duplex. The rationale for these distortions is to enable the DNA base pairs to optimise van der Waals contacts with the ligand by wrapping around the bound intercalator. Overall the DNA duplex retains its B-DNA-like conformation except where the structure is distorted at the intercalation site with both the major and minor groove expanding to accommodate the bound drug. Comparison between free and bound duplex shows that the groove widths measured from the Pi
−
Pj+3 distance between strands (where i and j are hydrogen bonded bases) increase by ∼9 Å
(13.9 Å to 23.1 Å) in the case of the major groove, and by ∼3 Å
(12.7 Å to 15.4 Å) in the case of the minor groove. Fig. 7 shows the respinomycin D intercalation site in greater stereochemical detail. Epimerisation at the C4 position of the aminoglucose sugar ensures that S1 and S2 extend away from the DNA into solution and are not involved in any direct interactions. The relative orientation of these sugars is well defined by inter-residue NOE data from studies of both the uncomplexed drug and when bound to DNA indicating that the extended conformation is largely pre-organised. In the complex further steric considerations preclude the possibility that the sugars can twist back into the major groove. Thus, no role of these sugars in DNA binding and recognition is evident from these studies.
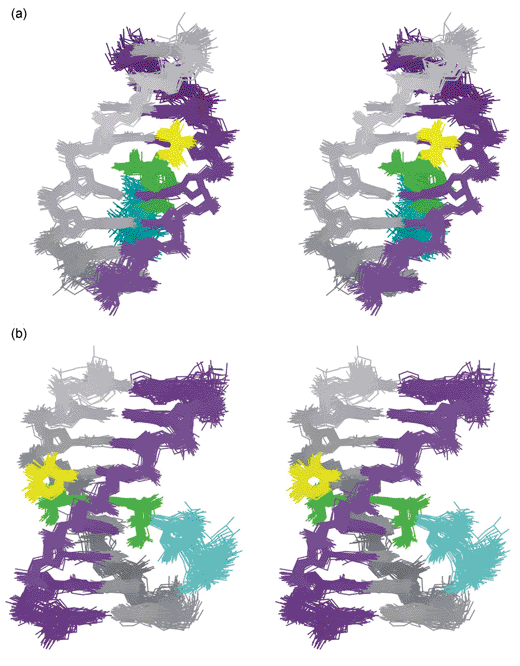 |
| | Fig. 5 Stereo pairs illustrating 50 NMR structures of the respinomycin D–d(AGACGTCT)2 complex (snap shots every 10 ps over 500 ps of restrained molecular dynamics)
(a) view into the major groove illustrating the geometry of the intercalation site; (b) view side-on showing the drug threading through the DNA helix with S3 (yellow) located in the minor groove and the S1–S2 disaccharide (blue) dangling in the major groove. | |
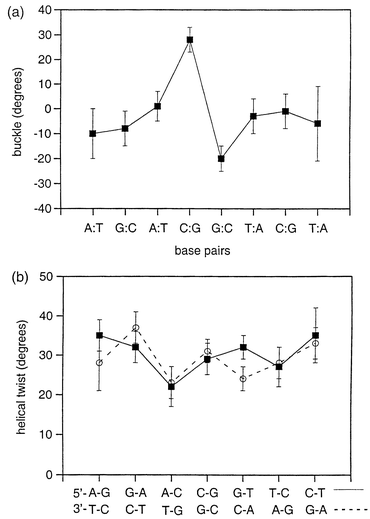 |
| | Fig. 6 CURVES28 analysis of the family of 50 structures shown in Fig. 5 illustrating the sequence-dependence of (a) buckle, and (b) helical twist. Error bars represent one standard deviation from the mean structure. | |
Intermolecular interactions in the respinomycin D–DNA complex
In previous studies, the C2 and C4 hydroxy groups on the bicycloaminoglucose sugar have been identified as key determinants of specificity for the TpG or CpG site on account of direct interactions with the N7 and O6 of guanine at the YpG intercalation site. In the case of respinomycin, epimerisation and substitution at the C4 position removes this hydroxy group, however, the C2–OH is unchanged and is directed to the floor of the major groove where it hydrogen bonds to the N7 of G13. In contrast, S3 located in the minor groove, forms largely hydrophobic contacts, as evident from the nature of the observed NOEs, with several methyl and methoxy groups significantly buried at the drug–DNA interface. These interactions are completely analogous to those observed for nogalamycin. The particularly striking feature is that all NOEs observe in the minor groove to S3 and ring A have counterparts in the complex of nogalamycin with d(GACGTC)2. However, the more hydrophobic nogalose sugar, with the two extra methoxy groups in place of OH groups at positions 3 and 4, gives a larger number of NOEs extended over a larger number of nucleotides illustrating more extensive hydrophobic surface burial at the drug–minor groove interface. The two free hydroxy groups on S3 of respinomycin D are positioned on the outer solvent exposed edge of the sugar and are not obviously involved in mediating interactions with the DNA (Fig. 7). Despite the structural differences between the two antibiotics, both molecular conformations complement the contours of the minor groove. The additional sugar chain that adorns the respinomycin D structure appears to play no direct part in the DNA recognition process, suggesting interference with transcription factor binding or topoisomerase activity as the primary role of these sugars in mediating their biological activity.
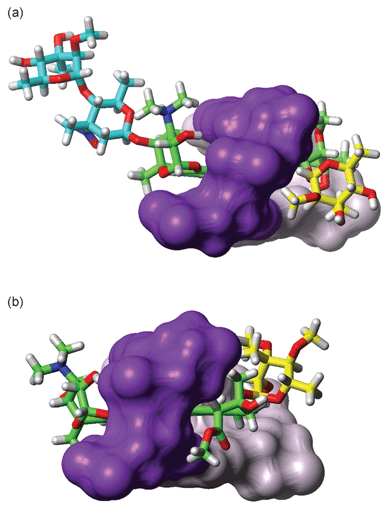 |
| | Fig. 7 (a) Structure of the respinomycin D–d(AGACGTCT)2 complex illustrating details of the intercalation site. Only the CG base pairs at the binding site are shown. The drug threads through the helix with S3 (yellow) located in the minor groove (right); the hydroxy groups on the C3 and C4 positions of S3 are solvent exposed while the methyl and methoxy groups make hydrophobic contacts in the minor groove. The C2–OH of the AG sugar (right; green) hydrogen bonds to the G5 N7, while the disaccharide S1–S2 (blue) is extended away from the major groove into solution; (b) similar view of the structure of the nogalamycin–d(ATGCAT)2 complex showing the bound orientation of the antibiotic across the TpG (CpA) intercalation site (from reference 17; PDB code 1qch). | |
Experimental
Materials
The oligonucleotide d(AGACGTCT) was synthesised on a 10 µmole scale “trityl-on” using standard automated solid-phase methods. The oligonucleotide was purified by semi-preparative HPLC in 100 mM triethylammonium acetate buffer using a C18 column and an acetonitrile gradient. The sample was reduced to 5 mL by rotary evapouration and the trityl group removed using 50 mL of 50% v/v aqueous acetic acid and warming to 35–40 °C for 1 hour. Acetic acid was removed by 3 repeated washings with 200 mL of high grade diethylether followed by dialysis (3 × 1 litre) with de-ionised distilled water. The product was finally lyophilised and redissolved in 0.6 mL of D2O containing 100 mM NaCl and 10 mM sodium phosphate adjusted to pH 7.0 with sodium 3-trimethylsilylpropionate added as an internal chemical shift reference. A few milligrams of respinomycin D was kindly supplied by Dr. Hiroyuki Osada of the Institute of Physical Chemistry and Chemical Research (RIKEN), Japan, and was used without further purification.
NMR methods
NMR experiments on respinomycin D were carried out in D2O at pH 5.0 and 298 K using standard phase-sensitive NMR experiments on a Bruker DRX500 spectrometer.17 The respinomycin D–DNA complex was produced by adding small aliquots of the drug from a 2.4 mM sample to the annealed duplex and monitoring the binding interaction and stoichiometry by 1D 1H NMR where a number of well-resolved signals from the DNA could be readily observed to decrease being replaced by a new set of signals from the asymmetric 1 ∶ 1 complex. At the end point of the titration the sample was lyophilised and redissolved in 0.6 mL of fresh D2O. NMR data on the 1 ∶ 1 respinomycin D–d(AGACGTCT)2 complex was collected on Bruker DRX500 and Avance600 spectrometers at 298K using reported procedures.17
NOE distance restraints and structure calculations
A total of 224 NOE distance restraints (20 drug–DNA, 78 drug–drug and 126 DNA–DNA) were derived from NOESY data sets collected at mixing times of 75, 100 and 150 ms using the distance extrapolation procedure described previously using a number of different internal reference distances within the DNA and within the drug.17,26,27 For modelling purposes, the charge distribution within the drug was calculated using a geometry-optimised structure and semi-empirical methods using SPARTAN 3.1 (Wavefunction Inc., USA, 1994–1995) based on the structural information derived from NMR experiments. The structure of the complex was assembled manually using a standard B-DNA starting structure using the AMBER6 suite of programs,25 and following well-reported protocols for our earlier studies on nogalamycin–DNA complexes.17,26,27 The initial complex were modelled using explicit solvation with phosphate charges neutralised by 13 Na+ ions in addition to a 1+ charge from the bound drug with the complex solvated in a box of 2128 water molecules. Modelling of the unbound octamer followed a very similar protocol with phosphate charges neutralised by 14 Na+ ions. Both systems were very carefully equilibrated over several picoseconds of dynamics to ensure a stable dynamics trajectory at 300K, including an initial 100 ps of unrestrained dynamics. In the case of the complex, the complete set of distance restraints was introduced gradually by ramping the NOE force constants over a 10 ps interval; the whole simulation was run for a further 500 ps with all restraints active. Snapshots were taken every 10 ps, with autocorrelation analysis showing that the system is rapidly equilibrated (within the first 100 ps). The heavy atom RMSD with respect to the mean structure taken over the 50 structures is 1.0 ± 0.2 Å, with a corresponding average NOE-restraint deviation of 0.02 ± 0.06 Å, with no restraints violated by >0.5 Å, showing that the NOE data is well satisfied by the final structures. A detailed analysis of helical parameters was performed using the programs CURVES28 and MOLMOL,29 and fluctuations in these parameters examined over the course of the MD simulation. An energy-minimised structure was generated by “cooling” from 300 K to 1 K over 10 ps at the end of the MD simulation followed by 10 ps of MD at 1 K. The co-ordinates of the final energy-minimised structure have been deposited in the Brookhaven Protein Data Bank, accession code 1N37.
Acknowledgements
We are grateful to the EPSRC of the UK for Research Studentships to AJM and HELW, and for funding NMR facilities in the School of Chemistry, Nottingham.
References
-
S. T. Crooke, S. D. Reich, Anthracyclines, 1980, Academic Press, NY Search PubMed.
- J. W. Lown, Chem. Soc. Revs, 1993, 165–176 Search PubMed.
- W. A. Denny, Anti-cancer Drug Des., 1989, 4, 241–263 Search PubMed.
- A. H. J. Wang, Curr. Opin. Struct. Biol., 1992, 2, 361–368 CrossRef CAS.
- C. Bailly, Current Med. Chem., 2000, 7, 39–58 Search PubMed; A. Fujiwara and T. Hoshino, CRC Crit. Revs Biotechnol., 1986, 3, 133–157 Search PubMed.
- J. H. Doroshow, New England J. Med., 1991, 342, 843–845 Search PubMed; S. Licata, A. Saponiero, A. Mordente and G. Minotti, Chem. Res. Toxicol., 2000, 13, 414–420 CrossRef CAS.
- F. Guano, P. Pourquier, S. Tinelli, M. Binaschi, M. Bigioni, F. Animati, S. Manzini, F. Zunino, G. Kohlhagen and Y. Pommier, Mol. Pharmacol., 1999, 56, 77–84 Search PubMed.
- M. H. Moore, W. N. Hunter, L. Langlois d'Estaintot and O. Kennard, J. Mol. Biol., 1989, 206, 693–705 CrossRef CAS.
- L. Lipscombe, M. Peek, F. Zhou, J. Bertrand, D. Vanderveer and L. Williams, Biochemistry, 1994, 33, 3649–3659 CrossRef.
- F. R. Fox, C. Brasset and M. J. Waring, Biochim. Biophys. Acta, 1985, 840, 383–392 CrossRef.
- K. Shan, A. M. Lincoff and J. B. Young, Annals of Internal Medicine, 1996, 125, 47–58 Search PubMed; S. P. Sim, B. Gatto, C. Yu, A. A. Liu, T. K. Li, D. S. Pilch, E. J. Lavoie and L. F. Liu, Biochemistry, 1997, 36, 13285–13291 CrossRef CAS.
- M. S. Searle and W. Bicknell, Eur. J. Biochem., 1992, 205, 45–58 CAS.
- X. Zhang and D. J. Patel, Biochemistry, 1990, 29, 9451–9466 CrossRef CAS.
- Y. C. Liaw, Y. G. Gao, H. Robinson, G. A. van der Marel, J. H. van Boom and A. J. H. Wang, Biochemistry, 1989, 28, 9913–9919 CrossRef CAS.
- L. D. Williams, M. Egli, Q. Gao, P. Bash, G. A. van der Marel, J. H. van Boom, A. Rich and C. A. Frederick, Proc. Natl. Acad. Sci. U. S. A., 1990, 87, 2225–2229 CAS.
- C. Smith, G. Davies, E. Dodson and M. Moore, Biochemistry, 1995, 34, 415–4125 CrossRef CAS.
- H. E. L. Williams and M. S. Searle, J. Mol. Biol., 1999, 290, 699–716 CrossRef CAS.
- H. Kawai, Y. Hayakawa, M. Nakagawa, K. Furihata, H. Seto and N. Otake, J. Antibiot., 1987, 40, 1273–1282 Search PubMed.
- M. S. Searle, W. Bicknell and L. P. G. Wakelin, Nucleic Acids Res., 1991, 19, 2897–2906 CAS.
- M. Ubukata, C. Tanaka, H. Osada and K. Isono, J. Antibiot., 1991, 44, 1274–1276 Search PubMed.
- M. Ubukata, H. Osada, T. Kudo and K. Isono, J. Antibiot., 1993, 46, 936–941 Search PubMed.
- M. Ubukata, J. Uzawa, H. Osada and K. Isono, J.
Antibiot., 1993, 46, 942–951 Search PubMed.
-
A. J. Maynard, PhD Thesis, 1999, University of Nottingham, UK.
- S. K. Arora, J. Am. Chem. Soc., 1983, 105, 1328–1332 CrossRef CAS.
- W. Cornell, P. Cieplak, C. Bayly, I. Gould, K. Merz, D. Ferguson, D. Spellmeyer, T. Fox, J. Caldwell and P. Kollman, J. Am. Chem. Soc., 1995, 117, 5179–5197 CrossRef CAS.
- C. E. Bostock-Smith, S. A. Harris, C. A. Laughton and M. S. Searle, Nucleic Acids Res., 2001, 29, 693–702 CrossRef CAS.
- E. Gavathiotis, G. J. Sharman and M. S. Searle, Nucleic Acids Res., 2000, 28, 728–735 CrossRef CAS.
- R. Lavery and H. Sklenar, J. Biomol. Struct. Dyn., 1998, 6, 63–91 Search PubMed.
- R. Koradi, M. Billeter and K. Wuthrich, J. Mol. Graphics, 1996, 14, 51–55 CrossRef CAS.
|
| This journal is © The Royal Society of Chemistry 2003 |
Click here to see how this site uses Cookies. View our privacy policy here. 


