Hydride-exchange reactions between NADH and NAD+ model compounds under non-steady-state conditions. Apparent and real kinetic isotope effects
Yun
Lu
,
Yixing
Zhao
,
Kishan L.
Handoo
and
Vernon D.
Parker
*
Contribution from the Department of Chemistry and Biochemistry, Utah State University, Logan, Utah 84322-0300, USA
First published on 22nd November 2002
Abstract
The kinetics of the hydride exchange reaction between NADH model compound 10-methyl-9,10-dihydroacridine (MAH) and 1-benzyl-3-cyanoquinolinium (BQCN+) ion in acetonitrile were studied at temperatures ranging from 291 to 325 K. The extent of reaction–time profiles during the first half-lives are compared with theoretical data for the simple single-step mechanism and a 2-step mechanism involving initial donor/acceptor complex formation followed by unimolecular hydride transfer. The profiles for the reactions of MAH deviate significantly from those expected for the simple single-step mechanism with the deviation increasing with increasing temperature. The deviation from simple mechanism behavior is much less pronounced for the reactions of 10-methyl-9,10-dihydroacridine-10,10-d2 (MAD) which gives rise to extent of reaction dependent apparent kinetic isotope effects (KIEapp). Excellent fits of the experimental extent of reaction–time profiles with theoretical data for the 2-step mechanism, in the pre-steady-state time period, were observed in all cases. Resolution of the kinetics of the hydride exchange reaction into the microscopic rate constants over the entire temperature range resulted in real kinetic isotope effects for the hydride transfer step ranging from 40 (291 K) to 8.2 (325 K). That the reaction involves significant hydride tunnelling was verified by the magnitudes of the Arrhenius parameters; EaD − EaH = 8.7 kcal mol−1 and AD/AH = 8 × 10⁴. An electron donor acceptor complex (λmax = 526 nm) was observed to be a reaction intermediate. Theoretical extent of reaction–time profile data are discussed for the case where a reaction intermediate is formed in a non-productive side equilibrium as compared to the case where it is a real intermediate on the reaction coordinate between reactants and products. The common assumption that the two cases are kinetically indistinguishable is shown to be incorrect.
Introduction
The mechanism of hydride transfer reactions from NADH model compounds to NAD+ analogues as well as to a number of diverse formal hydride acceptors has been under intense investigation for the past two decades.1 Evidence has been presented for both the single-step hydride transfer mechanism and multi-step mechanisms initiated by electron transfer between the hydride ion donor (DoH) and the acceptor (Ac+). When the acceptor is an oxidant such as ferrocene,5–6 ferricyanide,7 quinones8–11 or α-haloketones,12–14 electron transfer mechanisms have been observed to dominate formal hydride transfer reactions. On the other hand, it has been pointed out2,3 that when the standard free energy for the electron transfer reaction (eqn. (1)) between DoH and Ac+ is significantly positive, the electron transfer mechanism is highly unlikely. | (1) |
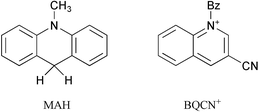
The formal hydride transfer reaction (eqn. (2)) between NADH model compound 10-methyl-9,10-dihydroacridine (MAH) and 1-benzyl-3-cyanoquinolinium ion (BQCN+) in acetonitrile has been studied extensively and has served as a model system for which the direct hydride transfer mechanism is generally accepted.15–18
 | (2) |
The possibility that electron transfer reaction (3) is the first step in the hydride transfer between MAH and BQCN+ is readily assessed from the electrode potential difference for the relevant half-reactions. Recent electrode potential data for the half-reactions19 in acetonitrile correspond to ΔE° equal 1375 mV from which we can evaluate K3 to be equal to about 10−23. Assuming diffusion control20 for back reaction (3), the maximum possible value for k3 can be estimated to be equal to 10−13 M−1 s−1, a fact that eliminates the electron transfer mechanism from consideration.
 | (3) |
The proton transfer reactions between methylanthracene radical cations and pyridine bases21–23 as well as those between a nitroalkane and hydroxide ion24 have recently been observed to take place by a mechanism involving the initial formation of a reactant complex followed by irreversible proton transfer as illustrated in eqn. (4).
 | (4) |
The kinetics of reactions following this mechanism can be resolved into the rate constants for the microscopic steps providing that measurements can be made in the time period before steady-state is achieved.25 In view of our results obtained for the proton transfer reactions, we regarded a similar 2-step mechanism as a likely possibility for the hydride exchange reaction between MAH and BQCN+. In this paper we report kinetic data consistent with the 2-step mechanism and present evidence that an intermediate electron donor acceptor (EDA) complex lies on the reaction coordinate.
Results
Equilibrium constants for the reaction between MAH and BQCN+
Equilibrium constants for reaction (2) in acetonitrile as a function of temperature are summarized in Table 1. The third column gives the percent conversion at complete reaction with a 6/1 ratio of reactants and the concentration of products equal to zero before mixing. At all temperatures the percent conversion at complete reaction, with the reactant concentrations of interest, is greater than 98%. Our value of K2 (11.7) determined by direct measurement at 298 K is greater than that previously determined by a kinetic method (6.7).17 The fact that the van't Hoff plot (Fig. 1) is linear suggests that our equilibrium constants are consistent over the temperature range used. The equilibrium constants over the entire temperature range are of sufficient magnitude to indicate that the effect of reverse reaction (2) is insignificant during the first half-life and the overall reaction can be considered to be irreversible.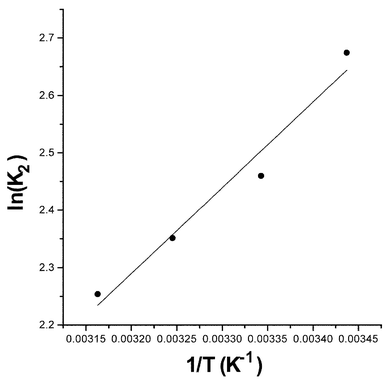 | ||
| Fig. 1 Equilibrium constants for the reaction between MAH and BQCN+ in acetonitrile as a function of temperature. | ||
Comparison of experimental extent of reaction-time profiles with those expected for the irreversible second-order mechanism
Extent of reaction–time profiles for the reactions of MAH (0.0015 M) with BQCN+ (0.009 M) in acetonitrile as a function of temperature (solid circles) are plotted along with theoretical data for the irreversible second-order mechanism (solid lines) in Fig. 2. Deviations of the experimental data for MAH are only evident at temperatures of 308 K and greater with the degree of deviation increasing with increasing temperature. The deviations between experimental extent of reaction–time profiles from the expected response for the irreversible second-order mechanism are much smaller for the reactions of MAD. Apparent kinetic isotope effects (kappH/kappD) varied in the ranges from 4.78–5.00 (308 K), 4.35–4.79 (316 K), and 3.88–4.18 (325 K) at the extent of reaction ranging from 0.05 to 0.50.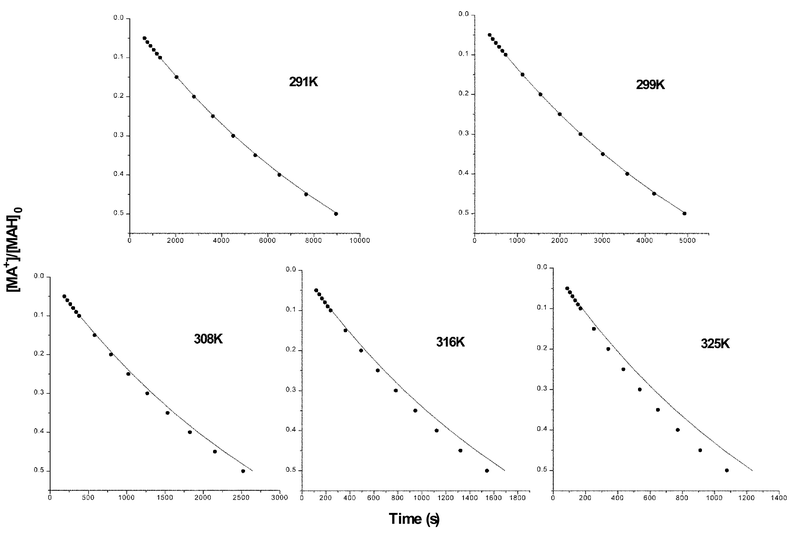 | ||
| Fig. 2 Extent of reaction–time profiles for the reactions of MAH (0.0015 M) with BQCN+ in acetonitrile at various temperatures. Temperatures are given on the plots. The solid circles are experimental data and the solid lines represent the expected response for the irreversible second-order mechanism. | ||
Data characteristics for mechanism analysis
The two mechanisms under consideration for the hydride exchange reaction between a hydride donor (DoH) and a hydride acceptor (Ac+) are the irreversible second-order mechanism (5) and the reversible second-order consecutive mechanism (6). | (5) |
 | (6) |
Two experimental observations, when it is possible to obtain kinetic data for mechanism (6) in the time period before steady-state is achieved, serve to distinguish between the two mechanisms; (i) extent of reaction–time profiles for mechanism (6) exhibiting significant deviations from that for mechanism (5) and (ii) observation of extent of reaction dependent apparent kinetic isotope effects (KIEapp) for reactions of donors, DoH and DoD. The observation of one or both of these distinguishing features provide compelling evidence that the reaction does not follow mechanism (5) while the failure to observe either or both (i) and (ii) does not rule out mechanism (6). Extent of reaction–time profiles for mechanism (6) are steeper than that for mechanism (5) and approach the latter in the limiting case. Two other possible complications, reversibility of reaction (5) and isotopic exchange, have been shown to bring about deviations in the opposite sense resulting in extent of reaction–time profiles steeper than those predicted for the irreversible mechanism (5).25
Fitting experimental extent of reaction–time profiles to theoretical data for the reversible second-order consecutive mechanism
A detailed description of the data fitting procedure has recently been reported.25 In essence, rate constants for mechanism (6) are systematically varied over wide ranges until the best fit is obtained by minimizing the sum of the differences between experimental and theoretical data points. In this work, the procedure involved the concurrent analysis of extent of reaction–time profiles for the reactions of MAH and MAD. The fitting procedure used is essentially the same as was used to resolve the kinetics of the reactions of 1-nitro-1-(4-nitrophenyl)ethane with hydroxide ion in aqueous acetonitrile.24Resolution of the kinetics of the reaction between MAH(D) and BQCN+ in acetonitrile
The best fit of experimental extent of reaction–time profiles to theoretical data for mechanism (6) for the reactions of MAH (solid circles) and MAD (open circles) with BQCN+ (0.009 M) at temperatures ranging from 291 K to 325 K is illustrated in Fig. 3. In all cases the concentration of MAH(D) was 0.0015 M. The feature of interest in all of the plots is that the data for both MAH and MAD give excellent fit to theoretical data (solid lines) for mechanism (6).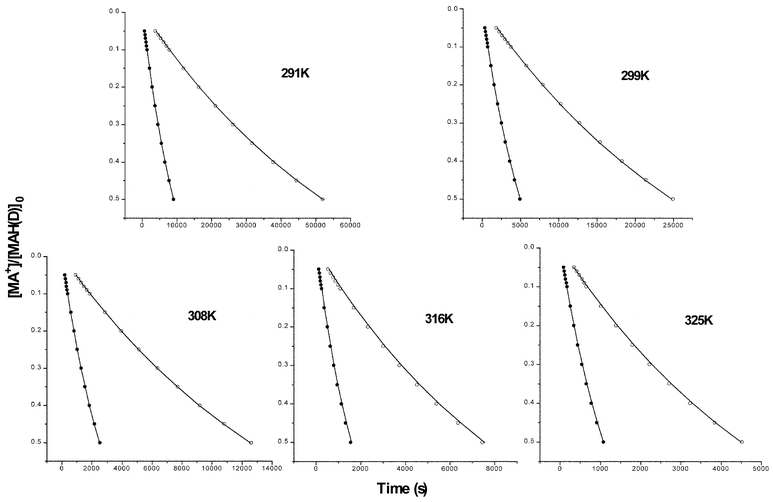 | ||
| Fig. 3 Fit of experimental extent of reaction–time profiles to theoretical data for the reactions of MAH(D) (0.0015 M) with BQCN+ (0.009 M) in acetonitrile at different temperatures. The experimental points are shown as open (MAD) and solid (MAH) circles while theoretical data for the reversible consecutive second-order mechanism are shown as solid lines. | ||
The microscopic rate constants (kf, kb, kpH, and kpD) as well as the corresponding apparent rate constants (kappH and kappD) are summarized in Table 2. The last column in Table 2 gives the real kinetic isotope effects (KIEreal = kpH/kpD) that vary from 40 at the lowest to 8.3 at the highest temperature. The effects of temperature on kappH, kappD, kpH and kpD are illustrated by the Arrhenius plots in Fig. 4. The Arrhenius parameters derived from both kappH(D) and kpH(D) are summarized in Table 3. Arrhenius activation energies derived from kf and kb were observed to be equal to 15 and 14 kcal mol−1, respectively. The features of most interest in the data are EaD − EaH and AD/AH which represent Bell's criteria for quantum mechanical tunnelling.26 Significant hydride tunnelling is indicated when the former quantity exceeds 1.4 kcal mol−1 and the latter exceeds unity. Both of the parameters derived from kpH(D) provide strong evidence for hydride tunnelling while only AD/AH deviates significantly from the semi-classical value for the Arrhenius plots of kappH(D).
| T/K | k app H a | k app D a | k f a | k b b | k p H b | k p D b | KIEreal |
|---|---|---|---|---|---|---|---|
| a Second-order rate constant in M− s−1. b First-order rate constant in s−1. | |||||||
| 291 | 0.00908 | 0.00160 | 0.010 | 0.0031 | 0.023 | 0.00058 | 40 |
| 299 | 0.0165 | 0.00339 | 0.019 | 0.0041 | 0.028 | 0.00090 | 31 |
| 308 | 0.0327 | 0.00660 | 0.047 | 0.0194 | 0.030 | 0.0021 | 14 |
| 316 | 0.0526 | 0.0112 | 0.090 | 0.0172 | 0.035 | 0.0035 | 10 |
| 325 | 0.0766 | 0.0186 | 0.135 | 0.033 | 0.044 | 0.0053 | 8.3 |
| Derived from: | Derived from: | |||
|---|---|---|---|---|
| k app H | k app D | k p H | k p D | |
| E a/kcal mol−1 | 12.0 | 13.5 | 3.4 | 12.1 |
| (EaD − EaH)/kcal mol−1 | 1.5 | 8.7 | ||
| log(A/s−1) | 6.964 | 7.342 | 0.869 | 5.778 |
| A D/AH | 2.4 | 8.1 × 10⁴ | ||
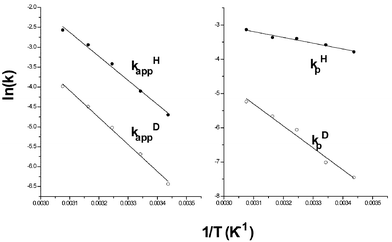 | ||
| Fig. 4 Arrhenius plots for the reactions of MAH(D) (0.0015 M) with BQCN+ (0.009 M) derived from kappH(D) (M−1 s−1) and kpH(D) (s−1). | ||
The extent of reaction–time profiles in Fig. 5 for different [BQCN+]0 show the fit of experimental data for MAH (solid circles) and MAD (open circles) to theoretical data (solid lines) calculated for the rate constants summarized in Table 2. Again, excellent correspondence between experimental data and theoretical data for mechanism (6) was observed for reactions in which [BQCN+]0 was varied from 0.0045 to 0.018 M while holding [MAH(D)]0 constant at 0.0015 M.
![Fit of experimental extent of reaction–time profiles to theoretical data for the reactions of MAH(D)
(0.0015 M) with BQCN+ at different concentrations in acetonitrile at 299 K. Experimental data for MAH are shown as solid and that for MAD as open circles with theoretical data represented by the solid lines. Ratios of initial reactant concentrations ([BQCN+]0/[MAH(D)]0) are specified on the plots.](/image/article/2003/OB/b208186e/b208186e-f5.gif) | ||
| Fig. 5 Fit of experimental extent of reaction–time profiles to theoretical data for the reactions of MAH(D) (0.0015 M) with BQCN+ at different concentrations in acetonitrile at 299 K. Experimental data for MAH are shown as solid and that for MAD as open circles with theoretical data represented by the solid lines. Ratios of initial reactant concentrations ([BQCN+]0/[MAH(D)]0) are specified on the plots. | ||
Estimation of errors in rate constants derived from the fitting procedure
The error in obtaining experimental digital extent of reaction–time profiles is small. The major source of error is expected to arise from the fitting of the experimental extent of reaction–time profiles to theoretical data for the reversible consecutive second-order mechanism (6). A detailed error analysis was presented in a related study24 that is expected to be valid here as well. The fitting errors, in general, were found to be less than about ±5%. The largest errors were found in kb and the smallest in kf. The latter observation is especially significant when assessing the magnitude of KIEreal. The relationship between KIEreal and the rate constants is given by eqn. (9) derived by the combination of eqns. (7) and (8).21–25 The point of importance here is that| (kappH)s.s./kf = (kpH/kb)/(1 + kpH/kb) = CH | (7) |
| (kappD)s.s./kf = (kpD/kb)/(1 + kpD/kb) = CD | (8) |
| KIEreal = [CH/(1 − CH)]/[CD/(1 − CD)] = kpH/kpD | (9) |
KIEreal depends only on kf and the two experimental steady-state apparent rate constants, (kappH)s.s. and (kappD)s.s.. Since small experimental errors are expected in the latter and relatively small errors accompany the determination of kf in the fitting procedure, we expect the error in KIEreal values to be of the order of ±10% or less.
It has previously been pointed out that the error in the other rate constants can be expected to become larger when (kf)fit/kappH approaches unity and the error becomes more significant when the ratio becomes less than 1.05.21 However, the error in (kf)fit is necessarily small, ±5% or less, under these circumstances. The first column in Table 4 gives (kf)fit/kappH as a function of temperature for the reactions of MAH(D) with BQCN+ in acetonitrile. Since the ratio decreases from 1.76 at the highest temperature (325 K) to 1.13 at the lowest temperature (291 K), we can conclude that none of the data are in the range where large errors are to be expected. We might expect the error in (kf)fit to become decreasingly small as the temperature is lowered. Some indication of the consistency of (kf)fit over the temperature range can be obtained by considering the effect of temperature on the (kf)fit values. The Arrhenius plot for a microscopic rate constant over a moderate temperature range is expected to be linear within experimental error. In Table 4, (kf)fit is compared to (kf)calc, obtained from the equation for the Arrhenius plot (r2 equal to 0.995) of log(kf)fitvs. 1/T. The fourth column in Table 4 gives the percent deviation of (kf)calc from (kf)fit. The deviations are generally less than ±10%, however, the data point at 299 K gives the greatest deviation from the correlation line (12.7%), for no apparent reason. For more detailed discussion of the fitting procedure and the associated errors the reader is referred to refs. 24 and 25.
| T/K | (kf)fit/kappH | (kf)fit/M−1 s−1 | (kf)calc/M−1 s−1a | 100 × [(kf)fit − (kf)calc]/(kf)fit (%) |
|---|---|---|---|---|
| a Calculated from the equation for the line obtained from the Arrhenius relationship. | ||||
| 291 | 1.13 | 0.0103 | 0.0101 | 1.9 |
| 299 | 1.15 | 0.0189 | 0.0213 | 12.7 |
| 308 | 1.42 | 0.0465 | 0.0416 | 10.5 |
| 316 | 1.70 | 0.0896 | 0.0815 | −9.0 |
| 325 | 1.76 | 0.135 | 0.148 | −9.6 |
Thermochemistry of the formation of the reaction complex
It is of interest to calculate the equilibrium constants (Keq) for the association of MAH(D) with BQCN+ which are given by the expression, Keq = kf/kb. These are summarized as a function of temperature in Table 5. Columns 2, 3 and 4 in Table 5 give the observed values of kf, kb and Keq, respectively. There is considerable scatter in (Keq)obs with no discernable trend with temperature changes. The rate constants most subject to error are kb since these are adjusted to fit relationship (10), where (kapp)s.s. is the apparent rate constant under steady-state conditions, while optimizing the fit for kf and kp.| kb = kfkp/(kapp)s.s. − kp | (10) |
| T/K | (kf)obs/M−1 s−1 | (kb)obs/s−1 | (Keq)obs/M−1 | (kf)calc/M−1 s−1 | (kb)calc/s−1 | (Keq)calc/M−1 |
|---|---|---|---|---|---|---|
| 291 | 0.0103 | 0.00305 | 3.37 | 0.0101 | 0.00295 | 3.46 |
| 299 | 0.0189 | 0.00406 | 4.65 | 0.0213 | 0.00561 | 3.60 |
| 308 | 0.0465 | 0.0194 | 2.39 | 0.0416 | 0.0111 | 3.78 |
| 316 | 0.0896 | 0.0172 | 5.20 | 0.0815 | 0.0197 | 3.94 |
| 325 | 0.135 | 0.0332 | 4.06 | 0.148 | 0.0364 | 4.12 |
Error in (kb)obs as well as that in (kf)obs could give rise to the scatter in (Keq)obs. Since kb, like kf, is expected to provide a linear (within experimental error) Arrhenius relationship, (kb)calc were obtained from the resulting equations and these, along with those for (kf)calc from Table 4, are listed in columns 5 and 6 of Table 5. The last column in Table 5 gives (Keq)calc derived from the relevant rate constants. The van't Hoff plot of log(Keq)calcvs. 1/T resulted in values of 0.97 kcal mol−1 and 5.8 e.u. (1 e.u. (entropy unit) = 4.184 J K−1 mol−1) for ΔH° and ΔS°, respectively, for the association of the reactants.
Kinetic method to determine whether or not a reaction intermediate lies on the reaction coordinate for product formation
The observation of a transient species during a reaction does not constitute evidence that the species is a true intermediate that lies on the reaction coordinate between reactants and products. For example, the two cases shown in Scheme 1 have long been believed to be indistinguishable by kinetic measurements. This problem has been discussed in detail for the Diels–Alder reactions27,28 and it was proposed28 that Case 2 could only be distinguished from Case 1 if a negative apparent Arrhenius activation energy was experimentally observed.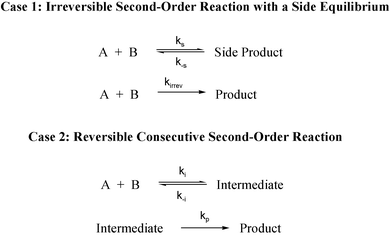 | ||
| Scheme 1 | ||
Our recent work25 has shown that the reversible consecutive second-order mechanism (Case 2, Scheme 1) is readily distinguished from the irreversible second-order mechanism (second step, Case 1, Scheme 1) when it is possible to carry out kinetic measurements for Case 2 in the pre-steady-state time period.25 The primary kinetic observation used to distinguish the latter mechanisms consists of extent of reaction–time profiles for Case 2 which are steeper than expected for the irreversible second-order mechanism. Under steady-state conditions the two mechanisms are kinetically indistinguishable.
The theoretical data in Table 6 are taken from extent of reaction–time profiles for the irreversible second-order mechanism accompanied by a non-productive side equilibrium (Case 1). The subscripts in the time ratios (t0.50/t0.01 and t0.50/t0.05) represent extent of reaction. The data in Table 6 and those from more extensive calculations not shown reveal that kinetic data for a reaction following the Case 1 mechanism are readily distinguishable from that for the irreversible second-order mechanism in the absence of the side equilibrium. In the limit where k−s is large relative to kirrev[B] ([B] is assumed to be greater than [A]), the side equilibrium cannot be detected from the extent of reaction–time profiles and the time ratios (t0.50/t0.01 and t0.50/t0.05), under pseudo first-order conditions, are predicted to be equal to 69.0 and 13.5, respectively.
| k s(side)/M−1 s−1b | k −s(side)/s−1c | k irrev/M−1 s−1d | t 0.50/t0.01e | t 0.50/t0.05f |
|---|---|---|---|---|
| a [A]0 = 0.0001 M, [B]0 = 0.06 M b Second-order rate constant for the forward reaction of the non-productive side equilibrium. c First-order rate constant for the reverse reaction of the non-productive side equilibrium. d Second-order rate constant for the irreversible second-order reaction between A and B. e Relative time to reach extents of reaction of 0.50 and 0.01. In the absence of the side equilibrium equal to 69.0. f Relative time to reach extents of reaction of 0.50 and 0.05. In the absence of the side equilibrium equal to 13.5. | ||||
| 100 | 100 | 0.1 | 69.0 | 13.5 |
| 100 | 100 | 1 | 69.2 | 13.5 |
| 100 | 100 | 4 | 69.9 | 13.5 |
| 100 | 100 | 7 | 70.5 | 13.6 |
| 100 | 100 | 10 | 70.9 | 13.6 |
| 100 | 100 | 20 | 71.7 | 13.7 |
| 100 | 100 | 50 | 72.4 | 13.9 |
| 100 | 100 | 100 | 72.7 | 14.0 |
| 1000 | 100 | 0.1 | 69.1 | 13.5 |
| 1000 | 100 | 1 | 69.9 | 13.5 |
| 1000 | 100 | 4 | 73.0 | 13.7 |
| 1000 | 100 | 7 | 76.3 | 13.8 |
| 1000 | 100 | 10 | 79.8 | 13.9 |
| 1000 | 100 | 20 | 89.1 | 14.2 |
| 1000 | 100 | 50 | 99.9 | 15.5 |
| 1000 | 100 | 100 | 104.4 | 17.2 |
The following general statements, in which t0.50/t0.01 is used as a measure of steepness for the sake of convenience, summarize how extent of reaction–time profiles distinguish between Case 1 and Case 2. The time ratios (t0.50/t0.01) for Case 1 are generally greater than 69.0 and approach that value in the limit where k−s is very much greater than kirrev[B]. The time ratios (t0.50/t0.01) for Case 2, in the pre-steady-state time period, are generally less than 69.0 and approach that limit as ki approaches kapp (kapp = kikp/(kp + k−i)), i.e. when kp≫k−i, or as kpki/k−i approaches kapp (when kp ≪k−i). Obviously, the assumption27,28 that Case 1 and Case 2 are kinetically indistinguishable is not generally valid.
Electronic absorbance spectral evidence for an intermediate during the reaction between MAH and BQCN+
Electronic absorbance spectra as a function of time recorded during the reaction of MAH (0.01 M) with BQCN+ (0.06 M) in acetonitrile at 291 K are illustrated in Fig. 6. The peak with maximum absorbance at 526 nm, observed immediately after mixing, was observed to decay with time and disappear as the reaction approached completion. Absorbance (526 nm)–time profiles recorded for the reaction of MAH (0.01 M) with BQCN+ (0.043 M) at the temperature extremes employed in the kinetic studies are shown in Fig. 7. Results obtained for the reaction of MAD with BQCN+ under the same conditions did not differ significantly from those obtained with MAH. The species giving rise to the electronic absorbance band at 526 nm is most likely an EDA complex. Similar spectra have recently been reported for MAH and related donors with a number of quinones as acceptor molecules.4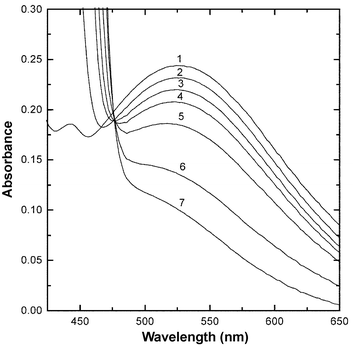 | ||
| Fig. 6 Electronic absorbance spectra recorded during the reaction of MAH (0.01 M) and BQCN+ (0.06 M) in acetonitrile at 291 K recorded at the following times; <0.01 (1), 0.5 (2), 3 (3), 6 (4), 12.5 (5), 24 (6) and 54 min (7). | ||
Equilibrium constants were determined for the reactions of MAH (0.025–0.10 M) with BQCN+ (0.01 M) in acetonitrile using the reciprocal form of the Benesi–Hildebrand29eqn. (11) at temperatures ranging from 291 to 316 K (A526 = absorbance at 526 nm, ε526 = extinction coefficient at 526 nm, KEDA = equilibrium constant for EDA complex formation).
| A526−1 = (ε526KEDA[BQCN+]0)−1[MAH]0−1 + (ε526[BQCN+]0)−1 | (11) |
The data are summarized in Table 7. Thermodynamic parameters (ΔH° = −0.9 kcal mol−1, ΔS° = −3 e.u.) were determined from the corresponding van't Hoff equation.
| T/K | 291 | 299 | 308 | 316 |
| K EDA/M−1 | 1.28 | 1.25 | 1.21 | 1.13 |
Since all of the extent of reaction–time profiles observed for the reactions of MAH(D) with BQCN+ conform to the expected response for Case 2, there is necessarily a true intermediate on the reaction coordinate between reactants and products. Due to the necessity of using high reactant concentrations in order to observe the EDA complex, we were unable to study the kinetics of its formation. However, we can say with certainty that the rate constant for formation of this intermediate is considerably greater than the observed values of kf at all temperatures. The fact that similar results were obtained with MAH and MAD suggests that the EDA complex is in equilibrium with the reactants. If the equilibrium between intermediate and reactants were not established, the intermediate EDA complex concentration would be expected to be higher when the donor is MAD as compared to that when MAH is the donor due to the kinetic isotope effect for further reaction to products. Under these conditions, it is clear that the kinetics of the formation and dissociation of the EDA complex are out of the range where an effect on the extent of reaction–time profiles is expected for reactions following either Case 1 or Case 2 mechanisms.
Discussion
The facts that experimental extent of reaction–time profiles (Fig. 2) deviate significantly from those expected for the irreversible second-order mechanism (5) and that extent of reaction dependent KIEapp for the reactions of MAH and MAD with BQCN+ in acetonitrile are observed provide convincing kinetic evidence that the hydride exchange reaction does not follow mechanism (5). This conclusion finds further support in the observation of an intermediate EDA complex that most likely lies on the reaction coordinate between reactants and products.On the other hand, the experimental kinetic data (Figs. 3 and 5) are consistent with the reversible consecutive second-order mechanism (6). In order to take into account the observation of the rapidly established equilibrium between reactants and the EDA complex, mechanism (6) must be modified to include the additional step (Scheme 2) and kf must be set equal to kf′KEDA. With these modifications the mechanism illustrated in Scheme 2 provides an appropriate model for the discussion of the kinetics of the hydride exchange reaction between MAH(D) and BQCN+ in acetonitrile.
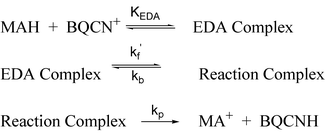 | ||
| Scheme 2 | ||
The alternative interpretation is that the EDA complex is formed in a side equilibrium (Case 1) which is so rapid that its presence does not affect the extent of reaction–time profiles during the reaction between MAH(D) and BQCN+ in acetonitrile. Under these conditions mechanism (6) without modification is most consistent with the kinetic data. We regard this possibility as less likely since we would expect the transformation of the EDA complex to products to take place at a higher rate than product formation from the isolated reactants (MAH(D) and BQCN+). For this reason, we believe that Scheme 2 represents the mechanism most consistent with all of the experimental evidence.
We have not been able to obtain spectral evidence for the “Reaction Complex” in Scheme 2. Spectral information for this intermediate is most likely buried in the absorbance band for the product, MA+. It appears reasonable to suggest that changes in the structure in going from the EDA complex to the reaction complex would be accompanied by either a significant shift in the charge transfer band at 526 nm for the former or even the disappearance of a charge transfer band. The absorbance of the product would obscure any absorbance below about 475 nm due to the reaction complex. Calculations of concentration profiles using the rate constants summarized in Table 2 result in the prediction of maximum intermediate concentrations ranging from about 0.35 to 1.5% of [MAH]0, depending upon the temperature.
The orientations of the reactants in the EDA complex are most likely rather far removed from those prompting the transfer of the hydride ion from carbon at the 10-position of MAH to carbon at the 2- or 4-position of BQCN+. To reach the transition state between the EDA complex and the reaction complex considerable reorientation must be required. The magnitudes of ΔH° (−0.9 kcal mol−1) and ΔS° (−3 e.u.) for formation of the EDA complex suggest that there has not been appreciable solvation change in the reactants upon going to the EDA complex. In order to reach the transition state for formation of the reaction complex appreciable change in solvation is likely to be necessary in order to provide an orientation conducive to transfer of the hydride ion. This change in solvation could account for a major part of the activation energy associated with kf. The magnitudes of the Arrhenius activation energies derived from kf and kb (15 and 13 kcal mol−1, respectively) are similar to those reported for the formation and dissociation of molecular complexes of trinitroarenes with ethoxide ion in ethanol.30 Values reported for Ea derived from the forward rate constants varied from 10.4 to 13.3 kcal mol−1 while those for the dissociation of the complexes were observed to range from 8.2 to 13.7 kcal mol−1.
The values of KIEreal (Table 2) provide evidence for extensive hydride tunnelling over the entire temperature range of the kinetic studies. Furthermore, the Arrhenius parameters (EaD − EaH and AD/AH) fulfill Bell's criteria26 for hydride tunnelling as well. The latter strongly support the KIEreal data and lead us to the conclusion that there is indeed extensive tunnelling in the hydride exchange reaction between MAH and BQCN+ in acetonitrile. The fact that KIEreal changes markedly with temperature (from 40 at 291 K to 8.3 at 325 K) is a consequence of the much larger activation energy for the transfer of deuteride than for that for transfer of hydride. This can be explained by suggesting that hydride but not deuteride tunnels, and since tunnelling is expected to be independent of temperature this gives rise to the differences in activation energies for the two processes. A number of (EaD − EaH) with values in the range of 8–23 kcal mol−1 for several organic reactions can be found in Table 5.4 of ref. 26.
Kreevoy and Kotchevar17 have proposed a three step process, similar to the Marcus formulation, for the hydride exchange reaction between MAH(D) and BQCN+ in a number of different solvents. They propose the following sequence of events. In the first step the heavy atoms and solvent are reorganized to a configuration intermediate between reactants and products. This is followed by the second step in which the hydride is transferred, probably accompanied by tunnelling. In the third step, the products are stabilized by further solvent and heavy-atom reorganization. This description is somewhat consistent with the mechanism shown in Scheme 2 provided that the steps are considered to involve the formation of intermediates as well as three distinct transition states rather than a single transition state as implied.17
A detailed study of potential energy surfaces for hydride transfer using variational transition state theory along with linearized Marcus theory led to the conclusion that hydride tunnelling is of importance in these reactions.15 The calculations led to the conclusion that about 1 kcal mol−1 of the reaction barrier is evaded by hydride tunneling.
Our resolution of the kinetics of the reaction between MAH(D) and BQCN+ in acetonitrile provides support for many of the conclusions from previous work17,15 based on the apparent rate constants. We now extend these conclusions with more direct experimental evidence for tunnelling including large KIEreal and Arrhenius parameters for the hydride transfer step which indicate significant hydride tunnelling. Our data suggest that as much as 9 kcal mol−1 of the reaction barrier for hydride transfer is circumvented by tunnelling.
Since we observe the EDA complex as a possible intermediate in the hydride transfer reaction, the possibility that the reaction takes place by an inner-sphere electron transfer (Ket) mechanism must be considered.31 However, since Ket is equal to K3/KEDA31 and KEDA is close to unity over the entire temperature range Ket ≈ K3. Thus the inner-sphere electron transfer mechanism is ruled out by the arguments presented in the Introduction to rule out the outer-sphere electron transfer mechanism.
Conclusions
The facts that (i) extent of reaction–time profiles for the reactions between MAH and BQCN+ deviate significantly from those expected for the irreversible second-order mechanism (5), (ii) significant extent of reaction dependent apparent kinetic isotope effects are observed and (iii) and an intermediate EDA complex is observed rule out mechanism (5) for the hydride transfer reaction. All of the data are consistent with the reversible consecutive second-order mechanism illustrated in Scheme 2. Needless to say, our data do not conclusively prove the latter mechanism for the hydride transfer reaction between MAH and BQCN+. What we have shown with certainty is that the reversible consecutive second-order mechanism provides an appropriate model for the discussion of the reaction mechanism.Our overall conclusion is that hydride transfer reactions join the growing list of organic reactions which follow the reversible consecutive second-order mechanism, as illustrated for proton transfer by eqn. (4) and for hydride transfer by eqn. (6) or Scheme 2. Reactions which have been reported to follow the reversible consecutive second-order mechanism include the proton transfer reactions of methylanthracene radical cations21–23 and those of nitroalkanes.24 It is anticipated that further studies will reveal other classes of organic reactions which conform to this general mechanism.
Experimental
Materials
N-Methylacridinium iodide was prepared by the treatment of acridine (Aldrich) with a 3-fold excess of methyl iodide in acetone. 10-Methyl-9,10-dihydroacridine was prepared by reduction of N-methylacridinium iodide using sodium borohydride in dry methanol, followed by recrystallization from absolute ethanol.32 10-Methyl-9,10-dihydroacridine-10,10-d2 was prepared as described in the literature.33 1-Benzyl-3-cyanoquinolinium perchlorate was prepared by ion exchange of 1-benzyl-3-cyanoquinolinium bromide obtained from the reaction of 3-cyanoquinoline with benzyl bromide.17 The bromide salt was dissolved in dry acetonitrile in the presence of a 50-fold excess of sodium perchlorate. The solvent was evaporated until a small amount of sodium iodide precipitated. The precipitate was removed by filtration. After evaporation of the solvent the residue was washed with water and collected by filtration. The process was repeated twice to ensure complete exchange. The resulting solid was recrystallized from absolute ethanol to give the perchlorate salt (mp 198–200 °C, lit.17 202 °C). It should be noted that organic percholorates are explosive and must be handled with care. Acetonitrile was refluxed over KMnO4 and K2CO3 and twice distilled from P2O5 under a nitrogen atmosphere.Kinetic experiments
The kinetics of the reactions between MAH(D) and BQCN+ were followed by the appearance of absorbance due to MA+ at 436 nm using an HP8452A Diode Array Spectrometer housed in a glove box ([O2] < 1 ppm). The cuvettes were tightly stoppered in order to avoid evaporation of acetonitrile solvent. The temperature was controlled to ±0.5 K. Digital absorbance–time data were smoothed using the 15-point least-squares procedure of Savitsky and Golay34 before conversion into extent of reaction ([MA+]/[MAH(D)]0)–time profiles.Determination of equilibrium constants for the reaction of MAH with BQCN+ in acetonitrile
A solution of MAH (2.97 mM) and BQCN+ (3.13 mM) in acetonitrile was sealed in a cuvette and placed in the glove box at about 20 °C for 14 days. The cuvette was placed in the spectrometer and the temperature adjusted to the desired value. The spectrum was recorded periodically until no further change took place as equilibrium was approached. Repeat values at different temperatures gave good correspondence and indicated that no decomposition occurs under the conditions of the experiments. Equilibrium constants were calculated from the absorbance and the initial concentrations of reactants.Determination of the equilibrium constant for the formation of the EDA complex between MAH and BQCN+ in acetonitrile
Equal volumes of solutions of MAH (0.025–0.1 M) and BQCN+ (0.01 M) were mixed at the appropriate temperature and the absorbance at 526 nm was recorded as a function of time using the Hi-Tech Scientific SF-61 stopped-flow spectrometer. Initial concentrations were such that [MAH]0/[BQCN]0 were equal to 25, 50, 75 and 100. The absorbance–time curves were effectively flat at short times and [EDA Complex] were determined by averaging 50 data points gathered at about 10 ms after mixing. The data were treated according to eqn. (11) to determine KEDA and ε526. The time dependence of [EDA complex] over longer time intervals is illustrated by the data in Fig. 7.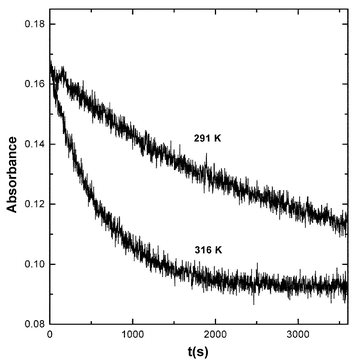 | ||
| Fig. 7 Absorbance–time curves recorded at 526 nm for the reaction of MAH (0.01 M) with BQCN+ (0.043 M) in acetonitrile at 291 K (upper curve) and 316 K (lower curve). | ||
Acknowledgements
This research was supported by the National Science Foundation (CHE-0074405). We gratefully acknowledge this support.References
- (a) J. W. Bunting, Bioorg. Chem., 1991, 19, 456 CrossRef CAS; (b) S. Yausi and A. Ohno, Bioorg. Chem., 1986, 14, 70. More recent work has been cited in refs. 2–4 Search PubMed.
- A. Anne, J. Moiroux and J. M. Savéant, J. Am. Chem. Soc., 1993, 115, 10224 CrossRef CAS.
- J.-P. Cheng, Y. Lu, X. Zhu and L. Mu, J. Org. Chem., 1998, 63, 6108 CrossRef CAS.
- S. Fukuzumi, K. Ohkubo, Y. Tokuda and T. Suenubo, J. Am. Chem. Soc., 2000, 122, 4286 CrossRef CAS.
- B. W. Carlson, L. L. Miller, P. Neta and J. Grodkowski, J. Am. Chem. Soc., 1984, 106, 7233 CrossRef CAS.
- S. Fukuzumi, S. Koumitsu, K. Hironaka and T. Tanaka, J. Am. Chem. Soc., 1987, 109, 305 CrossRef CAS.
- A. Sinha and T. C. Bruice, J. Am. Chem. Soc., 1984, 106, 7291 CrossRef CAS.
- M. Ishikawa and S. Fukuzumi, J. Chem. Soc., Faraday Trans., 1990, 86, 3531 RSC.
- S. Fukuzumi, M. Ishikawa and T. Tanaka, J. Chem. Soc., Perkin Trans 2, 1989, 1811 RSC.
- C. A. Coleman, J. G. Rose and C. J. Murray, J. Am. Chem. Soc., 1992, 114, 9755 CrossRef CAS.
- C. J. Murray and T. Webb, J. Am. Chem. Soc., 1991, 113, 7426 CrossRef CAS.
- D. D. Tanner and A. Kharrat, J. Org. Chem., 1988, 53, 1546.
- D. D. Tanner, H. K. Singh, A. Kharrat and A. R. Stein, J. Org. Chem., 1986, 52, 2142.
- D. D. Tanner and H. K. Singh, J. Org. Chem., 1986, 51, 5182 CrossRef CAS.
- Y. Kim, D. G. Trular and M. M. Kreevoy, J. Am. Chem. Soc., 1991, 113, 7837 CrossRef CAS.
- A. T. Kotchevar and M. M. Kreevoy, J. Phys. Chem., 1991, 95, 10345 CrossRef CAS.
- M. M. Kreevoy and A. T. Kotchevar, J. Am. Chem. Soc., 1990, 112, 3579 CrossRef CAS.
- M. M. Kreevoy, D. Ostovic, I.-S. H. Lee, D. A. Binder and G. W. King, J. Am. Chem. Soc., 1988, 110, 524 CrossRef CAS.
- A. Anne, P. Hapiot, J. Moirioux, P. Neta and J.-M. Savéant, J. Am. Chem. Soc., 1992, 114, 4694 CrossRef CAS.
- V. D. Parker, J. Electroanal. Chem., 1972, 36, App. 8 CrossRef.
- V. D. Parker, Y. Zhao, Y. Lu and G. Zheng, J. Am. Chem. Soc., 1998, 120, 12720 CrossRef CAS.
- Y. Lu, Y. Zhao and V. D. Parker, J. Am. Chem. Soc., 2001, 123, 5900 CrossRef CAS.
- Y. Zhao, Y. Lu and V. D. Parker, J. Chem. Soc., Perkin Trans. 2, 2001, 1481 RSC.
- Y. Zhao, Y. Lu and V. D. Parker, J. Am. Chem. Soc., 2001, 123, 1579 CrossRef CAS.
- V. D. Parker and Y. Zhao, J. Phys. Org. Chem., 2001, 14, 604 CrossRef CAS.
- R. P. Bell, The Tunnel Effect in Chemistry, Chapman and Hall, London, 1980 Search PubMed.
- V. D. Kiselev and J. G. Miller, J. Am. Chem. Soc., 1975, 97, 4036 CrossRef CAS.
- K. E. Wise and R. A. Wheeler, J. Phys. Chem. A, 1999, 103, 8279 CrossRef CAS.
- H. A. Benesi and J. H. Hildebrand, J. Am. Chem. Soc., 1949, 71, 2103.
- J. B. Ainscough and E. F. Caldin, J. Chem. Soc., 1956, 2528, 2540–2546 RSC.
- S. V. Rosokha and J. K. Kochi, J. Am. Chem. Soc., 2001, 123, 8985 CrossRef CAS.
- A. K. Colter, G. L. Charles, T. W. Williamson and R. E. Berry, Can. J. Chem., 1983, 61, 2544 CAS.
- P. Karrer, L. Szabo, H. J. V. Krishan and R. Schwyzer, Helv. Chem. Acta., 1950, 33, 294 Search PubMed.
- A. Savitzky and M. Golay, Anal. Chem., 1964, 36, 1627 CrossRef CAS.
| This journal is © The Royal Society of Chemistry 2003 |

