Programmable modification of cell adhesion and zeta potential in silica microchips
Brian J.
Kirby
a,
Aaron R.
Wheeler
b,
Richard N.
Zare
b,
Julia A.
Fruetel
a and
Timothy J.
Shepodd
c
aMicrofluidics Department, Sandia National Laboratories, Livermore, CA, USA. E-mail: bjkirby@sandia.gov; Fax: +1 (925)294-3020; Tel: +1 (925)294-2898
bChemistry Department, Stanford University, Stanford, CA, USA
cMaterials Chemistry Department, Sandia National Laboratories, Livermore, CA, USA
First published on 6th February 2003
Abstract
Spatial patterning of thin polyacrylamide films bonded to self-assembled monolayers on silica microchannels is described as a means for manipulating cell-adhesion and electroosmotic properties in microchips. Streaming potential measurements indicate that the zeta potential is reduced by at least two orders of magnitude at biological pH, and the adhesion of several kinds of cells is reduced by 80–100%. Results are shown for cover slides and in wet-etched silica microchannels. Because the polyacrylamide film is thin and transparent, this film is consistent with optical manipulation of cells and detection of cell contents. The spatial patterning technique is straightforward and has the potential to aid on-chip analysis of single adherent cells.
Introduction
Microfluidic chip-based platforms have become increasingly popular in recent years for applications such as separation and detection,1–5 PCR and/or DNA analysis,6–11 and cell manipulation12–14 owing to the speed of chip-based processes and the potential for very-large-scale integration. Using microfluidic devices for applications involving biological cells has been motivated by the potential for integrating manipulation and analysis steps, as well as increased sampling throughput and efficiency. Cell adhesion in chips, which results from hydrophobic and electrostatic interactions between cells and the extracellular silica substrate, is a major stumbling block to single- and multiple-cell analyses unless cells are chosen specifically to avoid adhesion. Techniques that reduce cell adhesion must be compatible with various buffers and techniques used for cell analysis (e.g., electrophoresis, and absorbance/LIF detection).Background
Surface properties play a central role in a number of microfluidic chip-based techniques by causing hydrophobic interactions (arising from a lack of hydrogen bonding at microchannel walls) or inducing electroosmotic flow and electrostatic interactions (arising from net surface charge). Hydrophobic interactions can lead to irreversible protein adsorption at walls and inconsistent protein elution times. Electroosmotic flow (EOF) can be a required component of a micro analysis system, but variations and uncertainties in EOF can also interfere with microfluidic techniques by causing inconsistency in elution times or decreasing plate heights of electrophoretic separations. Electrostatic interactions can lead to adhesion of cells or particles at the wall.Microchip analytical devices of increasing sophistication will often require programmable surface properties, including control of the spatial distribution of charge and polarity. Arbitrary control of zeta potential enables various combinations of microanalysis techniques that have different surface charge/polarity requirements. In particular, many techniques employ electroosmotic injection and manipulation of analytes in concert with separation or analysis techniques that benefit from an uncharged, hydrophilic surface. Examples of this include two-dimensional separations achieved by combining isoelectric focusing (no surface charge) with electrokinetic injections onto an electrophoretic separation column, or cell analysis techniques that require neutral microchannel walls to prevent cell adhesion and unwanted EOF. Furthermore, optical techniques for detection and manipulation (optical tweezers) on-chip further require that surface modifications be nonabsorbent and nonscattering at the laser wavelength. With these techniques in mind, photopatterned surface modification is demonstrated here for arbitrary control of surface charge and hydrophobicity.
Thin film surface modification
Many modifications of glass substrates have been reported for applications ranging from microfluidic analysis to implantable device biocompatibility.15–18 While plastics and other materials may be modified by laser-induced photochemical change19 or plasma modification,20 silica surfaces must typically be coated to effect permanent changes in their properties.Silica has been modified by the direct application of polymers such as methylcellulose,21 polyvinyl alcohol,22 and polyethylene glycols.23 For more robust coatings and more reproducible results, a wide variety of techniques have been developed around surface functionalization using self-assembling monolayers (SAMs). Monolayers have been deposited on silica surfaces primarily using chemicals consisting of a hydrocarbon backbone terminating in a polyfunctional alkoxysilyl moiety. Hydrolysis and condensation of these alkoxy groups attaches the hydrocarbon backbone to the silica surface via a siloxane bond. SAMs have been patterned using UV lithography,24 microcontact printing,20 scanned-probe lithography,25 and electron-beam lithography.26 Polymers including polyethylene glycol,27 polyacrylamide,28,29 and hydroxypropylcellulose30 have been grafted to silica surfaces using primarily methacrylate-terminated intermediates. Successful polymer films prevent both electrostatic and hydrophobic attractions at the wall by presenting an uncharged polar surface to the fluid.
To address the needs of silica-based microfluidic structures designed for rapid fabrication, we present a technique for globally coating microchannels with an acrylate-terminated SAM followed by localized polymerization of polyacrylamide. This technique allows for straightforward photopatterning of surface charge and polarity. Here, performance of the photopatterned polyacrylamide is discussed for the purpose of increasing biocompatibility of (i.e., preventing cell adhesion on) silica surfaces for cell analysis on silica microchip platforms.
Experimental
Microfluidic devices
Microchips were fabricated with established wet-etch methodology at Sandia cleanroom facilities. Commercially available chips (Micralyne, Alberta, Canada) were also used. Typical microchannel dimensions were approximately 100 × 30 μm, with the minimum size dictated by the need to allow small cells (∼10 μm dia.) to pass unimpeded.SAM functionalization and photopatterning
Silica microchannels and cover slides were functionalized by conditioning with a coating solution comprised of a 1∶2∶2 mixture of 3-(trimethoxysilyl)propyl acrylate (Aldrich), deionized water (Millipore), and glacial acetic acid (Aldrich). Surfaces were treated with a 30 minute exposure to 1 M HCl, rinsed thoroughly with water, then treated with 1 M NaOH for 30 minutes. After a thorough rinsing with water, the freshly mixed coating solution was brought into contact with the surface. After 30 minutes, this mixture was removed and the surfaces were rinsed with deionized water. Shorter exposure times led to incomplete wall shielding, while longer exposure times led to formation of colloidal sol–gel precursors,31 which are difficult to remove from the microchannel surface and lead to scattering when optical detection and manipulation techniques are used.To photopattern the surface with linear polyacrylamide, a 5% (weight) aqueous solution of acrylamide with 2 mg ml−1 2,2′-azobis(2-methylpropanimidamide) dihydrochloride (V-50) water-soluble photoinitiator (Wako Chemicals) and 250 ppm hydroquinone was sonicated in air and used to fill the microchannels. Channels were illuminated for 15 s with 10 Hz pulses (local fluence of 40 μJ μm−2) from a frequency-tripled Nd:YAG laser operating at 355 nm (Continuum Mini-Lite) to photoinitiate polymerization of the acrylamide to the exposed acrylate group (Fig. 1). The pattern of polyacrylamide was specified by focusing the laser through a lithographic mask and imaging the mask onto the silica surface.
 | ||
| Fig. 1 Chemistry of surface modification. | ||
The experimental protocol was developed to retain the fidelity of the mask pattern in the optical excitation and the eventual polymer film. In particular, the projection lithography configuration described here was chosen over contact lithography to avoid the diffraction attendant with contact lithography techniques. The concentrations of photoinitiator and inhibitor were carefully optimized to increase the optical thickness of the fluid and to minimize the characteristic diffusion length of radical populations. The thickness of the polyacrylamide film thus generated is estimated at 10 ± 5 nm; however, performance of the acrylamide film is not a strong function of film thickness and this parameter was not closely monitored.
Zeta potential measurement
Streaming potential (Fig. 2) was used to measure ζ in silica capillaries with and without surface modifications. After its conductivity was measured with a conductivity meter (Corning 441, Corning, NY), buffer was used to fill a 30 cm long, 150 μm i.d. capillary. Pressure (0–150 psi) was applied to one end of the test capillary using a syringe pump. Catalyzed platinum electrodes measured the generated voltage across the capillary and a strain-gauge type transducer measured the pressure at the inlet. The forcing pressure, capillary diameter, and capillary length were chosen such that the flow was laminar, surface conductivity was negligible, and errors due to hydrodynamic starting lengths could be ignored. Known viscosity (μ), conductivity (σ), permittivity (εε0), and linear fits to the pressure–voltage curve give the zeta potential using the Smoluchowski equation:32 | (1) |
 | ||
| Fig. 2 Streaming potential measurement apparatus. An HPLC cross-connects the input from the flow-through pressure transducer to waste and allows an electrode to measure the upstream end of the capillary (DAQ = data acquisition system). | ||
Cell cultures
All culture reagents were purchased from Invitrogen (Carlsbad, CA) unless otherwise noted. All cells were maintained in RPMI 1640 media (ATCC, Manassas, VA) supplemented with penicillin (100 IU ml−1) and streptomycin (100 μg ml−1). CATH.a (ATCC CRL-11179) neuron cell medium was also supplemented with L-glutamine (2 mM), horse serum (8%), and FBS (fetal bovine serum) (4%). U937 (ATCC, CRL-1593.2) histiocyte cell medium was also supplemented with heat-inactivated FBS (10%). Cells were incubated at 37 C in 5% CO2 and passaged every 3–4 days by subculturing at 1∶10 density. CATH.a cells were semiadherent (adherent cells were passaged with 0.25% trypsin); U937 cells were nonadherent.Cell imaging
Cells were imaged alternately using an inspection microscope consisting of a color CCD camera (Sony XC-999, Japan) mated to a long working distance objective (Mitutoyo) or an inverted fluorescence microscope (Zeiss Axiovert 135) with CCD attachment (Watec, Las Vegas, CA) and LCL-802H CCD board; fitted with a Diagnostic Instruments (Sterling Heights, MI) HRP042-CMT adapter.To evaluate the adhesion of silica surfaces with and without modification, cell suspensions were brought into contact with silica surfaces that were (a) untreated, (b) coated with the acrylate-terminated SAM, (c) coated with noncrosslinked polyacrylamide. Borosilicate glass coverslides were used as well as wet-etched glass chips (30 × 100 μm channels) in both Schott D263 borosilicate glass and fused silica.
For flow analysis, treated and untreated microscope slides were mated to an RC-26 cell perfusion chamber (Warner Instrument Corp., Hamden, CT) and imaged with a 20× microscope objective. Samples of suspended cells were washed with Hank’s Balanced Salt Solution (HBSS, 3×), and allowed to settle onto the microscope slides for 10 min, after which fresh HBSS was pumped through the chamber by a PHD 2000 syringe pump (Harvard Apparatus, Holliston, MA) for 30 s at 10 mL min−1. Images before and after flushing were recorded.
Chemical analysis
CATH.a neuron cell contents were processed off-column prior to analysis. Briefly, a sample of suspended cells was washed with HBSS (3×), suspended in lysis/separation buffer (100 mM borate, 60 mM SDS, pH 9.5), vortexed vigorously for 5 seconds, and filtered through 0.1 μm centrifuge filters (Millipore, Bedford, MA). The filtrate was reacted with naphthalene-2,3-dicarboxaldehyde (NDA, 1 mM), and KCN (1 mM) for 30 min prior to analysis. NDA is fluorogenic, i.e. fluorescent only after reaction with amines in the presence of KCN. Chip-based micellar electrokinetic chromatography (MEKC) was used to separate the derivatized samples. A 405 nm diode laser (Nichia, Mountville, PA) was imaged into the channel with a 40× objective, 7 cm from the double-tee injector. Epifluorescent signal was optically (470–550 nm band pass and holographic notch) and spatially (500 μm pinhole) filtered and imaged onto an R4632 photomultiplier tube (Hamamatsu, Bridgewater, NJ). Separation voltages were applied via home-built power supply; voltages and signal were controlled and collected using LabView. To enable the use of a pinched injection scheme, the separation column and injection channels were left with only the SAM coat and therefore supported electroosmotic flow. Samples were separated by applying 2000 V over a channel distance of 8 cm.Results and discussion
The cell coating technique described here is designed to enable patterning of surface charge and hydrophilicity in an arbitrary configuration. Unlike techniques that employ fluidic control33 in low-Reynolds number, laminar flow systems, photopatterning can straightforwardly pattern isolated regions that are unrelated to the streamlines of a laminar flow. The self-assembled monolayer covalently bonds to all areas of the silica surface following hydrolysis and condensation of the trimethoxy moiety. The exposed acrylate group is polymerized to the acrylamide in solution through local photoinitiation of radicals by the laser. The size of patterned features is typically 75 μm, which is approximately equal to the width of typical microfluidic channels used for cell analysis in our chips. Performance of the coating has been evaluated in several ways. First, zeta potential measurements were employed to evaluate surface charge through different stages of the coating process and evaluate coating life. Second, cell adhesion studies on glass microscope slides were used to evaluate the performance of the polyacrylamide in a repeatable, well-characterized geometry. Third, cell adhesion studies in glass microchips were used to evaluate the performance of a photopatterned coating on-chip. Finally, MEKC separations were performed to confirm that the SAM coating process does not degrade separation performance.Effects of silanization and polymerization on zeta potential
The SAM coating cannot react with all of the silanols, as the average distance between silanol groups on silica (0.4 nm, inferred from silanol site density34) is much smaller than the effective diameter of the acrylate SAM. Measurements of zeta potential using aqueous buffer show that the SAM leads to only a 10% reduction in zeta potential (Table 1) using buffer without ionic detergent, and a 15% increase in zeta potential using buffer with detergent. The detergent affects the zeta potential in two ways: first: the cation (sodium) associated with the lauryl sulfate ion increases the cation concentration, thus reducing the zeta potential; second, if the lauryl sulfate associates with the wall (this occurs only when the wall is coated with a hydrophobic SAM), the associated lauryl sulfates increase the wall charge density and increase the zeta potential. Results from this setup for buffered univalent cation solutions on untreated glass surfaces compare well with previous results, e.g.ref. 32, over a wide range of pH and ionic strength. Because zeta potential is only slightly reduced by application of the SAM, SAM-coated surfaces may be used for electroosmotic actuation of flow, and the electroosmotic flow schemes used to select and inject sample onto separation channels may still be employed. In this sense, the SAM coating protocol described here has little effect on the electrokinetic performance of silica microchannels.| Surface | Solution | Zeta Potential/mV |
|---|---|---|
| untreated silica | 1 mM phosphate buffer, pH 6.8 | −83 ± 3 (cf.ref. 32: −86) |
| SAM-coated silica | 1 mM phosphate buffer, pH 6.8 | −75 ± 3 |
| polyacrylamide-coated silica | 1 mM phosphate buffer, pH 6.8 | 0 ± 1 |
| untreated silica | 1 mM phosphate buffer, pH 6.8 + 4 mM SDS | −65 ± 9 |
| SAM-coated silica | 1 mM phosphate buffer, pH 6.8 + 4 mM SDS | −75 ± 12 |
Upon polymerizing with noncrosslinked polyacrylamide, the coating completely shields the silanol groups, presenting an uncharged but highly polar (hydrophilic) surface to the fluid (Table 1). Zeta potential is measured as zero to within the accuracy of the measurement, and the uncertainty in this zero value is approximately two orders of magnitude less than the zeta potential on untreated surfaces. Because the polymerization process dominates the changes in surface property, the patterning of the laser beam defines the effects of the coating process. The coating chemistry is not affected by impurities or crystal structure of the silica surface, as evidenced by results for zeta potential, which are similar for different types of glass and fused silica (data not shown).
Effects of silanization and polymerization on cell adhesion
Protein and cell adhesion at surfaces can occur from electrostatic effects or hydrophobic protein interactions. By removing surface charge and presenting a hydrophilic layer to the cells, adhesion is minimized or eliminated.Two experiments were performed to illustrate the effects of the self-assembled monolayer and the covalently linked polyacrylamide coating on cell adhesion. First, microscope slides were used to explore the effects of the coatings on cell adhesion in a well-defined, repeatable geometry. Second, a microchip with a triple-tee geometry was used to confirm the laser-patterning technique’s ability to spatially localize the polyacrylamide coating in a configuration useful of cell analysis.
Fig. 3 shows the effects on CATH.a cell adhesion on microscope slides of the SAM alone and SAM-linked polyacrylamide coating. Treated and untreated microscope slides were mated to a cell perfusion chamber by pressure mounting and sealing with vacuum grease. Samples of suspended CATH.a cells were allowed to settle onto the microscope slides for 10 min, after which fresh HBSS was pumped through the chamber for 30 s at 10 mL min−1. Cell adhesion is inferred from images of the microscope slides before and after flushing with solution. Adhesion results are dependent on cell line (Table 2)—some cell lines do not adhere to glass in any circumstance (e.g., Jurkat T-cells); other cell lines adhere to bare silica but show significant reduction of adhesion upon coating with polyacrylamide. For cell lines that adhere measurably to glass, the fraction of adhering cells was reduced by a factor of four to ten. Eliminating electrostatic adhesion by shielding the silanol groups strongly reduces cell adhesion.
 | ||
| Fig. 3 Imaging of CATH.a cell adhesion on untreated (bare silica), SAM-coated (acrylate-terminated), and laser-polymerized (polyacrylamide) cover slides. See experimental section for details. Images have been processed (high-pass filter) to highlight cell locations. | ||
| Cell line | Fraction of cell adhered to surface (bare silica) | Fraction of cells adhered to surface (polyacrylamide) |
|---|---|---|
| CATH.a | 1.05 ± 0.17 | 0.25 ± 0.24 |
| U937 | 0.99 ± 0.02 | 0.11 ± 0.07 |
| Jurkat T-cells | 0.05 ± 0.03 | 0.04 ± 0.03 |
In microchips, the polymer coating can be used to remove cell adhesion in a specific region of the chip designed for cell handling, while the rest of the chip is left unaffected so that electroosmotic injection schemes may still be used. A microchip in a triple-tee configuration was used to demonstrate this capability. This configuration anticipates the use of a double-tee configuration for electrokinetic injection and separation, with an additional microchannel used for single-cell transport using optical tweezers. One of the five ports on the chip was coated locally with polyacrylamide (Fig. 4a) using a projection lithography configuration. Images were recorded as flowing U937 cells were pumped (v = 1 cm s−1) through the coated microchannel to the rest of the chip, leading to adhesion and clogging in the uncoated regions. At the velocities used, only motionless cells are visible. Fig. 4b–e shows these results. As time passes, cells stick to uncoated areas; because the cell diameters are no more than 2–3 times smaller than the depth of the channel, these areas quickly become clogged. At no time did cells attach to the coated regions of the chip. The photopatterning technique allows specific regions of microchips to be coated for effective control of cell adhesion.
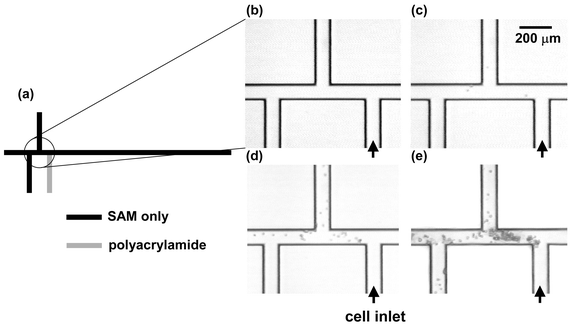 | ||
| Fig. 4 Time history of cell adhesion on triple-tee microchip selectively coated with polyacrylamide. All surfaces are coated with the SAM. (a) Shape of microchannel, showing imaged region as well as location of polyacrylamide coating; (b)–(e) sequential time history of cell adhesion. A U937 cell suspension is injected into the port at lower right (labeled cell inlet). All cells visible in images have adhered to wall or are motionless due to clogging—moving cells are completely blurred at this exposure time. Cells adhere and clog all channels without polyacrylamide, but they neither adhere to nor clog polyacrylamide-coated channels. Times of images; (b) t = 0 s; (c) t = 20 s; (d) t = 200 s; (e) t = 900 s. | ||
Effects of silanization and polymerization on separations
Effective cell analysis on chip requires both that cell adhesion is suppressed and that lysate separation techniques demonstrate good fidelity. MEKC separations were performed on SAM-coated and uncoated chips to demonstrate that changes in hydrophilicity or surface charge induced by the coating do not affect the fidelity of MEKC separations performed on the microchannel. Fig. 5 shows separations of a derivatized sample of CATH.a lysate on SAM-coated glass. A number of neurotransmitters are resolved as well as other primary amines. The retention time reproducibility (serine peak retention time RSD < 3%, n = 4) and separation performance were comparable to those for MEKC on silica devices (inset). The previously observed increase in zeta potential, and thus reduction in retention time, with the SAM coating may also be inferred from the reduced elution times on SAM-coated chips, presumably arising from interaction between the ionic detergent (SDS) and the SAM coating.35 | ||
| Fig. 5 MEKC separation of primary amines from a multiple-cell CATH.a neuron cell lysate on glass treated with the SAM. NE: norepinephrine. Inset: separations under the same conditions using bare glass. Separation fidelity and retention time repeatability are similar in the two cases; increases in zeta potential caused by wall–detergent interactions upon coating with SAM lead to reduced elution times in the SAM-coated case. | ||
Coating life
Coatings have been tested at biological pH over the course of several months without sign of degradation. Zeta potential observed with pH = 7 solutions has remained indistinguishable from zero after overnight treatment with aqueous solutions ranging from 2.7–10.3. At acidic and basic pH within this range, small departure from zero has been observed (ζ = +1 mV at pH 2.7, ζ = −2 mV at pH 10.3), but this wall charge disappears upon return to biological pH. Extreme pH solutions (e.g., 1 M HCl or NaOH) do lead to degradation in coating performance when applied for 5 minutes or more, as has been observed elsewhere.28Conclusions
Techniques for facilitating microfluidic cell analysis by spatially patterning thin, non-crosslinked polyacrylamide films have been presented. Tests on CATH.a and U937 cells demonstrate that cell adhesion can be significantly suppressed. Streaming potential measurement of zeta potential indicates that wall charge can be reduced by two orders of magnitude. The spatial resolution of this technique enables programmable modification of wall charge, which can be applied for a variety of purposes, including modification of cell adhesion and generation of microfluidic mixers.Acknowledgements
The authors would like to thank R. N. Renzi and G. B. Sartor of Sandia National Laboratories for their assistance and technical expertise and R. J. Whelan of Stanford University for graciously providing the U937 cells used in this work. A.R.W. and R.N.Z. would also like to thank Beckman Coulter for financial support for part of this work.References
- J. P. Kutter, S. C. Jacobson and J. M. Ramsey, Anal. Chem., 1997, 69, 5165–5171 CrossRef CAS.
- A. Manz, D. J. Harrison, E. M. J. Verpoorte, J. C. Fettinger, A. Paulus, H. Ludi and H. M. Widmer, J. Chromatogr., 1992, 593, 253–258 CrossRef CAS.
- D. J. Harrison, A. Manz, Z. H. Fan, H. Ludi and H. M. Widmer, Anal. Chem., 1992, 64, 1926–1932 CrossRef.
- S. C. Jacobson, C. T. Culbertson, J. E. Daler and J. M. Ramsey, Anal. Chem., 1998, 70, 3476–3480 CrossRef CAS.
- Z. H. Liang, N. Chiem, G. Ocvirk, T. Tang, K. Fluri and D. J. Harrison, Anal. Chem., 1996, 68, 1040–1046 CrossRef.
- H. J. Crabtree, S. J. Bay, D. F. Lewis, J. Z. Zhang, L. D. Coulson, G. A. Fitzpatrick, S. L. Delinger, D. J. Harrison and N. J. Dovichi, Electrophoresis, 2000, 21, 1329–1335 CrossRef CAS.
- G. F. Jiang and D. J. Harrison, Analyst, 2000, 125, 2176–2179 RSC.
- M. U. Kopp, A. J. deMello and A. Manz, Science, 1998, 280, 1046–1048 CrossRef CAS.
- L. C. Waters, S. C. Jacobson, N. Kroutchinina, J. Khandurina, R. S. Foote and J. M. Ramsey, Anal. Chem., 1998, 70, 158–162 CrossRef CAS.
- L. C. Waters, S. C. Jacobson, N. Kroutchinina, J. Khandurina, R. S. Foote and J. M. Ramsey, Anal. Chem., 1998, 70, 5172–5176 CrossRef CAS.
- J. Khandurina, T. E. McKnight, S. C. Jacobson, L. C. Waters, R. S. Foote and J. M. Ramsey, Anal. Chem., 2000, 72, 2995–3000 CrossRef CAS.
- G. R. Fuhr and C. Reichle, Trends Anal. Chem., 2000, 19, 402–409 CrossRef CAS.
- S. Takayama, E. Ostuni, P. LeDuc, K. Naruse, D. E. Ingber and G. M. Whitesides, Nature, 2001, 411, 1016–1016 CrossRef CAS.
- D. T. Chiu, N. L. Jeon, S. Huang, R. S. Kane, C. J. Wargo, I. S. Choi, D. E. Ingber and G. M. Whitesides, Proc. Natl. Acad. Sci. USA, 2000, 97, 2408–2413 CrossRef CAS.
- S. N. Krylov and N. J. Dovichi, Electrophoresis, 2000, 21, 767–773 CrossRef CAS.
- K. Smetana, J. Lukas, V. Paleckova, J. Bartunkova, F. T. Liu, J. Vacik and H. J. Gabius, Biomaterials, 1997, 18, 1009–1014 CrossRef CAS.
- K. M. Defife, K. M. Hagen, D. L. Clapper and J. M. Anderson, J. Biomater. Sci.—Polym. Ed., 1999, 10, 1063–1074 CAS.
- T. Matsuda and T. Sugawara, J. Biomed. Mater. Res., 1996, 32, 165–173 CrossRef CAS.
- T. J. Johnson, D. Ross, M. Gaitan and L. E. Locascio, Anal. Chem., 2001, 73, 3656–3661 CrossRef CAS.
- Y. N. Xia and G. M. Whitesides, Annu. Rev. Mater. Sci., 1998, 28, 153–184 Search PubMed.
- S. Hjerten, Chromatogr. Rev., 1967, 9, 122 Search PubMed.
- M. Gilges, M. H. Kleemiss and G. Schomburg, Anal. Chem., 1994, 66, 2038–2046 CrossRef CAS.
- T. S. Wang and R. A. Hartwick, J. Chromatogr., 1992, 594, 325–334 CrossRef CAS.
- C. S. Dulcey, J. H. Georger, V. Krauthamer, D. A. Stenger, T. L. Fare and J. M. Calvert, Science, 1991, 252, 551–554 CAS.
- F. K. Perkins, E. A. Dobisz, S. L. Brandow, J. M. Calvert, J. E. Kosakowski and C. R. K. Marrian, Appl. Phys. Lett., 1996, 68, 550–552 CrossRef CAS.
- C. K. Harnett, K. M. Satyalakshmi and H. G. Craighead, Appl. Phys. Lett., 2000, 76, 2466–2468 CrossRef CAS.
- G. J. M. Bruin, J. P. Chang, R. H. Kuhlman, K. Zegers, J. C. Kraak and H. Poppe, J. Chromatogr., 1989, 471, 429–436 CrossRef CAS.
- S. Hjerten, J. Chromatogr., 1985, 347, 191–198 CrossRef.
- H. Engelhardt and M. A. Cunatwalter, J. Chromatogr. A, 1995, 716, 27–33 CrossRef CAS.
- M. X. Huang and M. L. Lee, J. Microcolumn Sep., 1992, 4, 491–496.
- M. T. Dulay, J. P. Quirino, B. D. Bennett, M. Kato and R. N. Zare, Anal. Chem., 2001, 73, 3921–3926 CrossRef CAS.
- P. J. Scales, F. Grieser, T. W. Healy, L. R. White and D. Y. C. Chan, Langmuir, 1992, 8, 965–974 CrossRef CAS.
- D. J. Beebe, J. S. Moore, Q. Yu, R. H. Liu, M. L. Kraft, B. H. Jo and C. Devadoss, Proc. Natl. Acad. Sci. USA, 2000, 97, 13488–13493 CrossRef CAS.
- A. Burneau, O. Barres, J. P. Gallas and J. C. Lavalley, Langmuir, 1990, 6, 1364–1372 CrossRef CAS.
- Q. Wu, H. A. Claessens and C. A. Cramers, Chromatographia, 1992, 33, 303–308 CAS.
| This journal is © The Royal Society of Chemistry 2003 |