A microchip-based proteolytic digestion system driven by electroosmotic pumping
Lian Ji
Jin
a,
Jerome
Ferrance
a,
Joshua C.
Sanders
a and
James P.
Landers
*ab
aDepartment of Chemistry, McCormick Road, University of Virginia, Charlottesville, VA 22904, USA. E-mail: landers@virginia.edu; Fax: 434-982-3048; Tel: 434-243-8616
bDepartment of Pathology, University of Virginia Health Science Center, Charlottesville, VA 22904, USA
First published on 16th January 2003
Abstract
Microchip-based proteomic analysis requires proteolytic digestion of proteins in microdevices. Enzyme reactors in microdevices, fabricated in glass, silicon, and PDMS substrates, have recently been demonstrated for model protein digestions. The common approach used for these enzyme reactors is employment of a syringe pump(s) to generate hydrodynamic flow, driving the proteins through the reactors. Here we present a novel approach, using electroosmotic flow (EOF) to electrokinetically pump proteins through a proteolytic system. The existence of EOF in the proteolytic system packed with immobilized trypsin gel beads was proven by imaging the movement of a neutral fluorescent marker. Digestions of proteins were subsequently carried out for 12 min, and the tryptic peptides were analyzed independently using capillary electrophoresis (CE) and MALDI-TOF mass spectrometry (MS). The results from CE analysis of the tryptic peptides from the EOF-driven proteolytic system and a conventional water bath digestion were comparable. MALDI-TOF MS was used to identify the parent protein and the tryptic peptides using MS-Fit database searching. The potential utility of the EOF-driven proteolytic system was demonstrated by direct electro-elution of proteins from an acrylamide gel into the proteolytic system, with elution and tryptic digestion achieved in a single step. The EOF-driven proteolytic system, thus, provides a simple way to integrate protein digestion into an electrophoretic micro total analysis system for protein analysis and characterization.
Introduction
The evolution of the micro-total analysis systems (μ-TAS)1 or lab-on-a-chip concepts of a decade ago into the more sophisticated platforms described in recent years, reflects the ever-growing interest in developing multi-functional microdevices for chemical and biological analysis. For example, a sophisticated lab-on-a-chip system was demonstrated for DNA analysis whereby PCR amplification, DNA separation, and fluorescence detection all were integrated into a single closed system.2,3 A continuous multi-chemical processing chip with 2D and 3D microchannel networks has recently been reported that can be applied to various chemical and molecular analyses as well as for chemical synthesis.4Developing microdevices for proteome research has been a growing interest as well. This is evidenced by the development of microchip format SDS-PAGE5–8 and IEF,9–12 two popular protein analysis tools, which also represent singular separation dimensions of 2D-gel electrophoresis, a well-established tool for current proteomics research. In addition, the development of microchips, with or without integrated enzyme reactors, that could be coupled to electrospray ionization mass spectrometry (ESI/MS) via tapered tips, begins to fully exploit the unparalleled power of mass spectrometry detection in protein/peptide analysis and characterization.6,13–19 As the integral part between microchip and mass spectrometry, novel spray nozzles have also been demonstrated, including both microfabricated and non-microfabricated designs.20–22
Microchip-based proteomic analysis will require that proteolytic digestion of proteins be carried out in microdevices. Prototype microfabricated enzyme reactors, in glass, silicon, and PDMS substrates, have been reported by a number of groups.13,23,24 In an elegant report, Wang et al.13 demonstrated a microfabricated glass reactor bed packed with immobilized trypsin gel beads for microchip-based protein digestion. Proteins were driven through the enzyme reactor by a syringe pump attached to the microdevice, generating a hydrodynamic flow of 0.5 or 1 μl min−1; this corresponds to 6 or 3 min for the digestions. Ekstrom et al.23 demonstrated an enzyme reactor fabricated in a porous structure silicon wafer, to which enzymes were immobilized using a 34 h three-step procedure. Rapid digestion of model proteins, carried out within 1–3 min, was characterized by MALDI-TOF mass spectrometry. Gao et al.24 fabricated a microchannel in a poly(dimethylsiloxane) (PDMS) substrate, which was coupled to a trypsin-enriched poly(vinylidene fluoride) (PVDF) membrane. Syringe pumps were used to transport proteins through the membrane reactor; sample flow rates of 0.3, 0.2, and 0.1 μl min−1 corresponded to digestion times of 3, 5, and 10 min.
As we envision integrated electrophoretic microdevices, devices where multiple processes (including sample preparation) are integrated into the same devices used for analysis, electrokinetic movement of analytes between microchannels and microreactors will be the mode for microfluidic control. For proteomic analyses, one could envision an integrated device that seamlessly connects one or two upstream separation domains directly with the enzyme-based reactor that delivers peptides to a downstream separation dimension coupled to a mass spectrometry detector. Electrokinetically connecting the enzyme reactor with the up- and downstream separation dimensions, therefore, presents the simplest method for continuous movement of materials on the microdevice. As tryptic digestions are carried out at slightly basic pH, the necessary electroosmotic flow (EOF) is present in glass substrate enzyme reactors. Regardless of the charge on the proteins and peptides, the EOF, like the hydrodynamic flow generated from a syringe pump, should sweep the proteins through the reaction chamber.
To simplify microchip fabrication and obviate tedious enzyme immobilization steps within the device, Wang’s approach13 using a microfabricated enzyme reactor bed packed with replaceable enzyme gel beads is an ideal initial design. Before integrating the enzyme reactor with up- or downstream separation dimensions, however, the process of EOF-mediated microchip protein digestion needs to be understood. Since microfabricated glass chambers will be packed with immobilized gel beads 40–60 μm in diameter, chamber dimensions larger than 100 μm are needed. Electroosmotic flow is known to exist in unmodified fused silica capillaries or glass microchannels (dimensions typically smaller than 100 μm), originating from the negative charge on the inner wall. However, the effects of the larger chamber size and the presence of the gel beads on both the EOF and the flow pattern are not clear.
This report presents our investigation of EOF-mediated proteolytic digestion of protein in a glass microchip proteolytic system, as preparation for integration of an enzyme reactor into a protein μ-TAS. This approach should be feasible, with the advantage that it requires no additional mechanical components, only electrical contact. The existence and magnitude of EOF in these devices was first examined, followed by the ability to digest proteins during EOF transport through an immobilized trypsin bed. Mass spectrometric analysis of tryptic peptides collected at the outlet of the reactor chamber was carried out to determine if protein identification was possible. The success of electroosmotic flow-driven mobilization of the sample protein through the enzyme bed in a microdevice presented the possibility that electro-elution and digestion of protein directly from a protein gel in the reactor chamber could be accomplished. This was explored as a possible approach to performing microchip-based elution and digestion of protein in a single step.
Experimental
Micro reaction chamber fabrication
The micro reaction chamber, illustrated in Fig. 1A, was fabricated using the method previously described.5 The micro reaction chamber was formed by thermally bonding a deeply etched top plate to a shallowly etched bottom plate. The chamber on the top plate was 980 μm wide × 240 μm deep × 12.7 mm long. The chamber on the bottom plate was of the same width and length as the chamber on the top plate, but of a shallower depth (18 μm). Additionally, on the bottom plate, a narrow channel, 108 μm wide × 18 μm deep × 4 mm long, was fabricated between the reaction chamber and the outlet reservoir. An access hole for the inlet reservoir was drilled 1 mm from the reaction chamber. Both inlet and outlet access holes were 2 mm in diameter, with plastic rings epoxied around the holes to increase the buffer volumes in the reservoirs.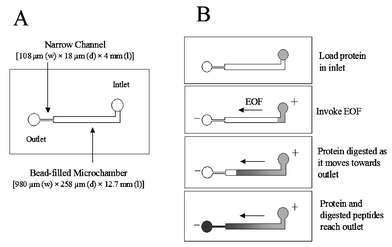 | ||
| Fig. 1 The microchamber. (A) Schematic of a microchamber reactor. (B) Schematic showing the process of protein mobilization via EOF and enzymatic digestion of the protein en route to the outlet. | ||
Reagents and preparations
Buffer electrolytes and reagents were obtained from various suppliers. BODIPY® FL propanol (4,4-difluoro-5,7-dimethyl-4-bora-3a,4a-diaza-s-indacene-3-propanol) was purchased from Molecular Probes (Eugene, OR). Peptide standards, proteins, and trypsin were obtained from Sigma (St. Louis, MO). Immobilized trypsin gel beads was purchased from Pierce (Rockford, IL). Ultrogel (20000–350000, used for gel filtration chromatography) was a product of Reactifs IBF Pharmindustrie (France). B-Phycoerythrin was purchased from Intergen (Purchase, NY). Ultra-pure agarose was a product of Life Technologies TM (Grand Island, NY, produced in Spain). Acrylamide was obtained from Sigma. CE-SDS sample buffer was from the Bio-Rad protein kit (Hercules, California). BODIPY® stock solution was prepared at 10−3 M in water and diluted with digestion buffer to the desired concentrations when used. Peptide standards were reconstituted according to the procedure recommended by the manufacturer. Proteins and trypsin were dissolved in digestion buffer (0.1 M NH4HCO3, pH 8.0) at desired concentrations and stored in the freezer.Microchamber conditioning and packing
The microchamber was conditioned by flushing with 100 μl each of 1 M NaOH, H2O, and digestion buffer. The microchamber packed bed was prepared by applying vacuum at the outlet while filling the inlet reservoir with gel suspension. Beads, either immobilized trypsin gel beads or Ultrogel beads, were washed with digestion buffer three times before packing into the microchamber.Imaging and measurement of electroosmotic flow
The imaging of electroosmotic flow within the microchamber was performed using a 488 nm argon ion laser (Laser Physics, Salt Lake City, UT) deflected upwards by a mirror at an angle of 30° onto the microchip. The laser was defocused so that a large spot size was formed in an elliptical fashion with the major axis of the ellipse being approximately 1.2 cm. Detection of fluorescence emission from the sample, as well as imaging of the entire chamber, employed a CCD camera (World Precision Instruments, Sarasota, FL) with a wide-angle lens (Navitar, Rochester, NY). A band-pass filter (Melles Griot, Rochester, NY), between the lens and the camera, filtered out stray laser light. Video capture was performed with a video capture device (Dazzle Multimedia, Fremont, CA). The microchamber was conditioned and packed with immobilized gel beads. The BODIPY® neutral fluorescent marker (5 × 10⁻⁴ M) was loaded in the inlet reservoir and the outlet reservoir was filled with digestion buffer. A potential of 500 V was applied to the inlet reservoir with the outlet reservoir held at ground, and images of the flow were taken every 30 seconds or as required.Measurements for calculating the strength of the EOF were taken using a microchip electrophoresis system with laser-induced fluorescence detection as described previously.5 Single point detection of the BODIPY® dye at a point 5 mm from the injection reservoir was performed as the dye moved through the microchamber. The microchamber was packed with gel beads, the outlet reservoir loaded with digestion buffer and the inlet reservoir loaded with 10−7 M BODIPY®. For EOF measurements, a potential of 500 V was applied to the inlet with the outlet held at ground. The point at which the baseline began to increase was selected as the time used for the EOF calculation.
Microchamber and water bath digestions
Microchamber digestions were performed on a set-up similar to the system described previously5 without the optical detection system in place. The electrode interface with flexible adjustment was built in-house. After microchamber conditioning and bead packing, the digestion buffer was loaded in the outlet and the protein sample in the inlet. The electrode interface was then placed across the microchamber and an electric potential of 1 kV was applied to the inlet for the desired time program, with the outlet held at ground. The outlet solution was collected for analysis and characterization by capillary electrophoresis and MALDI-TOF mass spectrometry. For microchamber digestion, 20 μl of a 1 mg ml−1 protein sample was loaded into the inlet.Water bath digestion was carried out according to a routine protocol.17 The protein concentration was prepared at 1 mg ml−1 and trypsin stock solution was diluted to 25 μg ml−1. A 100 μl protein sample was mixed with an equal volume of tryspin in a locking eppendorf centrifuge tube and set in water bath at 37 °C for 18 h. The digest was acidified with acetic acid for CE-UV detection. In the case of bovine serum albumin, dithiothreitol was added and allowed to sit for 30 min at room temperature before digestion.
Capillary electrophoresis with UV detection
Capillary electrophoretic separations of tryptic peptides were performed using a Hewlett-Packard 3D CE with a UV detector. A peptide standard was routinely run at the beginning of the day or between separations as a control for the peptide separation conditions. Conditions for the capillary electrophoresis were: bare silica capillary, 50 μm i.d.; effective/total length, 25/33 cm; detection at 200 nm; separation buffer, 50 mM phosphate, pH 2.5; injection, 50 mbar 10 s; separation voltage, 18 kV.MALDI-TOF mass spectrometry and peptide mass mapping
Peptide masses were acquired using a MALDI-TOF mass spectrometer (PE Biosystems Voyager DE-Pro) with delayed extraction and reflectron optics. Samples were mixed with a matrix, α-cyanohydroxycinnamic acid for peptides or sinapinic acid for proteins, and dried on targets.25 Tryptic peptides collected from the outlet were concentrated or diluted as described in the figures.Peptide masses obtained from MALDI-TOF-MS were searched against MS-Fit to identify the parent protein. Search parameters were: protein molecular range, 1000 Da to 100000 Da; pI values, 3 to 10; MALDI-TOF-MS monoisotopic peptide masses; peptide mass tolerance, 400 ppm; maximum number of missed cleavage, 1; cysteines, unmodified; peptide N terminus, hydrogen; C terminus, free acid.
Protein gel elution and digestion
For protein gel elution and migration, B-phycoerythrin was prepared at a concentration of 2 mg ml−1 in 1× TBE (89 mM Tris, 89 mM Borate, 2 mM EDTA, pH 8.5) buffer, 30 μl of this protein sample was loaded into agarose gel sample wells and electrophoresed into a 1% agarose gel. The agarose gel was rinsed with H2O and the gel band excised with a razor. A fraction of the gel plug was then loaded into the microchamber inlet reservoir and a potential of 1 kV was applied for 1 h. Buffer in both the inlet and outlet were collected for CE-LIF detection of B-phycoerythrin. Capillary electrophoresis with laser induced fluorescence detection conditions were: Beckman CE system 5510; bare silica capillary, 20/27 cm effective/total lengths; separation buffer, 20 mM borate at pH 9.1 with 5 mM SDS; excitation/emission, 488/590 nm; voltage, 15 kV; pressure injection, 3 s. For protein gel elution and digestion, 3 mg β-casein was polymerized into 100 μl of 10% acrylamide gel in Tris buffer (pH 8), the blank gel as negative control was prepared in the same way; the outlet reservoir was collected for detection of tryptic peptides; the microchamber digestion and CE-UV detection were performed as described in previous sections.Results and discussion
In a manner similar to that defined by Wang et al.,13 the microchamber was designed to accommodate easy packing and replacement of the enzyme gel beads using a vacuum pump. The microchamber design and dimensions were, however, different from those described by Wang et al.13 In our design, the wide channel was etched in both the bottom and top plates (980 μm wide) but etched to different depths (240 μm on top vs. 18 μm on bottom). In contrast, the reported design13 only used a wide channel in the top plate (800 μm wide × 150 μm deep)—the bottom plate was a narrow channel (30 μm wide × 10 μm deep) for the majority of the length. The narrow channels adjacent to the wide channels were very similar in function—both served as a blockade to keep the gel beads from being swept out of the channel either by syringe pump13 or by the electroosmotic flow described here, while still maintaining electrical contact between the outlet reservoir and the microchamber. The difference between the two narrow channels was in the channel width where the design reported here was substantially narrower (108 μm) than that used by Wang et al.13 (230 μm). In our microchip, the total microchamber bed volume was calculated to be ∼2 μl, which translates to ∼21000 beads if a 30% void volume is assumed (Fig. 1A). It is noteworthy that there is no operational difference between the two designs.Proof of electroosmotic flow and its magnitude
The anticipated scheme is shown in cartoon form in Fig. 1B where the protein (light gray) placed in the inlet reservoir is driven into the microchamber by EOF where, upon exposure to the trypsin-conjugated beads, digestion occurs and peptides are generated (dark gray). As digestion ensues, protein is consumed, more peptide is generated, and the peptides begin to move into the outlet reservoir. Clearly, EOF is the keystone to the function of this system.Based on the microchip literature and our experience with these devices, microfabricated glass devices have surface behavior similar to fused silica capillaries, with silanol groups generated on the glass surface using the same protocols employed for capillaries. Thus, EOF, the plug flow which exists universally in capillaries, also exists in microfabricated glass channels. However, large microchannels (>100 μm) are not routinely utilized in electrophoretic microchips, therefore, the EOF behavior and flow patterns at this scale were not clear.
To evaluate the magnitude of EOF in the microchip and flow profile within a microchamber, fluorescence imaging was carried out using a neutral fluorescent marker ideal for monitoring the EOF. The neutral fluorescent marker, BODIPY® FL propanol (which has no electrophoretic mobility), was loaded into the inlet reservoir and a potential applied. As shown in Fig. 2A, the fluorescent dye was rapidly swept towards the outlet, with the speed dependent on the magnitude of the applied potential. Movement is clearly seen between 30 and 60 s, with the excitation laser spot exceeded by 90 s. This indicated that the substantial EOF that existed was pumping dye through the packed bed. To confirm that this was the result of EOF-induced pumping and not simply siphoning, the experiment was repeated without an applied potential (Fig. 2B)—no fluorescence was observed in the monitoring window even after 20 min. Application of an electric potential after this extended period of time (Fig. 2C) re-established the flow, again almost completely filling the microchamber after 90 s. This confirmed that a significant EOF existed in the packed reaction chamber. This set of experiments also allowed for a crude visualization of the flow profile. As expected, it is not perfect plug flow, as some initial streaming is seen, but most importantly, the overall flow appears to be across the entire width of the channel, which should be sufficient to allow the bound enzyme access to the target proteins. A single point detection was performed for calculation of EOF, which revealed an EOF magnitude of 4.5 × 10⁻⁵ cm2 V−1 s−1 (n = 5; S.D. = 1.4 × 10⁻⁶; %RSD = 3.1).
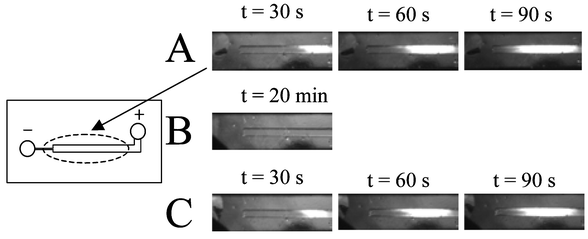 | ||
| Fig. 2 Proof of electroosmotic pumping in microchamber packed with immobilized gel beads. Left—schematic of the microchip and the area viewed by microscopy. Right—(A) Image of neutral fluorescent marker BODIPY® FL propanol (1 mM) at 30, 60, and 90 s after application of electrical potential. Applied potential: inlet, 500 V, outlet, ground. (B) No marker observed in 20 min without application of potential. (C) Extension of experiment in (B) where the fluorescent marker is observed again at 30, 60, and 90 s after reapplication of potential (500 V). | ||
Trypsin digestion of β-casein
To test the ability of the EOF-driven proteolytic system to carry out trypsin digestion of proteins, β-casein, a rod-like protein from bovine milk with a molecular weight of 25 kDa, was chosen. This protein has been observed to undergo rapid digestion (less than 30 min) in a trypsin-modified capillary microreactor.26 It has also been demonstrated that, by simply eluting β-casein through a Pyrex tube (30 cm × 1 mm i.d.) packed with immobilized trypsin gel beads, digestion occurred and was detectable by either HPLC or CZE separations.27 Using our microchip-based proteolytic system, tryptic peptides removed from the chip outlet after 12 min of electrophoresis at 1 kV were detectable by capillary electrophoresis with UV detection (Fig. 3A and B). Having observed this, two mobilization schemes were investigated: ‘continuous flow’ and ‘park-and-flow’. The park-and-flow mode involved interrupting the applied electric potential (for 1 min) two times (at regular intervals) during the 12 min electrophoresis to facilitate sufficient interaction between the enzymes and proteins. It was hypothesized, in a manner analogous to that described by Klein and Jolliff28 that this would allow better access of the enzyme to the protein to enhance proteolysis (Fig. 3A). In contrast, the continuous flow mode was carried out by applying potential without interruption for 12 min and was expected to show poorer digestion (Fig. 3B). Surprisingly, as shown in Fig. 3, park-and-flow and continuous flow modes generated very similar digestion patterns, indicating that park-and-flow did not significantly increase the amount of protein digested. Consequently, the park-and-flow mode was not pursued further in subsequent digestions.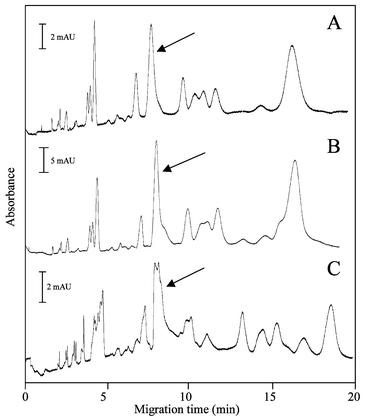 | ||
| Fig. 3 CE analysis of microchip proteolyzed β-casein. (A) Microchamber digestion at ambient temperature using immobilized trypsin gel beads with the ‘parking’ method; potential (1 kV) applied for three 4 minute periods interspersed with two 1 min periods with no potential. (B) Microchamber digestion at ambient temperature using immobilized trypsin gel beads without parking (‘continuous flow’); potential applied for 12 min. (C) Positive-control. Free solution trypsin digestion in water bath at 37 °C for 18 h. The arrows indicate peaks representing intact, undigested β-casein. See text for CE conditions. | ||
It is noteworthy that the digestions illustrated in Fig. 3A and B were produced in 12 min at ambient temperature using gel beads packed into a microchamber. These profiles are similar to that generated by an 18 h water bath digestion at 37 °C (Fig. 3C), indicating that microchamber proteolysis is no less effective. The arrow in Fig. 3 shows the peak representing the parent protein (confirmed by spiking experiments) indicating that some undigested protein reached the outlet. Differences between the electropherograms from the microchip-digested and the solution-digested samples could not be further evaluated using the present techniques.
It is noteworthy that additional experiments were performed to compare different protocols. Trypsin-bound gel beads and β-casein were mixed together and transferred into two eppendorf tubes, one of which was mixed manually for 12 min at room temperature, while the other was placed in a shaking water bath for 12 min at 37 °C. Interestingly, subsequent CE analysis yielded digestion patterns that were all very similar to Fig. 3A and B. This indicates that the three protocols for β-casein digestion (manual mixing at room temperature, EOF-driven microchamber digestion at room temperature, and shaking water bath digestion at 37 °C) were equally efficient for β-casein. As a result, the manual mixing protocol was frequently used as a control method.
Trypsin digestion of cytochrome C
Cytochrome C is a globular protein from bovine heart with a molecular weight of 12.2 kDa. Using the same protocol described for β-casein, cytochrome C was digested in the microchamber with the tryptic peptides collected at the outlet reservoir. The peptides were analyzed by CE, and the electrophoretic pattern was similar to that shown in the literature29 (data not shown). Full peptide mass spectra acquired by MALDI-TOF mass spectrometry of the peptides collected at the outlet are shown in Fig. 4A. MS-Fit database searching indicated that nine peptide masses in the spectrum matched theoretical fragments given the mass tolerance of 600 ppm. The mass tolerance is set much higher than the expected mass accuracy (200 ppm), but is justifiable considering the mass discrepancy between two duplicate mass spectra of the same sample. The negative control (Fig. 4B), prepared by migrating cytochrome C through the microchamber packed with Ultrogel beads, showed no digestion, as expected, because no enzyme was present on the Ultrogel beads. This was confirmed by the MALDI-TOF mass spectrum shown in Fig. 4B, where only a singly-charged protein molecular ion (M + H+) at m/z 12225.62, a doubly-charged ion at m/z 6113.55, and a triply-charged ion at m/z 4078.01 were observed.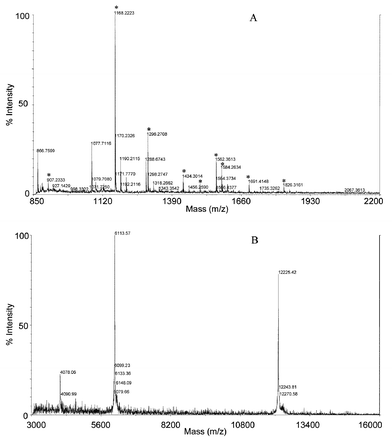 | ||
| Fig. 4 Trypsin digestion of cytochrome C. (A) Microchamber digestion using immobilized trypsin gel beads. Digestion conditions as Fig. 3(B). (B) Negative-control. Cytochrome C migrated through microchamber packed with Ultrogel (20000–300000) gel beads. MALDI-TOF mass spectrometry conditions: see text. | ||
The room temperature manual mixing digestion protocol described for β-casein was also attempted with cytochrome C, however, no tryptic peptides were observed, indicating that no digestion occurred. The results with cytochrome C, a globular protein digestable by the microchamber approach but not by the manual mixing protocol, indicate that an additional mechanism might contribute to the digestion process. Under the influence of an electric field, the protein tertiary structure may undergo conformational changes that distort the structure, and possibly expose more of the target peptide bonds required for enzymatic cleavage. This observation is consistent with a report that cytochrome C was not digested in a capillary microreactor without the mixing induced by a piezoelectric device.27 Therefore, the electroosmotic pumping may not only provide the driving force for protein migration but the electric field effects might also provide additional forces that aid in protein digestion as well. This is clearly an advantage of the EOF-mediated proteolytic system that cannot be obtained with an approach that utilizes a pressure-driven flow for digestion.13
Trypsin digestion of bovine serum albumin
Trypsin digestion of large proteins in an EOF-driven proteolytic system was investigated using bovine serum albumin (BSA), a 69 kDa protein containing 35 cysteine residues with only one of these free. To disrupt the disulfide bonds of this protein, reduction of the BSA with dithiothreitol was carried out before digestion. Once again, tryptic peptides were analyzed by CE (data not shown) as well as attaining full peptide mass spectra by MALDI-TOF mass spectrometry (Fig. 5A). As a positive control, the full peptide mass spectrum of a conventional water bath digestion of BSA was also acquired (Fig. 5B). A number of peptide masses in Fig. 5A match those in Fig. 5B, providing additional evidence that microchamber digestions driven by EOF were taking place.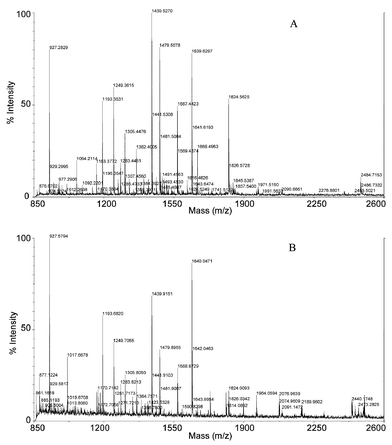 | ||
| Fig. 5 Trypsin digestion of bovine serum albumin. (A) Microchamber digestion with immobilized trypsin gel beads. Digestion conditions as Fig. 3(B). (B) Positive-control. Free solution trypsin digestion in water bath at 37 °C for 18 h. MALDI-TOF mass spectrometry conditions: see text. | ||
To determine if the tryptic peptides generated in the microchamber digestion were sufficient for protein identification purposes, peptide masses in Fig. 5A were submitted to MS-Fit database searching. Peptide masses in Fig. 5B were also submitted simultaneously as a positive control. The search results showed that the microchamber digestion correctly identified the parent protein, as did the conventional method (Table 1). Twelve tryptic peptides from the microchamber digestion were attributed to BSA while only ten tryptic peptides were attributable to BSA with the water bath digestion procedure. Thus, the microchamber digestion generated more peptide fragments than the conventional digestion, and the mass spectrum obtained from the microchamber digestion is much cleaner in the mass range of 1900–2600. Table 2 lists the determined peptide masses in Fig. 5A and B used for the MS-Fit search as well as the calculated peptide masses obtained from MS-Fit. The sequence coverage for the microchamber digestion was calculated to be 23%, higher than for the positive control, which was 19% under current experimental conditions. Note that the peptide mass tolerance was set to 400 ppm because duplicate mass spectra had a measured mass difference of 398 ppm for the calculated peptide mass of 1823.900.
| # % Masses | Accession # | Source, protein name | |
|---|---|---|---|
| MS-Fit query parameters: protein molecular range, 1000 Da to 100000 Da; pI values, 3 to 10; MALDI-TOF-MS monoisotopic peptide masses; peptide mass tolerance, 400 ppm; maximum number of missed cleavages, 1; cysteines, unmodified; peptide N terminus, hydrogen; C terminus, free acid. | |||
| Fig. 5A | 12/18 (66%) | P02769 | Bovine, serum albumin precursor |
| Fig. 5B | 10/21 (47%) | P02769 | Bovine, serum albumin precursor |
| Measured molecular weight, (M + H)+/Da (Fig. 5A) | Measured molecular weight, (M+H)+/Da (Fig. 5B) | Peptide sequence | Calculated molecular weight, (M + H)+/Da |
|---|---|---|---|
| 927.2829 | 927.5794 | YLYEIAR | 927.493 |
| 977.2906 | NECFLSHK | 977.451 | |
| 1017.6678 | |||
| 1145.8303 | AWSVARLSQK | 1145.6431 | |
| 1170.7142 | |||
| 1064.2114 | |||
| 1092.2201 | |||
| 1193.3531 | 1193.6820 | DTHKSEIIAHR | 1193.602 |
| 1249.3615 | 1249.7065 | FKDLGEEHFK | 1249.621 |
| 1283.4461 | 1283.8213 | HPEYAVSVLLR | 1283.711 |
| 1305.4476 | 1305.8050 | HLVDEPQNLIK | 1305.716 |
| 1327.4171 | |||
| 1362.4005 | SLHTLFGDELCK | 1362.672 | |
| 1439.5270 | 1439.9151 | RHPEYAVSVLLR | 1439.812 |
| 1479.5078 | 1479.8955 | LGEYGFQNALIVR | 1479.795 |
| 1491.4563 | |||
| 1567.4423 | DAFLGSFLYEYSR | 1567.743 | |
| 1568.8729 | |||
| 1639.6297 | 1640.0471 | KVPQVSTPTLVEVSR | 1639.938 |
| 1662.0410 | |||
| 1668.4963 | 1667.813 | ||
| 1814.0892 | |||
| 1824.5625 | 1824.0093 | RPCFSALTPDETYVPK | 1823.900 |
| 1964.0594 | |||
| 2484.7153 | 2484.146 | ||
| 2074.9609 | |||
| 2191.9400 | |||
| 2040.1748 | |||
| 2503.1680 | |||
| 2628.2724 |
For unambiguous identification of the parent proteins, Jensen et al.30 suggest a minimum of five peptide matches with a maximum mass deviation of 50 ppm and sequence coverage of at least 15%. Obviously, the mass deviation in this work is set much higher, but could be improved by better operation of the mass detector. However, this is not the focus of the paper. One observation to be noted is that the mass deviation from the microchamber digestion is slightly higher on average than that from the water bath digestion. Whether this was brought about by the digestion protocol or simply experimental error is not known at this time.
Protein gel elution and digestion
In view of the current proteomics approach, a 2–3 day process that involves enzymatic protein digestion after executing 2D gel electrophoresis, the EOF-driven proteolytic system demonstrated above might prove useful in this respect. An added bonus of a microchip-based proteolysis system that is driven by EOF is that it has the potential to accept a protein gel slice from a 1D gel (or a spot from a 2D gel) and perform protein elution and digestion in a single step. As a means of approaching feasibility with this type of application, B-phycoerythrin, a fluorescent protein chosen because it can easily be detected using our in-house microchip laser-induced fluorescence detection systems, was first electrophoresed into an agarose gel. An agarose gel slice containing the fluorescent protein was then placed in the inlet reservoir of the microchamber device and a voltage applied to elute the protein. The protein, as expected, was detected as a bright spot in the center of the microchamber in 6.5 min, indicating that the protein was indeed eluting from the gel and migrating to the other end of the microchamber (data not shown). To collect sufficient B-phycoerythrin for off-line CE-LIF detection, the elution voltage was maintained for one hour. The presence of fluorescence was detected in both the inlet and outlet reservoirs (Fig. 6A and B) with no such protein detected in a run where agarose not containing B-phycoerythrin was analyzed in the same manner. This indicated that microchip-based protein elution and migration in a single step was feasible.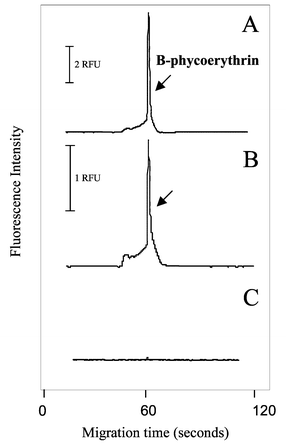 | ||
| Fig. 6 Protein elution from gel and migration through the empty microchamber. The B-phycoerythrin in agarose gel was loaded into the inlet and a potential (1 kV) was applied; sample was collected at the outlet for 60 min. Solution from both the inlet and outlet reservoirs was analyzed by CE-LIF. (A) B-phycoerythrin detected in the inlet reservoir. (B) B-phycoerythrin detected in the outlet reservoir. (C) No protein detected in the inlet reservoir from a blank agarose gel. CE-LIF conditions: see text. | ||
Since agarose is used sparingly for protein gel-based separations, it was critical to demonstrate the ability to elute and digest protein from an acrylamide gel—β-casein was used for easy comparison with known digestion patterns. As shown in Fig. 7A, a free solution protein sample as positive control was used to obtain a tryptic peptides profile (profile A) and a few peptide peaks are observed. The fact that a similar profile is observed in profile B which was obtained from microchamber digestion using a protein acrylamide gel sample suggests that the protein elution and digestion is happening. There are a cluster of peaks at migration times less than 2.5 min, but these also appear in profile C (the negative control – acrylamide gel elution without protein). This suggests that certain UV absorbing substances in the gel, possibly unpolymerized acrylamide, were eluted. It is noteworthy that the digestion pattern shown in Fig. 7 is slightly different from that shown in Fig. 3. We believe that this is the result of different lots of β-casein and trypsin gel beads that were used, where variations may exist in the quality of both materials. However, most importantly, the profiles for protein free solution digestion and protein gel elution and digestion look very similar under the same circumstances.
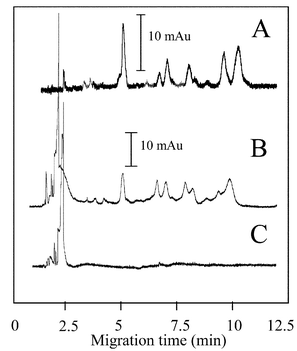 | ||
| Fig. 7 Protein gel elution and digestion in a single step. The β-casein in a 10% acrylamide gel was loaded into the inlet of a packed microdevice and a voltage applied for 36 min. At that point the solution in the outlet was collected and analyzed by CE-UV. (A) Positive control—free solution protein microchamber digestion. (B) Protein acrylamide gel elution and microchamber digestion. (C) Negative control—blank acrylamide gel elution. CE conditions as Fig. 3. | ||
This work supports the report by Harrison and colleagues,13 showing the potential of microchip-based proteolysis. The distinguishing factor here is the ability to mobilize the proteins through the digestion chamber using EOF, the most common mode for fluidic movement on microchips. This simplifies the fluidic macro-to-micro interfacing tremendously, avoiding a pressure-driven system, and brings with it the possibility of direct electroelution of protein from slab gels, which we have demonstrated. Admittedly, the protein concentrations used in this work are higher than those dealt with in real world sample concentrations, but proof of concept was sought and has been provided. Additionally, we have not yet demonstrated the elution of proteins from a SDS-denaturing gel because two complicating issues were anticipated. First, the electrophoretic mobility of SDS-bound protein outweighs the magnitude of EOF and this may disrupt migration through the proteolysis bed. Second, SDS may have to be removed from the system prior to protein mobilization because the high concentration of SDS could potentially denature the bound enzyme and, thus, alter its effectiveness. These issues will have to be addressed in future studies. However, it appears that there will be some tolerance for SDS in the proteolytic system as evidenced by the elution and digestion of partially-denatured proteins in an agarose gel (data not shown). Under conditions which involve lower protein-to-SDS mass ratios (e.g., 3∶1), β-casein can be eluted and effectively digested en route through the digestion chamber driven by EOF. It should be pointed out that the EOF driven system will only work when EOF is stronger than the mobility of the protein, which is determined to a large extent by the isoelectric point of the protein.
Conclusions
The work described in this report illustrates, albeit at a rudimentary level, the utility of a microchip-based proteolytic digestion system driven by electroosmotic pumping. This effort, which grew from the elegant work reported by Wang et al.,13 shows that proteolysis with EOF-driven flow in a microfabricated glass chamber parallels that with hydrodynamic flow. The digestion pattern from the EOF driven microchamber digestion, completed in 12 min, was comparable to that attained after an 18 h water bath digestion at 37 °C. Moreover, electroosmotic pumping may also provide additional mechanisms for protein digestion such as inducing conformational change of protein tertiary structure to expose more peptide bonds to enzymatic cleavage. Eventually, the EOF approach should prove to be useful in integrating an enzyme reactor with separations on microchips, moving one step closer towards the goal of building an integrated electrophoretic micro total analysis system for protein analysis and characterization. A practical application of the current method, protein gel elution and digestion in a single step, already looks promising. Other areas that need addressing include optimization of the microchamber reactor (in terms of chamber size), surface adsorption issues, as well as mechanisms to reduce the digestion time and increase the sensitivity.Acknowledgements
We thank Ben Madden from the Protein Core Facility, Mayo Clinic (Rochester, MN) for insightful discussions on protein gel elution and Dr. Mark Schuchard from the Sigma Chemical Company (St. Louis, MS) for helpful information on protein gel staining. We also thank Dr. Nicolas E. Sherman for his help in MALDI-TOF-MS experiments in the W. M. Keck Biomedical Mass Spectrometry Laboratory at the University of Virginia Health Sciences Center. Funding supporting this work was from the National Institute of Environmental Health Sciences (NIEHS), grant No. #1 R24 ES102229-01.References
- A. Manz, N. Graber and H. M. Widmer, Sens. Actuators B, 1990, 1, 244–248 CrossRef.
- M. A. Burns, B. N. Johnson, S. N. Brahmasondra, K. Handique, J. R. Webster, M. Krishnan, T. S. Sammarco, P. M. Man, D. Jones, D. Heldsinger, C. H. Mastrangelo and D. T. Burke, Science, 1998, 282, 484–487 CrossRef CAS.
- E. T. Lagally, I. Medintz and R. A. Mathies, Anal. Chem., 2001, 73, 565–570 CrossRef CAS.
- T. Kitamori, in Micro Total Analysis Systems 2001, ed. J. M. Ramsey and A. van den Berg, Kluwer, Dordrect, 2001, pp. 640–642 Search PubMed.
- L. J. Jin, B. C. Giordano and J. P. Landers, Anal. Chem., 2001, 73, 4994–4999 CrossRef CAS.
- J. Wen, Y. Liu, F. Xiang, H. R. Udseth and R. D. Smith, Electrophoresis, 2000, 21, 191–197 CrossRef CAS.
- S. Yao, D. S. Anex, W. B. Caldwell, D. W. Arnold, K. B. Smith and P. G. Schultz, Proc. Natl. Acad. Sci. USA, 1999, 96, 5372–5377 CrossRef CAS.
- L. Bousse, S. Mouradian, A. Minalla, H. Yee, K. Williams and R. Dubrow, Anal. Chem., 2001, 73, 1207–1212 CrossRef CAS.
- J. C. Sanders, Z. Huang and J. P. Landers, Lab Chip, 2001, 1, 167–172 RSC.
- F. Raisi, P. Belgrader, D. A. Borkholder, A. E. Herr, G. J. Kintz, F. Pourhamadi, M. T. Taylor and M. A. Northrup, Electrophoresis, 2001, 22, 2291–2295 CrossRef CAS.
- Q. L. Mao and J. Pawliszyn, Analyst, 1999, 124, 637–641 RSC.
- J. S. Rossier, A. Schwarz, F. Reymond, R. Ferrigno, F. Bianchi and H. H. Girault, Electrophoresis, 1999, 20, 727–731 CrossRef CAS.
- C. Wang, R. Oleschuk, F. Ouchen, J. Li, P. Thibault and D. J. Harrison, Rapid Commun. Mass Spectrom., 2000, 14, 1377–1383 CrossRef CAS.
- D. Figeys, Y. Nign and R. Aebersold, Anal. Chem., 1997, 69, 3153–3160 CrossRef CAS.
- I. M. Larzar, R. S. Ramsey, S. Sundberg and J. M. Ramsey, Anal. Chem., 1999, 71, 3627–3631 CrossRef CAS.
- J. Li, P. Thibault, N. H. Bings, C. D. Skinner, C. Wang, C. Colyer and J. Harrison, Anal. Chem., 1999, 71, 3036–3045 CrossRef CAS.
- B. Zhang, F. Foret and B. L. Karger, Anal. Chem., 2000, 72, 1015–1022 CrossRef CAS.
- H. Liu, C. Felten, Q. Xue and F. Foret, Anal. Chem., 2000, 72, 3303–3310 CrossRef CAS.
- Z. J. Meng, S. Z. Qi, S. A. Soper and P. A. Limbach, Anal. Chem., 2001, 73, 1286–1291 CrossRef CAS.
- L. Licklider, X. Q. Wang, A. Desai, Y. C. Tai and T. D. Lee, Anal. Chem., 2000, 72, 367–375 CrossRef CAS.
- T. Wachs and J. Henion, Anal. Chem., 2001, 73, 632–638 CrossRef CAS.
- T. C. Rohner, J. S. Rossier and H. H. Girault, Anal. Chem., 2001, 73, 5353–5357 CrossRef CAS.
- S. Ekstrom, P. Onnerfjord, J. Nilsson, M. Bengtsson, T. Laurell and G. Marko-Varga, Anal. Chem., 2000, 72, 286–293 CrossRef CAS.
- J. Gao, J. Xu, L. E. Locascio and C. S. Lee, Anal. Chem., 2001, 73, 2648–2655 CrossRef CAS.
- M. T. Kinter and N. E. Sherman, Protein Sequencing and Identification Using Tandem Mass Spectrometry, Wiley-Interscience Series on Mass Spectrometry, Wiley-Interscience, New York, 2000 Search PubMed.
- L. Licklider and W. G. Kuhu, Anal. Chem., 1998, 70, 1902–1908 CrossRef CAS.
- K. A. Cobb and M. Novotny, Anal. Chem., 1989, 61, 2226–2231 CrossRef CAS.
- G. L. Klein and C. R. Jolliff, Handbook of Capillary Electrophoresis, CRC Press, Boca Raton, FL, 1994, pp. 419–457 Search PubMed.
- G. N. Okafo and P. Camilleri, J. Chromatogr., 1991, 547, 551–553 CrossRef CAS.
- O. N. Jensen, A. V. Podtelejnikov and M. Mann, Anal. Chem., 1997, 69, 4741–4750 CrossRef CAS.
| This journal is © The Royal Society of Chemistry 2003 |
