The polycyclic aromatic hydrocarbon composition of mussels (Mytilus edulis) from Scottish coastal waters
L. Webster*, A. D. McIntosh, E. J. Dalgarno, C. Megginson, N. J. Shepherd and C. F. Moffat
FRS Marine Laboratory, Victoria Road, Aberdeen, UK AB11 9DB
First published on 13th November 2002
Abstract
Blue mussels (Mytilus edulis) were collected from coastal areas and voes in Shetland and Orkney during March and April 1998 and from various coastal locations around mainland Scotland and from the Islands during October and December 1999. The polycyclic aromatic hydrocarbon concentration and composition (2- to 6-ring parent and branched) were determined for all samples. Additional analysis, including sensory assessment and the determination of n-alkanes and geochemical biomarkers, was also undertaken on the Shetland and Orkney mussels collected in 1998. Mussels from Shetland and Orkney exhibited a wide range of total PAH concentration (14.7 to 7,177 ng g−1 wet weight). Those mussels collected in 1999 exhibited a narrower concentration range. The lowest value (mussels from Loch Kentra) was 8.4 ng g−1 wet weight while the maximum concentration was 344.1 ng g−1 wet weight and was determined in mussels from Granton East in the Firth of Forth. The PAH concentration ratios in mussels from Dury Voe (Grunna), Long Hope and Kirkwall Bay were consistent with a predominately petrogenic source for these contaminants. This was supported by both the sensory assessment and the n-alkane and triterpane profiles. Comparisons of the PAH concentrations in mussels with sediments collected from the same locations around Shetland and Orkney showed that in areas of high sediment PAH concentration the bioavailability of these contaminants was limited.
Introduction
Polycyclic aromatic hydrocarbons (PAHs) are on the Oslo and Paris Commission (OSPAR) List of Chemicals for Priority Action. This is a result of both their toxicity and persistence in the marine environment.1 In general the 2- to 4-ring compounds are acutely toxic and can taint fish and shellfish whereas the 5- and 6-ring PAHs are regarded as being both mutagenic and carcinogenic.2 The two main contributors to PAHs in the environment are fossil fuels, mainly crude oil, and the incomplete combustion of organic material.3 Thus PAHs are mainly produced by pyrolysis, but these compounds are also present in crude oils, coal, coal tar and various refinery products (petrogenic origin). PAHs are deposited in the marine environment by both atmospheric (deposition of airborne particulates and precipitation) and aquatic (e.g. road runoff, sewage effluent, oil spills) pathways. Due to their low aqueous solubility and more hydrophobic nature, PAHs tend to associate with particulate material. The exposure of biota to these sediments or to particulate bound PAHs, can result in bioaccumulation of PAHs especially by invertebrates and, on occasions, adverse biological effects.Sentinel bivalves such as the blue mussel (Mytilus edulis) accumulate hydrophobic contaminants, including PAHs. In addition mussels, and indeed invertebrates in general, have only a limited ability to metabolise PAHs and are therefore often used to monitor PAH contamination in the marine environment.1,4–10 Mussels are filter-feeding bivalves and are exposed to both dissolved and particle bound PAHs present in the water column. The more hydrophilic 2- and 3-ring PAHs, dissolved in the water column, will be readily available to mussels. Mussels are also exposed to the heavier molecular weight PAHs (four or more rings) associated with particulate matter. Although these ultimately gravitate to the sea-bed, sediment particles are regularly re-suspended as a result of winter storms, or as a consequence of tidal streams and wave action. Furthermore, the discharge from aluminium smelters may comprise very fine particulate bound PAHs which tend not to settle on the sea-bed and thus can be a source of PAHs for mussels.11 PAHs produced by pyrolysis tend to be the more hydrophobic 4- to 6-ring compounds and as such have a lower bioavailability to organisms, due to their enhanced binding to particulate material, compared to petrogenic PAHs which includes the parent and branched 2- to 3-ring compounds.8,9 Bioavailability is also affected by the organic carbon content and the grain size of the sediment. PAHs are more strongly associated with fine sediments (those with a high % of particles <63 µm) with a high organic carbon content.8
Following the Braer oil spill in 1993 an Exclusion Zone was designated around Shetland to prevent contaminated fish and shellfish reaching the market place.10 Four years after the spill an extensive investigation of the concentration of PAH in sediment from Shetland voes was undertaken. PAH concentrations (2- to 6-ring parent and branched) ranged from 248.7 ng g−1 to 4,530 ng g−1 dry weight.12 The high concentrations (>2,000 ng g−1 dry weight) found in some sediments were unexpected for such remote areas. From the PAH concentration ratios, pyrolysis was identified as being the major source of these compounds at all sites. However, the triterpane profiles from five of the six voes studied indicated the presence of petrogenic contamination.12 More recently, PAHs were determined in sediments collected from a total of twenty-six locations in Shetland and Orkney.13 Again, unusually high total PAH concentrations were found in sediments from remote areas. A wide range of total PAH concentrations was found, from <0.2 up to 22,169 ng g−1 dry weight. In addition, PAH distributions were studied to identify the probable sources of these compounds. A detailed study of specific PAH concentration ratios showed that the PAHs found in the majority of these locations were of pyrolytic origin.
The pyrolytic PAH profile is normally dominant in marine sediments, and any petrogenic contamination cannot be unequivocally identified using the PAH concentration ratios alone. However, by examining the aliphatic hydrocarbon profiles it is possible to identify petrogenic contamination. Aliphatic hydrocarbons incorporate n-alkanes, branched alkanes, isoprenoids and cyclic compounds, including the geochemical biomarkers (steranes and hopanes). These compounds are less toxic than the aromatic hydrocarbons, however their analysis can provide additional information on the source of any PAH contamination. Crude oils contain a range of n-alkanes, which decrease in concentration with increasing carbon number, showing no odd carbon predominance. After an oil spill, the oil gradually degrades (weathers) with the lighter n-alkanes being lost first, through biodegradation, evaporation or dissolution into the water column. Eventually almost all n-alkanes will be lost and only a hump will be observed in the GC-FID chromatogram.14 This unresolved complex mixture (UCM) is due to the more recalcitrant components in the oil, mainly branched and cyclic compounds, and is characteristic of petrogenic contamination. These compounds include the geochemical biomarkers, such as the pentacyclic triterpanes (hopanes) and the tetracyclic steranes, which can be useful to fingerprint spilled oils.12–19 Highly weathered oils, such as Gulfaks crude oil, are often abundant in geochemical biomarkers and give a characteristic profile.12,13 The doublet peaks in the m/z 191 mass chromatogram are due to the 22S and 22R diastereoisomers of each of the C31 to C35 homohopanes and are characteristic of all crude oils. These doublets decrease in size with increasing carbon number. North Sea and Middle Eastern oils can be readily distinguished from their triterpane profiles. North Sea crude oil contains a characteristic triterpane, bisnorhopane (two less methyl groups than hopane), C29 hopane and hopane. Middle Eastern oil does not contain bisnorhopane and the ratio of C29 hopane to hopane is higher than found in North Sea oils.
Background/Reference Concentrations (B/RCs) are currently being developed through OSPAR as an assessment tool to aid the interpretation of environmental data. However B/RCs have yet to be established for PAHs in biota. As part of an on-going study of PAH, and other hydrocarbon, concentrations in sediments and biota from Scottish waters, PAH concentrations were determined in mussels during 1998 and 1999. Both wild and cultivated mussels from a range of locations were investigated to establish typical background PAH concentrations in mussels from Scottish waters. In addition the source of the PAHs was investigated using PAH concentration ratios, n-alkane profiles, geochemical biomarkers and, for selected samples, sensory assessment. The concentration and composition of the PAHs in the mussels collected from around Shetland and Orkney during 1998 were compared with those determined in associated sediments.
Methods
Sample handling protocol
Wild blue mussels (Mytilus edulis) were collected during March/April1998, from the shoreline, from Dury Voe (2 sites) and Ronas Voe (3 sites) in Shetland and Long Hope and Kirkwall Bay in Orkney (Fig. 1). Between October and December 1999 mussels were collected from various locations around Scotland (Figs. 1 and 2), including further samples from Shetland and Orkney. Mussels from Granton East, Fairlie, Eden Estuary, Scapa Flow and Shuna Sound were collected from natural mussel beds on the sea floor. The remaining samples were all cultivated, rope grown mussels. Each sample for chemical analysis consisted of between 20 and 30 mussels. The soft tissue was removed from the mussels and homogenised. Samples were stored in solvent washed aluminium cans at −18 to −20 °C. Mussels for sensory assessment were kept in their shells and wrapped in solvent washed aluminium foil before freezing.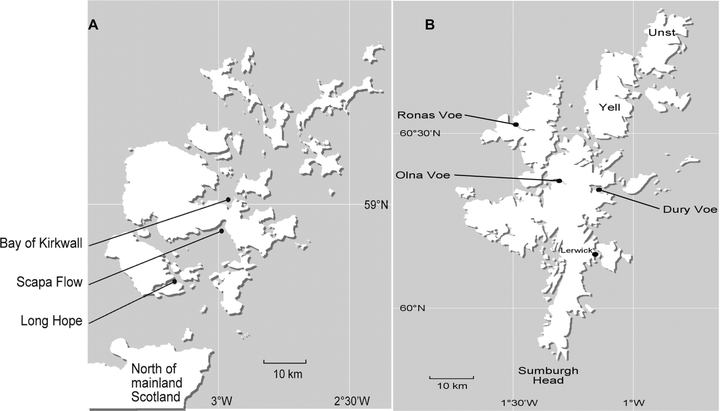 | ||
| Fig. 1 Location of mussel samples collected in 1998 and 1999 from Orkney (A) and Shetland (B). In 1998 mussel samples were collected from Kirkwall Bay and Long Hope in Orkney and Dury Voe (Muckleness and Grunna) and Ronas Voe (head, middle and mouth of voe) in Shetland. In 1999 mussels were collected from Scapa Flow in Orkney and Olna Firth in Shetland. Only the mussels from Olna Firth were rope grown. | ||
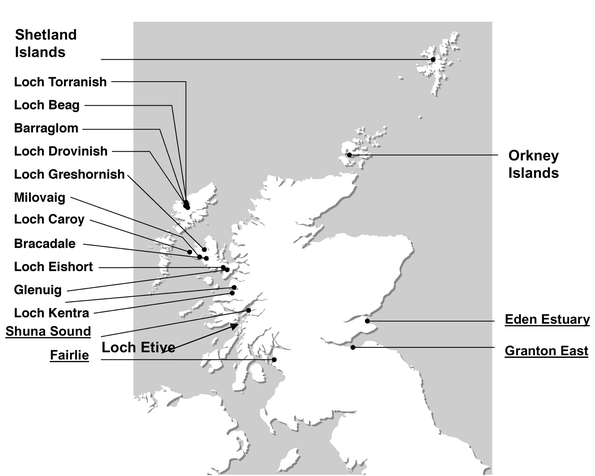 | ||
| Fig. 2 Location of mussel samples collected in 1999 from Scottish coastal areas. Mussels were also collected from Olna Firth in Shetland and Scapa Flow in Orkney (see Fig. 1). Those sites underlined comprised natural mussel beds on the sea floor. The remaining sites on mainland Scotland and the Western Isles were all shellfish farms. Mussels have been collected from Loch Etive periodically during 1999 and then on a monthly basis since March 2000 to the present day (28 monthly samples). These have been used to provide reference temporal data. | ||
Sensory assessment
Each sample for sensory assessment comprised of between six and ten mussels. The frozen mussels were rinsed in potable water prior to steam cooking which was continued until all shells were fully open (approximately five minutes). Each sample was identified with a three digit random number. The cooked mussels were placed in lidded glass casseroles on an electric food warming plate for the duration of the sensory assessment. The samples were tasted by five assessors experienced in the detection of petrogenic hydrocarbons in fish and shellfish. During the sensory assessment the assessors were advised to rinse their mouths with fresh drinking water between samples. Results were recorded on individual score sheets.A sample was deemed tainted if 50% or more of the panel judgements were positive for taint and suspect if the percentage was less than 50% but greater than 20%. A sample could only be accepted as not tainted if less than 20% of the responses were positive for the presence of taint.8
Fat determination
The fat content of the mussel samples were determined using a modified Bligh and Dyer method.20,21 Butylated hydroxytoluene was added, to minimise autoxidation, followed by chloroform (20 ml), methanol (40 ml) and water (8 ml). An Ultra-Turrax blender fitted with a teflon coated stopper was used for the homogenisation. A further 20 ml chloroform, followed by 20 ml water, was added and the sample homogenised between each solvent addition. The chloroform extract was evaporated to dryness under vacuum and the lipid fraction weighed and the fat content determined (Table 1).| Location | Mussel [PAH]/ng g−1 wet weight | % Fat | Tainta | Sediment [PAH]/ng g−1 dry weight | TOC (%) | BAF |
|---|---|---|---|---|---|---|
| a X, no taint; ✓, tainted; S, suspect.b Head, middle and mouth refer to the location within the Voe. | ||||||
| Shetland | ||||||
| Ronas Voe (head)b | 28.2 | 0.92 | X | 4,135 | 7.089 | 0.057 |
| Ronas Voe (middle)b | 40.1 | 1.4 | X | 234.9 | 1.616 | 0.197 |
| Ronas Voe (mouth)b | 14.7 | 1.1 | X | 14.0 | 0.193 | 0.189 |
| Dury Voe (Muckleness) | 49.9 | 0.96 | X | |||
| Dury Voe (Grunna) | 7,177 | 0.82 | ✓ | |||
| Orkney | ||||||
| Long Hope | 1,537 | 2.2 | S | 22,169 | 2.708 | 0.083 |
| Kirkwall Bay | 1,226 | 2.3 | ✓ | 2,312 | 0.797 | 0.189 |
Isolation of hydrocarbons from mussels
To a homogenised sample of mussels (10 g) was added aliphatic hydrocarbon internal standards, 2,2,4,4,6,8,8-heptamethylnonane (HMN) and squalane (Sq), and deuterated aromatic standards (naphthalene, biphenyl, dibenzothiophene, anthracene, pyrene and benzo[a]pyrene). The sample was then saponified and the non-saponifiable material isolated.22 The PAHs were isolated from the aliphatic hydrocarbons by isocratic, normal phase HPLC and the two fractions concentrated prior to chromatographic analysis. Appropriate procedural blanks were performed at regular intervals and these were taken into account when determining the hydrocarbon concentrations in the mussels.Determination of polycyclic aromatic hydrocarbons by GC-MSD
The concentration and composition of the PAHs (2- to 6-ring parent and branched) were determined by GC-MSD using an HP6890 Series gas chromatograph interfaced with an HP5973 MSD and fitted with a cool, on-column injector. A non-polar, methylsilicone column was used for the analyses (CPSil 8, 30 m × 0.25 mm id, 0.25 µm film thickness; Chrompack, Middelburg, The Netherlands). The carrier gas was helium and was controlled using the constant flow mode at 0.7 ml min−1. Injections were made at 50 °C and the oven temperature held constant for 3 min. Thereafter the temperature was raised at 20 °C min−1 up to 100 °C. This was followed by a slower ramp of 4 °C min−1 up to a final temperature of 270 °C. The MSD was set for selective ion monitoring (SIM) with a dwell time of 50 ms. A total of 25 ions plus the six internal standard ions were measured over the period of the analysis. Calibration standards, covering the concentration range 0.01 to 5.0 ng µl−1 were analysed, in triplicate, and the average response used to compute the calibration curve. Correlation figures of at least 0.999 were achieved for all PAHs. The limit of detection, based on 4.65 times the standard deviation of the mean value from repeat analysis of ten low standards, was <0.30 ng g−1 for benzo[b]fluoranthene and fluoranthene and <0.20 ng g−1 for anthracene and benzo[a]pyrene. In each batch of samples a laboratory reference material (LRM) and procedural blank were included. The data obtained from the LRM was transferred onto NWA Quality Analyst and Shewhart charts produced with warning and action limits being drawn at ±2× and ±3× the standard deviation of results. Good reproducibility was generally obtained for individual PAHs (CV% < 5%).22,23 Further quality control was assured through successful participation in the PAH programme of QUASIMEME (Quality Assurance of Information for Marine Environmental Monitoring in Europe). This method is accredited through United Kingdom Accreditation Services (UKAS).Determination of aliphatic hydrocarbons
The aliphatic hydrocarbon distribution, including n-alkanes, was determined by GC-FID using an HP 5890 Series II gas chromatograph (Hewlett-Packard Ltd, Stockport, UK) equipped with an HP 7673 automated, cool on-column injector and fitted with a non-polar, Ultra 1, column (25 m × 0.2 mm id, film thickness 0.33 µm; Agilent Ltd, Stockport, UK). The carrier gas was ECD grade nitrogen (16 psi). Injections were made at 60 °C and the oven temperature held constant for 3 min. Thereafter, the temperature was raised at 4 °C min−1 up to 280 °C and held at this temperature until the end of the run. The detector was maintained at 300 °C throughout. Data were collected using a PE Nelson 600 series link box and processed using a Turbochrom 3 data station (Perkin-Elmer Ltd, Beaconsfield, UK).Calibration curves were prepared for the n-alkanes nC11–nC33 inclusive, and for HMN, pristane, phytane and Sq using standard solutions covering the concentration range ∼0.1 ng µl−1–∼50 ng µl−1. Quantification was on the basis of the added internal standard, Sq. The detector response for each of the n-alkanes, pristane, phytane, HMN and Sq was linear; a correlation coefficient of 0.9991, 0.9998, 0.9998 and 0.9998 was obtained for nC11, nC16, nC23 and nC31 respectively. To ensure the detector response was maintained a standard mixture, containing nC12, nC20, nC25, nC33, pristane, HMN and Sq, was analysed at the beginning of each batch of six samples and the resulting data was monitored using Shewhart charts. The limit of detection of n-alkanes for the FID, when using automated integration, was 25 pg on-column. However, it was possible, using manual integration of the peaks, to determine n-alkane levels as low as 5 pg on-column, with a signal to noise ratio of 7:1 in the region of octadecane (nC18).
Identification of steranes and triterpanes
The sterane and triterpane composition was determined by gas chromatography-mass spectrometry using a 5890 series II gas chromatograph fitted with a cool on-column injector, interfaced with an Autospec high resolution mass spectrometer (Micromass UK Ltd, Manchester, UK). Perfluorokerosine was used as the calibrant. A methylsilicone capillary column (Ultra 1, 25 m × 0.2 mm id, 0.33 µm film thickness; Hewlett-Packard Ltd, Stockport, UK) was used for the separation. Injections were made at 60 °C and the oven temperature held constant for 0.5 min after which it was increased at 40 °C min−1 up to 150 °C. This was followed by a slower ramp of 5 °C min−1 up to a final temperature of 300 °C and held at this temperature for 22 min. Helium (15 psi) was used as the carrier gas. Biomarker analysis was carried out using the selected ion monitoring mode (SIM). Triterpanes were monitored using m/z 177 and 191 Da and steranes monitored using m/z 217 and 218 Da with a dwell time of 80 ms and an interscan delay of 10 ms.Results and discussion
Polycyclic aromatic hydrocarbons
It is essential when investigating PAH concentrations in mussels to take account of the time of year the samples were collected. The seasonal variability of PAH concentrations in mussels is well documented. The PAH concentration in mussels from Shetland, collected following the Braer oil spill, showed a decrease in late spring/early summer that coincided with spawning.22 Seasonal variations have also been observed in mussels from a reference site on the west coast of Scotland (Loch Etive). Total PAH concentrations in Loch Etive mussels, collected between June and October 1999 and then monthly from March 2000 to January 2001, ranged from 17.0 to 150.2 ng g−1 wet weight, with the highest concentrations being found between January and March.24 It is also worth emphasising that in this study, and those studies referenced from this laboratory, total PAH refers to 2- to 6-ring parent and alkylated compounds. A full listing is presented in Webster et al.22 Further, the PAH data in this study are presented on the basis of wet weight. When comparing data presented in this study with that from other investigations, it is necessary to determine the basis on which values are being reported (i.e. dry weight, wet weight, lipid weight) and the individual PAHs that comprise the total.The total PAH concentrations of mussel samples collected in March/April 1998 from the Shetland and Orkney Islands ranged from 14.7 ng g−1 wet weight (Ronas Voe (mouth)) to 7,177 ng g−1 wet weight (Dury Voe (Grunna); Table 1, Fig. 3). The total PAH concentrations in the mussels collected in 1999 from various coastal sites around Scotland between October and December, including three estuarine sites, ranged from 8.4 ng g−1 wet weight in Loch Kentra to 344.1 ng g−1 wet weight in Granton East (Table 2, Fig. 3). The total PAH concentration in the majority (11 out of 17; 65%) of mussel samples collected in 1999 was <50 ng g−1 wet weight; all were cultivated, rope grown mussels. Concentrations of 2- to 6-ring PAHs in the range 54 to 2,803 ng g−1 wet weight have previously been noted for mussels from the Scottish coast.25 The maximum PAH concentration found in mussels from within a FEPA Exclusion Zone designated following the Braer oil spill in January 1993 was 1,450 ng g−1 wet weight.25 Mussels from Long Hope, Dury Voe (Grunna) and Kirkwall Bay had total PAH concentrations greater than the highest PAH concentration (150 ng g−1 wet weight) found in the reference mussels collected during the month of March. Total PAH concentrations of greater than 150 ng g−1 wet weight were also found in mussels from the three estuarine sites sampled in 1999. Concentrations of 178.8, 300.3 and 344.1 ng g−1 wet weight were determined in mussels from the Eden Estuary, Fairlie in the Firth of Clyde and Granton East, respectively. Granton East is downstream of the Grangemouth chemical complex and Longannet Power Station as well as being in close proximity to the city of Edinburgh thus elevated PAHs would be expected for mussels harvested from such a location. Similarly, elevated PAH concentrations would be expected in the estuarine sites of Fairlie and Eden Estuary. Indeed, historically mussels from the Clyde area have been found to have high total PAH concentrations. The highest concentration found in mussels during the 1977 Scottish mussel watch programme were from mussels collected from Irvine on the Firth of Clyde, with a total PAH concentration of 2,803 ng g−1 wet weight.25 The three estuarine mussel samples were collected from natural beds and so the animals were in direct contact with the sea-bed and, therefore, have a greater exposure potential. Mussel samples from Scapa Flow and Shuna Sound were also from natural mussel beds. The total PAH concentrations were higher than observed for the rope grown mussels from similar locations but lower than the natural mussel beds from estuarine sites with total PAH concentrations of 140.5 ng g−1 wet weight and 91.1 ng g−1 wet weight for Scapa Flow and Shuna Sound, respectively.
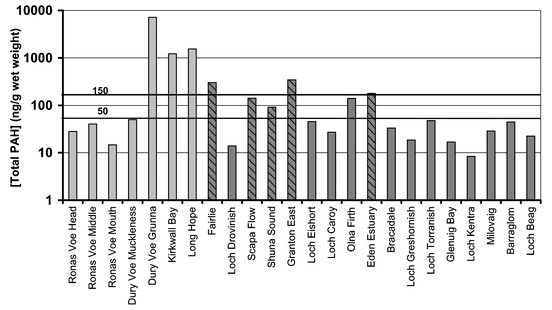 | ||
| Fig. 3 Total PAH concentrations in mussels collected from Scottish coastal areas in 1998 and 1999. Most mussels collected in 1999 had total PAH concentratios within or below typical reference concentrations (17–150 ng g−1 wet weight). Only mussel, collected from Long Hope, Kirkwall Bay and Dury Voe (Grunna) and the estuarine sites of Fairlie, Eden Estuary and Granton East had total PAH concentrations >150 ng g−1 wet weight. Grey: collected March/April 1998; dark grey: collected October and December 1999; block colour: cultivated, rope-grown; striped: natural mussel beds. | ||
| Location | Total [PAH]/ng g−1 wet weight |
|---|---|
| Fairlie | 300.3 |
| Loch Drovinish | 13.8 |
| Scapa Flow (Orkney) | 140.5 |
| Shuna Sound | 91.1 |
| Granton East | 344.1 |
| Loch Eishort | 45.2 |
| Loch Caroy | 27.3 |
| Olna Firth (Shetland) | 138.8 |
| Eden Estuary | 178.8 |
| Bracadale | 33.3 |
| Loch Greshornish | 18.6 |
| Loch Torranish | 47.5 |
| Glenuig Bay | 16.8 |
| Loch Kentra | 8.4 |
| Milovaig | 28.6 |
| Barraglom | 44.2 |
| Loch Beag | 22.5 |
Comparison to ecotoxicological asessment criteria (EACs)
OSPAR has established Background/Reference Concentrations (B/RCs) and Ecotoxicological Assessment Criteria (EACs) to assess chemical monitoring data and identify areas of environmental concern.26 B/RCs are the typical concentration range found in the OSPAR area (North-East Atlantic). B/RCs have not yet been established for PAHs in biota. EACs are the concentration below which there should be no effect or harm to the environment or biota. The provisional EACs† for PAHs in mussels are 1–10 ng g−1 wet weight for anthracene, 100–1,000 ng g−1 wet weight for naphthalene and 200–2,000 ng g−1 wet weight for fluoranthene and pyrene; none of the mussel samples analysed exceeded these concentrations for naphthalene, fluoranthene or pyrene. However, the Dury Voe (Grunna), Long Hope and Kirkwall Bay mussels were within the EAC range for anthracene.PAH concentration ratios
PAHs from pyrolytic sources are dominated by the 4- to 6-ring parent compounds.12,13 Alkylated PAHs are dominant if the source is petrogenic, as are the more thermodynamically stable isomers. Phenanthrene and pyrene are more thermodynamically stable than anthracene and fluoranthene, resulting in a higher proportion of these compounds if the source is petrogenic. Comparison of the alkylated versus parent PAH concentrations or a comparison of isomer concentrations can help distinguish PAH sources. The proportion of parent compounds in the Dury Voe (Grunna) mussels was low (3.7%) suggesting that the PAHs were of petrogenic origin. In comparison, the proportion of parent compounds in Ronas Voe mussels ranged from 27.0 to 43.3%. The PAH concentration ratios also clearly indicate there is petrogenic contamination of the mussels from Dury Voe (Grunna), with a P/A ratio of 39.9 and a Fl/Py ratio of 0.5 (Table 3, Fig. 4). The MP/P ratio gave a value of 4.7; this again is consistent with petrogenic contamination.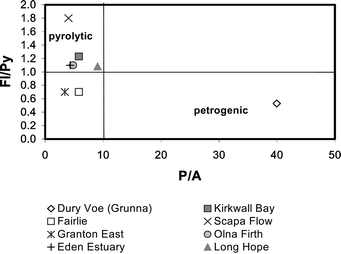 | ||
| Fig. 4 Plot of the fluoranthene/pyrene (Fl/Py) ratio against the phenanthrene/anthracene ratio (P/A) for Scottish coastal mussels. The zone identified by a high Fl/Py ratio and a low P/A ratio is characteristic of pyrolytic PAH. The mussel sample from Dury Voe (Grunna) is clearly situated in the petrogenic zone. | ||
| Total [PAH]a/ng g−1 | Ronas Voe (head) | Ronas Voe (middle) | Ronas Voe (mouth) | Dury Voe Muckleness | Dury Voe Grunna | Kirkwall Bay | Long Hope |
|---|---|---|---|---|---|---|---|
| a 128, Naphthalene (parent and C1–C4); 178, Phenanthrene/anthracene (parent and C1–C3); DBT, Dibenzothiophene (parent and C1–C3); 202, Fluoranthene/pyrene (parent and C1–C3); 228, Benzanthracenes/benzophenanthrenes/chrysene/triphenylenes (parent and C1–C2); 252, Benzofluoranthene/benzopyrene/perylene (parent and C1–C2); 276, Indenopyrene/benzoperylene (parent and C1–C2).b .Excludes DBT.c N/A, not available, due to anthracene not being detected. | |||||||
| %128 | 2.8 | 16.0 | 3.4 | 7.0 | 42.3 | 11.7 | 24.4 |
| %178 | 24.5 | 34.7 | 28.6 | 34.5 | 42.1 | 43.0 | 44.4 |
| %DBT | 9.9 | 11.5 | 6.1 | 10.1 | 7.5 | 15.1 | 16.4 |
| %202 | 32.3 | 22.9 | 27.9 | 24.6 | 6.9 | 17.9 | 9.7 |
| %228 | 13.1 | 6.2 | 13.6 | 9.6 | 1.0 | 7.2 | 2.9 |
| %252 | 14.9 | 7.0 | 15.6 | 11.2 | 0.2 | 4.5 | 1.9 |
| %276 | 2.5 | 1.7 | 4.8 | 2.8 | <0.1 | 0.6 | 0.3 |
| Parent [PAH]/ng g−1b | 11.0 | 9.6 | 5.1 | 13.7 | 243.5 | 195.2 | 134.0 |
| %Parentb | 43.3 | 27.0 | 37.0 | 30.6 | 3.7 | 18.8 | 10.4 |
| Parent [PAH]–naphthalene/ng g−1b | 11.0 | 9.1 | 5.1 | 13.7 | 242.6 | 194.8 | 129.3 |
| P/A | N/Ac | N/Ac | N/Ac | N/Ac | 39.9 | 5.8 | 9.0 |
| Fl/Py | 1.1 | 0.9 | 2.0 | 0.9 | 0.5 | 1.2 | 1.1 |
| MP/P | 1.6 | 2.4 | 1.8 | 2.5 | 4.7 | 3.1 | 3.9 |
Mussels collected from Long Hope and Kirkwall Bay also contained a relatively low proportion of parent PAHs, 10.4% and 18.8% respectively, and a high % naphthalene indicating that there may be a petrogenic source of PAHs in these mussels. In addition, the MP/P ratios were high (>2) for both mussel samples, this being indicative of petrogenic contamination (Table 3). In contrast the Fl/Py ratio and P/A ratios were indicative of pyrolytic sources, with values of 5.8 and 1.2 for the Kirkwall Bay mussels and 9.0 and 1.1 for the Long Hope mussels. Plotting the Fl/Py ratio against the P/A ratio for these mussels and those that had measurable concentrations of anthracene, placed the Long Hope mussels close to the border between pyrolytic and petrogenic suggesting a possible mixed source (Fig. 4). In contrast mussels from Scapa Flow were clearly dominated by PAHs of pyrolytic origin
Mussels collected from around the coastline of Scotland in 1999 again showed a low proportion of parent PAHs, with the majority of mussel samples having less than 30% parent compound (Table 4). The MP/P ratios were high, ranging from 1.1 to 4.3, with seven being ≥2. This may indicate a petrogenic source but could be due to the preferential accumulation of the alkylated PAHs or the higher biodegradation rate of the parent compound. Alkylated naphthalenes have been shown to biodegrade more slowly than napthalene.28 However, it has also been suggested that accumulation of PAHs in biota may be dependent on the octonal/water partition coefficient (Kow).1 The higher Kow of the branched PAHs compared to the corresponding parent compound may account for their preferential accumulation. The P/A ratios were less than 10 indicating pyrolytic contamination. In most cases the Fl/Py ratios agreed with this, with values greater than 1. Only in the mussels from Fairlie and Granton were the Fl/Py ratios less than 1, which may be an indication of petrogenic contamination (Fig. 4).
| [PAH]a/ng g−1 wet weight | Fairlieb | Loch Drovinish | Scapa Flowb | Shuna Soundb | Grantonb | Loch Eishort | Loch Caroy | Olna Firth | Eden Estuaryb | Bracadale | Greshornish | Torranish | Glenuig Bay | Loch Kentra | Milovaig | Barraglom | Loch Beag |
|---|---|---|---|---|---|---|---|---|---|---|---|---|---|---|---|---|---|
| a 128, Naphthalene (parent and C1–C4); 178, Phenanthrene/anthracene (parent and C1–C3); DBT, Dibenzothiophene (parent and C1–C3); 202, Fluoranthene/pyrene (parent and C1–C3); 228, Benzanthracenes/benzophenanthrene/ chrysene/triphenylene (parent and C1–C2); 252, Benzofluoranthenes/benzopyrenes/perylene (parent and C1–C2); 276, Indenopyrene/benzoperylene (parent and C1–C2).b Natural mussel beds.c Excludes DBT.d .N/A, not available, due to anthracene being below the limit of detection. | |||||||||||||||||
| %128 | 9.0 | 54.7 | 6.6 | 3.76 | 9.9 | 6.9 | 8.1 | 14.7 | 7.9 | 7.6 | 23.1 | 14.4 | 18.9 | 9.5 | 22.7 | 7.9 | 8.0 |
| %178 | 19.9 | 5.7 | 16.7 | 11.0 | 17.5 | 10.8 | 20.1 | 31.8 | 28.0 | 29.1 | 18.9 | 16.4 | 12.1 | 17.9 | 30.1 | 19.7 | 21.8 |
| %DBT | 8.1 | 1.8 | 5.0 | 5.6 | 6.0 | 2.9 | 15.4 | 13.8 | 8.9 | 18.6 | 4.3 | 6.5 | 9.5 | 2.4 | 12.2 | 4.8 | 2.6 |
| %202 | 21.3 | 4.2 | 17.9 | 24.8 | 22.4 | 11.9 | 13.2 | 9.6 | 22.1 | 22.8 | 27.4 | 16.0 | 17.5 | 35.7 | 19.2 | 16.3 | 13.3 |
| %228 | 21.3 | 2.9 | 8.6 | 20.5 | 13.8 | 5.1 | 4.8 | 6.8 | 14.7 | 9.3 | 10.7 | 10.1 | 13.6 | 19.0 | 6.3 | 14.9 | 15.6 |
| %252 | 13.6 | 9.0 | 23.1 | 29.6 | 14.4 | 24.8 | 19.7 | 13.5 | 15.4 | 10.2 | 12.4 | 16.0 | 14.2 | 15.4 | 8.7 | 30.8 | 32.0 |
| %276 | 6.8 | 21.7 | 22.1 | 4.8 | 16.0 | 37.6 | 18.7 | 9.8 | 3.0 | 2.4 | 3.2 | 20.6 | 14.2 | 0.1 | 0.8 | 5.6 | 6.7 |
| Parent [PAH]c | 59.7 | 16.2 | 22.0 | 42.9 | 99.3 | 8.8 | 9.4 | 25.8 | 65.5 | 8.1 | 5.2 | 16.0 | 6.3 | 2.9 | 5.5 | 19.4 | 7.2 |
| %Parentc | 19.9 | 14.3 | 15.6 | 47.1 | 28.8 | 19.5 | 27.8 | 18.6 | 36.7 | 24.3 | 28.0 | 33.7 | 37.5 | 11.9 | 19.2 | 43.8 | 31.1 |
| P/Ad | 5.8 | N/A | 4.0 | N/A | 3.4 | N/A | N/A | 4.8 | 4.3 | N/A | N/A | N/A | N/A | N/A | N/A | N/A | N/A |
| Fl/Py | 0.7 | 1.1 | 1.8 | 1.1 | 0.7 | 1.4 | 1.2 | 1.1 | 1.1 | 1.2 | 1.5 | 1.2 | 1.7 | 1.7 | 1.3 | 1.3 | 2.0 |
| MP/P | 3.4 | 1.5 | 2.3 | 1.9 | 2.4 | 1.5 | 2.2 | 4.3 | 2.0 | 2.0 | 1.8 | 1.9 | 1.1 | 1.1 | 2.4 | 1.2 | 1.3 |
Total aliphatic hydrocarbons
Only the 1998 mussels were analysed for aliphatic hydrocarbons. The aliphatic hydrocarbon profile of Long Hope and Kirkwall Bay mussels contained a bimodal UCM suggesting there was petrogenic contamination of these samples, possibly from a heavy fuel oil (Fig. 5). The aliphatic profile of the Dury Voe (Grunna) mussel sample also contained a UCM, confirming what was found from the PAH concentration ratios. Superimposed on this was a series of n-alkanes, mainly between nC12 and nC23, without an odd carbon predominance, and maximising at nC18 (Fig. 5). This suggests the petrogenic hydrocarbons in this sample were from a lighter fuel oil such as diesel. Similar to the PAH concentration ratios there was no indication of petrogenic contamination from the n-alkane profiles of the mussels from Ronas Voe or Dury Voe (Muckleness).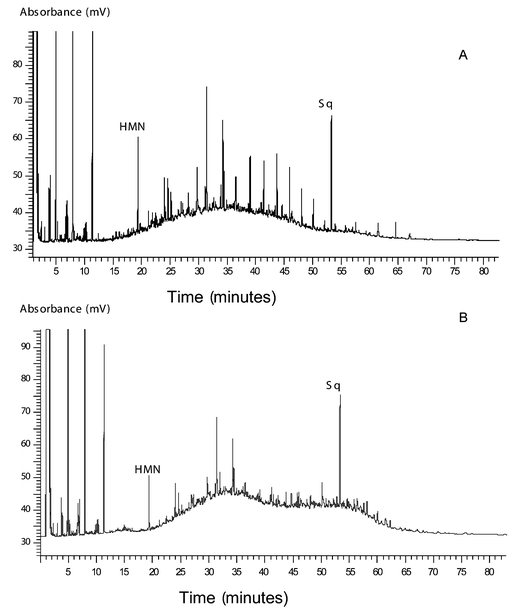 | ||
| Fig. 5 (A) Aliphatic hydrocarbon profile of the Dury Voe (Grunna) mussel sample. The unresolved complex mixture (UCM) maximised at nC18 and suggests petrogenic contamination. Superimposed on this was a series of n-alkanes, mainly between nC12 and nC23 and indicates a more recent input of petrogenic hydrocarbons in this sample. The internal standard used contained squalane (Sq) and heptamethylnonane (HMN). (B) Aliphatic hydrocarbon profile of the Long Hope mussel sample. The UCM present was indicative of petrogenic contamination. | ||
Triterpane and steranes
Similar to the aliphatic hydrocarbon and the PAH profiles, there was some evidence of petrogenic contamination from the triterpane profile of the Kirkwall Bay and Long Hope mussels. The m/z 191 mass chromatograms of these mussels indicated the petrogenic contamination may be from a Middle Eastern oil (Fig. 6). The C29 hopane to hopane ratio was greater than unity, this being typical of some Middle Eastern oils. The triterpane profile of the Dury Voe (Grunna), Dury Voe (Muckleness) and the Ronas Voe mussels did not show any evidence of crude oil, with no peaks in the m/z 191 or 217 mass chromatograms. However, the aliphatic hydrocarbon profile and PAH concentration ratios had shown that there was petrogenic contamination in the Dury Voe (Grunna) mussel sample. Diesel oil would not show a typical crude oil triterpane profile therefore this is the most likely source of the PAH contamination. This confirms the earlier observations taken from the aliphatic hydrocarbon profile.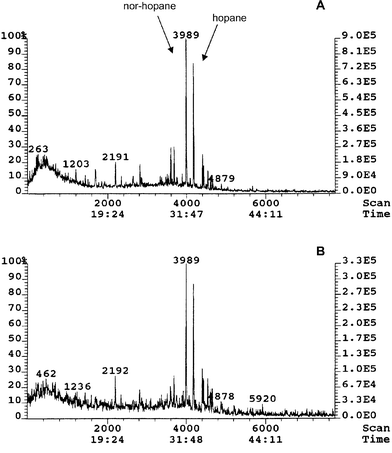 | ||
| Fig. 6 Triterpane (m/z = 191) profile of Long Hope (A) and Kirkwall Bay (B) mussels collected in 1998. The high proportion of norhopane to hopane shows that there may be contamination from Middle Eastern oil. | ||
Sensory assessment
Sensory assessment was carried out on the seven mussel samples from Shetland and Orkney collected in 1998. Greater than 50% of the panel scored mussels from Dury Voe (Grunna) in Shetland and Kirkwall Bay in Orkney as containing a petrogenic taint (Table 1). Thus, these two samples were deemed to be tainted, indicating petrogenic contamination at these two locations. The PAH concentration of the Dury Voe (Grunna) mussels was high with a total PAH concentration of 7,177 ng g−1 wet weight. The PAH concentration ratios and the aliphatic hydrocarbon profiles also gave strong evidence of petrogenic contamination. The Kirkwall Bay mussels also had a high total PAH concentration with a value of 1,266 ng g−1 wet weight. The aliphatic hydrocarbon profile, and the triterpane profile, also indicated petrogenic contamination. However the PAH concentration ratios did not give definitive evidence of petrogenic contamination and suggested a mixed source of PAHs. The Long Hope mussels were deemed as ‘suspect’ with respect to petrogenic taint due to 40% of the panel recording a positive score for petrogenic taint, despite having a higher PAH concentration and a higher proportion of the naphthalene compounds, thought to be associated with petrogenic taint, than the Kirkwall Bay mussels. Evidence for petrogenic contamination in the Long Hope mussels also came from the aliphatic hydrocarbon and triterpane profiles. Again the PAH concentrations indicated a mixed source of PAHs. No positive taint results were obtained for mussels from Ronas Voe or Dury Voe (Muckleness). In line with the n-alkane and triterpane profiles, the sensory assessment (Table 1) indicated that there was no petrogenic contamination in any of these mussel samples.Comparison with sediment PAH concentrations
In 1998 sediments were also collected from Shetland and Orkney for hydrocarbon analysis. The results of this work are presented in Webster et al.13 while comparisons of the PAH concentrations found in the mussels with those in the sediments are made here. PAH concentrations in mussels collected from Ronas Voe and Dury Voe (Muckleness), in Shetland, were within, or below in one case, the concentration range found in the reference mussels from Loch Etive.24 Mussels collected from the head, middle and close to the mouth of Ronas Voe gave total PAH concentrations of 28.2 ng g−1, 40.1 ng g−1 and 14.7 ng g−1 wet weight, respectively. The PAH concentrations in sediments from Ronas Voe ranged from 2.1 ng g−1 at the mouth to 4,135 ng g−1 dry weight at the head.13 The PAH concentration of the mussels were relatively constant throughout the voe, despite this wide PAH concentration range in the sediments. The Olna Firth mussel sample collected in 1999 was the only rope grown sample, from a relatively remote location, with a total PAH concentration greater than 50 ng g−1 wet (138.8 ng g−1 wet weight). Sediment samples from Olna Firth were previously found to have high concentrations of PAHs, with the totals ranging from 2,034 to 4,530 ng g−1 dry weight.12 The organic carbon content of these sediments were also high (>5%) and therefore the bioavailability of the PAHs would be limited due to their enhanced binding to the sediment.Baumard et al. reported an apparent baseline PAH concentration (3- to 6-ring parent and alkylated PAHs) in mussels of 350 ng g−1 dry weight (equivalent to 75 ng g−1 wet weight using OSPAR conversion factor27).9,29 Only in areas of very high sediment PAH concentrations (>3,000 ng g−1 dry weight) did mussels contain PAH concentrations higher than this baseline concentration.9,29 Similar concentrations were also found in two Mediterranean harbours (Port Vendres and Barcelona) with concentrations (3- to 6-ring parent and alkylated PAHs) of 337 and 336 ng g−1 dry weight respectively.8 Mussels from Dury Voe (Grunna), Long Hope and Kirkwall Bay gave total PAH concentrations well in excess of 75 ng g−1 wet weight (Table 1, Fig. 3). The proportion of 2-ring PAHs in these samples varied between 11.7% and 42.3% (Table 3). However, the 3- to 6-ring PAH concentration was still well in excess of 75 ng g−1 wet weight for all three locations. In both Long Hope and Kirkwall Bay the maximum sediment total PAH concentrations were greater than 3,000 ng g−1 dry weight (Table 1). PAH concentrations in sediments at Long Hope ranged from 48.0 ng g−1 to 22,169 ng g−1 dry weight.13 The higher concentrations were found in sediments close to a pier and fish farms. Thus elevated PAH concentrations could be due to small boat activity in these areas. The mussel sample, collected from the pier, had a total PAH concentration of 1,537 ng g−1 wet weight. The Kirkwall Bay mussel sample gave a total PAH concentration of 1,226 ng g−1. Sediments from Kirkwall Bay had PAH concentrations ranging from 170.1 ng g−1 to 4,201 ng g−1 dry weight.13 A harbour is situated in Kirkwall Bay so elevated PAH concentrations would be expected. Two mussel samples were collected from Dury Voe in Shetland; one from Grunna, situated next to a pier, and one from Muckleness. Total PAH concentrations in sediment from Dury Voe ranged from 126.5 to 1,369 ng g−1 dry weight, however none of these sediments were from Grunna.13
PAH bioaccumulation
Differences were observed between the PAH distributions of sediments and mussels collected in 1998. The main source of PAHs in sediments from voes and coastal areas in Shetland and Orkney was pyrolysis.13 In general the proportion of parent PAHs in these sediments was greater than 40% and the PAH concentration ratios indicated a predominately pyrolytic source. In the mussel samples the proportion of parent compounds tended to be lower (<30%). In addition, the mussels showed a greater proportion of the smaller ring compounds than the sediments. In general fish are enriched in the lower molecular weight compounds, indicating accumulation is mainly through the water column.9 However molluscs, such as mussels, scallops and queens, tend to contain the entire suite of PAHs.22 In waters of high turbidity, where particles are re-suspended regularly, filter-feeding bivalves will contain a higher proportion of the more hydrophobic 4- to 6-ring compounds due to accumulation of PAHs from the sediment. Phenanthrenes and fluoranthenes/pyrenes (parent and branched) had the largest contribution to the total PAH concentration in mussels from Ronas Voe, Dury Voe (Muckleness) and Kirkwall Bay (Fig. 7). In mussels from Dury Voe (Grunna) and Long Hope the naphthalenes and phenanthrenes/anthracenes (parent and branched) had the largest contribution to the total PAH concentration and the 6-ring compounds the smallest (Fig. 7). This contrasts with the sediments where there was a higher contribution to the total PAH concentration from the 4- to 6-ring PAHs.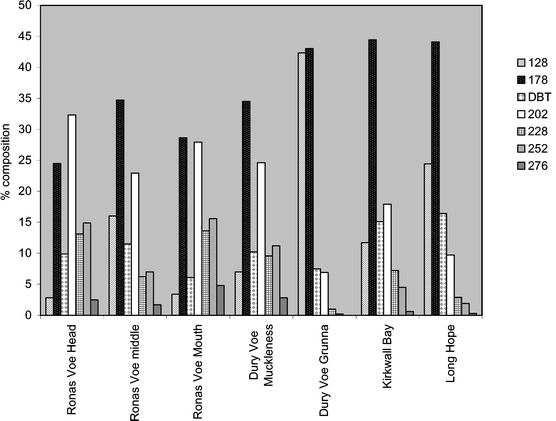 | ||
| Fig. 7 PAH distribution in mussel samples collected from Shetland and Orkney in 1998. The 3- and 4-ring PAHs dominated the profiles. | ||
The higher molecular weight PAHs can accumulate in biota if the uptake route is via the food or sediment. The bioavailability of PAHs will be affected by the organic carbon content and particle size of the sediment. PAHs are strongly adsorbed on muddy sediments reducing their bioavailability. Bioaccumulation factors (BAF) are calculated by dividing the total PAH concentration of the mussels (normalised for lipid content) by the sediment PAH concentration (normalised for TOC). Mussels from the Western Baltic Sea analysed by Baumard et al.9 were found to have BAF ranging from 0.02 to 72. Baumard suggested that the wide range was due to the variety of sediment types. Muddy sediments with a TOC ranging from 2.3 to 6.5% gave lower BAF (<2.7). Sands with a TOC <0.2% gave higher BAF ranging from 9.1 to 71.6. In this study the PAH concentration of the sediment closest to where the mussels were collected was used. The biaccumulation factors are presented in Table 1. Only the sediment from Ronas Voe (mouth) had a TOC of <0.2%, however the PAH concentration was also very low (14.7 ng g−1 dry weight) hence all BAF were low. BAF were not calculated for the Dury Voe mussels as sediments were not collected close to these samples. In Ronas Voe the lowest BAF (0.0568) was for the mussels collected at the head of the voe and demonstrates that although the total PAH concentration in the sediment was high the PAHs were not bioavailable. The BAF for the Long Hope mussel was also very low with a value of 0.083. Despite the sediment PAH concentration being 22,169 ng g−1 dry weight, compared to 2,312 ng g−1 dry weight in the Kirkwall Bay sediment, the Long Hope and Kirkwall Bay mussels gave similar PAH concentrations (Table 1). This is most likely to be due to the higher organic carbon content of the Long Hope sediment resulting in a lower bioavailability of the PAHs.
Conclusions
Natural mussels from the sea floor and cultivated, rope grown mussels, from a range of Scottish locations were analysed for PAHs and the data compared, where possible, with aliphatic hydrocarbon data and sensory assessment. Mussels were collected in 1998 and 1999 from estuarine sites, piers and harbours as well as from more remote sites with little industrial or urban activity. Mussels collected in 1999 gave total PAH concentrations ranging from 8.4 ng g−1 wet weight to 341.1 ng g−1 wet weight. The majority of mussel samples had total PAH concentrations <50 ng g−1 wet weight, all of these were rope grown mussels from remote locations. Mussels from estuarine sites had higher total PAH concentrations (>150 ng g−1 wet weight). All of these mussels were from natural beds and were therefore in direct contact with the sediment. Mussels collected from natural mussel beds, but not from estuarine sites, (Scapa Flow and Shuna Sound) had PAH concentrations greater than 50 ng g−1 wet weight but less than 150 ng g−1 wet weight. Total PAH concentrations in mussels from Shetland and Orkney, collected in 1998, ranged from 14.2 ng g−1 wet weight to 7,177 ng g−1 wet weight. Mussels collected from Long Hope and Kirkwall Bay in Orkney, and Dury Voe (Grunna) in Shetland gave the highest total PAH concentrations. All three mussel samples were collected close to a pier or harbour and gave total PAH concentrations greater than 150 ng g−1 wet weight. Using the PAH concentration ratios for source identification, only the Dury Voe (Grunna) mussels showed clear evidence of petrogenic contamination. The PAH concentration ratios of the Kirkwall Bay and Long Hope mussels suggested a mixed source. All three mussels showed evidence of petrogenic contamination from their n-alkane profiles and sensory assessment. Triterpane profiles indicated that the petrogenic contamination in the Long Hope and Kirkwall Bay mussels was due to Middle Eastern crude oil. The lack of triterpanes and the aliphatic hydrocarbon profile of the Dury Voe (Grunna) mussels indicated that diesel was the source of PAHs in this sample. High PAH concentrations in mussels (>150 ng g−1 wet weight) were found in areas where the sediment PAH concentrations were higher than 3,000 ng g−1dry weight. However the bioaccumulation factors (BAFs) were low for all mussels, indicating that the sediment PAHs were not bioavailable.Overall, it has been shown that variable PAH concentrations are detected in mussels from Scottish coastal waters. The sources of these PAHs are many and varied. By applying additional analytical methods, and combining the data obtained with PAH concentration ratios and information regarding the proportion of branched and parent compounds, it is however, possible to be more definitive about specific sources of these contaminants including, where there is petrogenic contamination, the source oil.
References
- J. P. Meador, J. E. Stein, W. L. Reichert and U. Varanasi, Rev. Environ. Contam. Toxicol., 1995, 143, 79–165 Search PubMed.
- R. J. Law, C. Kelly, K. Baker, J. Jones, A. D. McIntosh and C. F. Moffat, J. Environ. Monit., 2002, 4, 383–388 RSC.
- Polycyclic Aromatic Hydrocarbons, OSPAR Priority Substances, OSPAR Commision, London, 2002 Search PubMed.
- J. W. Farrington, E. D. Goldberg, R. W. Risebrough, J. H. Martin and T. B. Vaughan, Environ. Sci. Technol., 1983, 17, 490–496 CAS.
- A. P. Murray, B. J. Richardson and C. F. Gibbs, Mar. Pollut. Bull., 1991, 22, 595–603 CrossRef CAS.
- M. Haitzer, S. Hoss, W. Traunspurger and C. Steinberg, Chemosphere, 1998, 37, 1335–1362 CrossRef CAS.
- M. T. Piccardo, R. Coradeghini and F. Valerio, Mar. Pollut. Bull., 2001, 42, 951–956 CrossRef CAS.
- P. Baumard, H. Budzinski, Q. Michon, P. Garrigues, T. Burgeot and J. Bellocq, Estuarine, Coastal Shelf Sci., 1998, 47, 77–90 Search PubMed.
- P. Baumard, H. Budzinski, P. Garrigues, H. Dizer and P.D. Hansen, Mar. Environ. Res., 1999, 47, 17–47 CrossRef CAS.
- K. J. Whittle, D. A. Anderson, P. R. Mackie, C. F. Moffat, N. J. Shepherd and A. H. McVicar, The Impact of an Oil Spill in Turbulent Waters: The Braer, ed. J. M. Davies and G. Topping, The Stationary Office, Edinburgh, 1997, pp. 144–160 Search PubMed.
- B. T. G. Gowland, A. D. McIntosh, I. M. Davies and C. F. Moffat, Bull. Environ. Contam. Toxicol., 2002, 69, 147–154 CrossRef CAS.
- L. Webster, A. D. McIntosh, C. F. Moffat, E. J. Dalgarno, N. A. Brown and R. J. Fryer, J. Environ. Monit., 2000, 2, 29–38 RSC.
- L. Webster, R. J. Fryer, E. J. Dalgarno, C. Megginson and C. F. Moffat, J. Environ. Monit., 2001, 3, 591–601 RSC.
- Z. Wang, M. Fingas and D. S. Page, J. Chromatogr., A, 1999, 843, 369–411 CrossRef CAS.
- D. M. Jones, S. J. Rowland and G. Douglas, Mar. Pollut. Bull., 1986, 17, 24–27 CrossRef.
- D. Munoz, M. Guiliano, P. Doumenq, F. Jacquot, P. Scherrer and G. Mille, Mar. Pollut. Bull., 1997, 34, 868–874 CrossRef CAS.
- F. Brakstad and O. Grahl-Nielsen, Mar. Pollut. Bull., 1988, 19, 319–324 CrossRef CAS.
- G. A. Wolff, M. R. Preston, G. Harriman and S. J. Rowland, Mar. Pollut. Bull., 1993, 26, 567–571 CrossRef CAS.
- F. Jacquot, Y. le Dreau, P. Doumenq, D. Munoz, M. Gulliano, G. Imbert and G. Mille, Chemosphere, 1999, 39, 1407–1419 CrossRef CAS.
- E. G. Bligh and W. J. Dyer, Can. J. Biochem. Physiol., 1995, 37, 911–917 Search PubMed.
- S. W. F Hanson and J. Olley, Proc. Biochem. Soc., 1963, 101–102 Search PubMed.
- L. Webster, L. Angus, G. Topping, E. J. Dalgarno and C. F. Moffat, Analyst, 1997, 122, 1491–1495 RSC.
- G. Topping, J. M. Davies, P. R. Mackie and C. F. Moffat, The Impact of an Oil Spill in Turbulent Waters: The Braer, ed. J. M. Davies and G. Topping, The Stationary Office, Edinburgh, 1997, pp. 121–143 Search PubMed.
- A. D. McIntosh, I. M. Davies, L. Webster and C. F. Moffat, FRS Marine Laboratory Report No. 07/01, Fisheries Research Services, Aberdeen, 2001 Search PubMed.
- P. R. Mackie, R. Hardy, K. J. Whittle, C. Bruce and A. S. McGill, Polynuclear Aromatic Hydrocarbons in Chemistry and Biology, 4th International Symposium, 1980, pp. 379–393 Search PubMed.
- OSPAR Quality Status Report, 2000, ch. 4 Search PubMed.
- A Temporal Trend Assessment of Contaminant Concentrations in Biota, SIME/99/4/Info. 1, OSPAR Commission, 1999 Search PubMed.
- J. D. Leblond, W. T. Schultz and G. S. Sayler, Chemosphere, 2001, 42, 333–343 CrossRef CAS.
- P. Baumard, H. Budzinski and P. Garrigues, Mar. Pollut. Bull., 1998, 36, 577–586 CrossRef CAS.
Footnote |
| † OSPAR present EACs on the basis of dry weight, but for the purpose of comparison the values have been converted to wet weight using a conversion factor.27 |
| This journal is © The Royal Society of Chemistry 2003 |