Identification and quantification of bisphenol A by gas chromatography and mass spectrometry in a lab-scale dual membrane system
J. Y.
Hu
*,
T.
Yuan
,
S. L.
Ong
,
L. F.
Song
and
W. J.
Ng
Centre for Water Research, Department of Civil Engineering, National University of Singapore, 10 Kent Ridge Crescent, Singapore 119260. E-mail: cvehujy@nus.edu.sg
First published on 13th January 2003
Abstract
Endocrine disruptor contamination is an emerging issue of concern in the field of water quality engineering. In this study, a lab-scale microfiltration (MF) and reverse osmosis (RO) based water reclamation system was set up to monitor and evaluate the removal of bisphenol A (BPA), which is a known oestrogenic compound. The identification and quantification of BPA were performed by using gas chromatography coupled with mass spectrometry. It was noted that the detection method used in this study was able to achieve an average recovery ranging from 88.2 to 94.1% of BPA with standard deviations of less than 10% in different spiked samples. The detection limit of the analytical protocol was determined at 20 ng L−1. Based on the analytical protocol, it was noted that a low level of BPA (1.18–3.04 µg L−1) could be detected in feed water (effluent of an activated sludge treatment system) to the dual membrane water reclamation system. The results obtained suggested that BPA could be easily chlorinated by sodium hypochlorite with a dosage of 4 to 5 mg L−1 and a contact time of 1 to 2 min. In this lab-scale study, a satisfactory removal of BPA was readily obtained by RO and BPA was abated to an undetectable level in the product water. It was noted that the RO rejection characteristic of BPA was not sensitive to the variations in raw feed water characteristics experienced in this study. In addition, it was noted that BPA concentration present in raw feed water did not exert any significant impact on RO performance in terms of BPA rejection. The results of this study demonstrated that membrane technology could be effectively used for BPA removal.
Introduction
Growing populations and the associated demand for additional fresh water supplies have led to increasing attention towards water reclamation from unconventional sources to augment the limited water supply. A review of literature revealed that reclaimed water has been successfully used for various nonpotable applications. These include landscape and agriculture irrigation, industrial process water, power plant cooling water, toilet flushing, car washing, augmentation of recreational water bodies, fire protection, commercial cleansing, construction, and a number of other miscellaneous uses. More recently, there has been an increasing interest in the use of high quality reclaimed water to augment potable water resources.1 Reclamation of treated municipal wastewater to augment a raw water supply was made possible by the advancements in treatment technology.2,3 However, newly emerging and unidentified contaminants pose questions concerning the levels of treatment, monitoring, and testing needed to ensure public health safety for “potable reuse” applications.Over the recent years, the topic of endocrine disruptors (EDs), commonly known as environmental oestrogens, has been receiving increasing attention globally. To date, more and more evidence has shown that EDs may have undesirable effects towards the developmental and reproductive systems of wildlife and human beings.4,5 It has been reported that even low doses of EDs could cause significant biological effects.4 In addition, some identified EDs were found in effluents from wastewater treatment plants elsewhere.6–10 In view of this, it is imperative to develop new monitoring strategy for detecting and quantifying the presence of EDs in product water.
Among the various identified EDs, bisphenol A (BPA) has been well-known for its confirmed oestrogenic activity and its frequent detection in environmental samples. BPA, or 2,2-bis(4-hydroxyphenyl)propane, is an intermediate in the production of epoxy resins and polycarbonate plastics (Table 1.). In addition, it is used in the manufacture of thermal paper and as a stabilizing material or antioxidant for many types of plastics.9,10
| CAS No. | 80-05-7 |
| Molecular formula | C15H16O2 |
| Molecular weight | 228.29 |
| Melting point/°C | 158–159 |
| Boiling point | 220 °C at 4 mm Hg |
| Physical appearance | White to light brown flakes |
| Specific gravity | 1.195 at 25 °C |
| Vapor pressure | 0.2 mm Hg at 170 °C |
| Solubility, mg L−1 | 120∼300 (22∼25 °C) |
| Molecular structure |
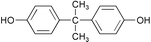
|
Owing to an increasing demand for plastic products, there is an increasing trend in the production and the use of BPA.10,11 For example, plastics products are commonly utilized in the food and drink packaging industry, in which the BPA leaching problem has been a concern.11,13 Similarly, BPA has increasingly become the focus in the dentistry clinics. This is because BPA has been found in saliva collected from patients treated with BPA diglycidyl ether based dental sealant.14
Although BPA only has moderate or weak acute toxicity,11,12 its oestrogenic activity renders it to receive considerable attention from the scientific communities. Recent studies revealed that BPA can: (i) bind to human oestrogen receptor (ER) observed in yeast based oestrogenic chemical screening assay; (ii) stimulate prolactin release in in vitro and in vivo tests; (iii) proliferate human breast cancer cells (MCF-7); (iv) differ from 17-beta-oestradiol to affect the expression of genes involved in regulating cellular growth and development; (v) affect body weight and patterns of oestrous cyclicity etc. in prenatal female rats even based on a low-dose exposure (approximately 0.1 mg BPA kg−1 body weight day−1); and (vi) enhance the toxicity of other toxicants such as cadmium through ER.15–20
As BPA is widely used in both households and in industry, it has been detected in raw sewage and treated effluents.6–10 To date, however, there is no study about the identification and quantification of BPA in water reclamation system. The objectives of this study are to identify and monitor BPA in a lab-scale microfiltration (MF) and reverse osmosis (RO) based water reclamation system.
Materials and methods
Reagents
BPA (99+%) was purchased from Aldrich. Anthracene-d10 (98 atom % D, Aldrich) was used as internal standard (IS). It was prepared at a concentration of 1.5 mg L−1 in n-hexane before use. All other reagents were of analytical-reagent grade unless otherwise stated. All organic solvents used in this study were of chromatography grade. Two stock solutions of 100 mg L−1 BPA were prepared in dichloromethane (DCM) and ethanol, respectively. The latter was used for the studies of recovery and analytical precision.Lab-scale water reclamation system
Among the advanced treatment processes for water reclamation, membrane technology is one of the most promising alternatives to meet the increasingly stringent regulations for water reclamation.21 In this study, a lab-scale MF-RO based water reclamation system was set up as shown in Fig. 1.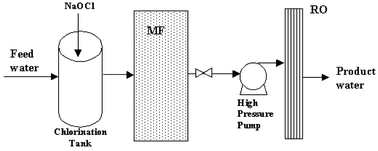 | ||
| Fig. 1 Schematic diagram of the lab-scale water reclamation system. | ||
Effluent from a municipal wastewater treatment plant using activated sludge system was used as feed water for this study. Feed water was stored at 4 °C before use. The characteristics of feed water is summarized in Table 2.
| Parameters | pH | TDS/mg L−1 | Turbidity/NTU | DOC/mg L−1 |
|---|---|---|---|---|
| Values | 7.33∼8.05 | 470∼860 | 4.1∼5.3 | 13.6∼27.2 |
As shown in Fig. 1, feed water was chlorinated by using sodium hypochlorite (with a dosage of 4 to 5 mg L−1 and a contact time of 1 to 2 min.) before passing through the membrane system. The effluent from the chlorination tank has 1.5 mg L−1 of free chlorine to prevent bio-fouling from being developed in the subsequent membrane systems. MF process was used as pretreatment for the RO system. The MF and RO modules were operated in series and backwashed or washed (with Triclean™ 214TF, Trisep Corporation) regularly, based on the procedure recommended in the manufacturer's manual. The configuration and operation parameters of the MF-RO system is summarized in Table 3.
| Configuration | Microfiltration | Reverse osmosis |
|---|---|---|
| Model | OSMONICS-DESAL™ E-500 | NIMBUS™ H-125, H-400 |
| Total reactor units/systems | 1 | 1 |
| Type of the filter | Hollow fiber | TFC |
| Pore size | 0.05 micron | — |
| Material | Polysulfone | Polyamide |
| Length/cm | 25.4 | 25.4 × 6.3 |
| Operational parameters | ||
|---|---|---|
| Flow rate of product water/L min−1 | 0.2 | 0.04 |
| Feed pressure/kg cm−2 | 0.703 | 3.515 |
| Recovery rate (%) | — | 20 |
Sample collection and extraction
In each batch of sampling, samples were collected after the system had obtained its stable operation (after running for 2 h). The samples consisted of feed water (FW), effluent from chlorination tank (E-Cl), effluent from MF system (E-MF), and RO permeate (P-RO). All the samples were collected from appropriate sampling points that were connected to the feed and effluent systems.In this study, at least three independent samples were collected at each sampling point and the collected samples were extracted within 2 weeks after their collections. The feed water samples were pre-filtered using a GF filter (pore size 1.2 µm, diameter 55 mm, Whatman) before extraction.
The liquid extraction procedure for water sample developed by del Olmo et al.22 was employed with minor modifications. 30 g of NaCl (heated at above 400 °C for 2 h before use) was added to 1 L of the sample and the pH was adjusted to between 2.0 and 3.0 (with 3–5 drops of 1∶1 HCl). The sample was then extracted with three portions of 60 mL DCM. The extract was collected and transferred to a Kuderna–Danish evaporator. After evaporation at 70 °C to a volume of approximately 3 mL, the extract was then concentrated to a final volume (1 mL for feed water samples, and 0.5 mL for other samples) using nitrogen gas at room temperature. No anhydrous sodium sulfate was used for drying, as it would reduce the BPA recovery efficiency (observed in the preliminary extraction tests). Before injecting into a GC-MS, anthracene-d10 solution was added to the concentrate (50 µL for feed water sample, and 25 µL for other samples). For every ten samples, one blank sample (based on distilled water) was introduced. This blank sample served as a QC exercise to detect possible contamination that could result from the sample pretreatment process.
GC-MS analysis
BPA detection was referred to in ref. 22 and 23. Sample extracts were analyzed using a Hewlett Packard 6890 GC (fitted with HP 7673 Automatic Liquid Sampler) coupled with a Hewlett Packard 5972A MS (with an EI of 70 eV). Separation was performed using a 30 m × 0.25 mm id DB5 column with 0.25 µm film thickness (J&W Scientific, 5% diphenyl–95% dimethyl polysiloxane coating film). The data analysis was based on the Enhanced ChemStation software (Hewlett Packard, G1701BA version B.01.00). The quantification of BPA was performed by selective ion monitoring (SIM) mode in MS. The MS detector was tuned once every day by using perfluorotributylamine (PFTBA) as the calibration standard. The parameters of GC-MS analysis are summarised in Table 4.| Parameters for GC | |
|---|---|
| Carrier gas | Helium (purity > 99.99%) |
| Total flow rate | 100 mL min−1 |
| Carrier gas flow rate | 1.8 mL min−1 |
| Pressure | 100 kPa |
| Inlet temperature | 250 °C |
| Injected volume | 2 µL |
| Injection mode | Splitless |
| Oven program | Initial temperature 50 °C, hold 1 min, 25 °C min−1 to 150 °C, hold 1 min, 10 °C min−1 to 270 °C, hold 2 min |
| Parameters for MS | |
|---|---|
| GC-MS interface temperature | 280 °C |
| Electron multiplier voltage | 2400–2600 V |
| Selected ions (m/z) in SIM | IS 94, 187, 188 |
| BPA 119, 213, 228 |
Two working standard curves were freshly prepared for BPA quantification, with concentration ranges from 1.25 to 10 µg L−1 for feed water samples and 0.5 to 2 µg L−1 for other samples. Each standard curve was renewed once every two weeks. To validate the method, precision and recovery were checked by spiking 0.5 µg L−1 and 5 µg L−1 of BPA into 12 portions of distilled water and feed water samples over one week time, respectively. Confirmation of BPA chromatography was based on the ion ratio of molecular ion peak and bass ion peak obtained from MS, namely, confirmation ratio = (abundance of 228/abundance of 213) × 100%.23
Results and discussion
GC-MS analytical performance
The two calibration curves established in this study exhibited a good linear trend with coefficients of determination at 0.9929 (for concentration range of 1.25–10 µg L−1) and 0.9875 (for concentration range of 0.5–2 µg L−1), respectively. As shown in Table 5, the average recoveries of the 0.5 µg L−1 and 5 µg L−1 BPA spiked samples (in distilled water) were 88.2% and 94.1%, respectively. It is also noted from Table 5 that the average recoveries of the corresponding fortified samples of feed water were 89.5% and 92.1%, respectively. These observations indicated that the precision of the detection method was very good, as the relative standard deviations for all measurements were less than 10% at spiking levels of 0.5 and 5.0 µg L−1. These criteria met the requirements recommended in ref. 23.| Spiking matrix | Distilled water | Feed watera | ||
|---|---|---|---|---|
| a The results for feed water were corrected by subtracting the background values, as all samples from feed water contain detectable amount of BPA. | ||||
| Spiking level/µg L−1 | 0.5 | 5.0 | 0.5 | 5.0 |
| BPA mean recovery ± standard deviation (%) | 88.2 ± 8.2 | 94.1 ± 6.3 | 89.5 ± 8.8 | 92.1 ± 7.2 |
The instrumental limit of detection was identified at a signal to noise ratio of 3∶1. Accordingly the detection limit was determined at 20 ng L−1 based on the analysis of a serial of diluted stock solutions. The limit of quantification was determined at 100 ng L−1 representing the signal to noise ratio of above 10∶1 and with appropriate recovery (112.5%). All blank samples did not show any detectable BPA signal.
The typical gas chromatogram and SIM mass spectrum were shown in Figs. 2 and 3, respectively. The precision of confirmation ion ratio was satisfactory, as the relative standard deviation of confirmation ratios was 8.3% among working standards, fortified samples and spiked distilled water samples.
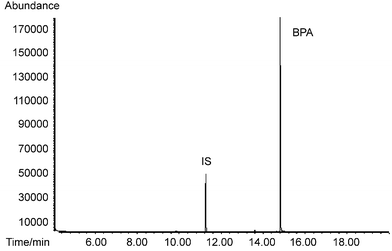 | ||
| Fig. 2 Typical gas chromatogram of BPA in SIM mode (conditions listed in Table 4). | ||
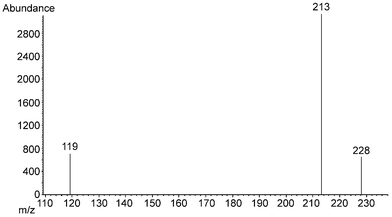 | ||
| Fig. 3 SIM mass spectrum of BPA (conditions listed in Table 4). | ||
BPA removal by the lab-scale water reclamation system
The monitoring data was shown in Table 6. The ANOVA statistical analysis revealed that significant BPA abatement was achieved by the lab-scale dual membrane system (F = 21.22, P < 0.0001).| Sampling date | FW | E-Cl | E-MF | P-RO |
|---|---|---|---|---|
| a All concentration in µg L−1. (n), analyzed number. nd., not detectable (<0.02 µg L−1). | ||||
| Jun.14th 2001 | 3.04 ± 0.22(5) | 0.64 ± 0.05(5) | 0.35 ± 0.03(5) | nd.(3) |
| Aug.22th 2001 | 2.01 ± 0.16(5) | 0.56 ± 0.04(5) | 0.36 ± 0.03(5) | nd.(3) |
| Oct.24th 2001 | 1.18 ± 0.12(3) | 0.30 ± 0.02(3) | 0.20 ± 0.02(3) | nd.(3) |
| Nov.27th 2001 | 1.90 ± 0.18(3) | 0.35 ± 0.03(3) | 0.21 ± 0.01(3) | nd.(3) |
It was noted from Table 6 that a low concentration of BPA, ranging from 1.18 to 3.04 µg L−1, was present in the feed water during the course of this study. A literature review revealed that BPA concentration in wastewater and water receiving bodies typically varied considerably. It was reported that BPA in wastewaters ranged from 0.23 to 149.2 µg L−1 in selected industrial wastewaters of Toronto area, Canada;10 0.09 to 12 µg L−1 in stream samples in US;24 and 1.0 to 50 µg L−1 in industrial emitters and communal wastewaters in Japan.9 The differences in BPA levels are probably due to consuming and discharging patterns and the fluctuation of rainfall and runoff characteristics.
It was observed in this study that BPA concentration decreased significantly after the chlorination process (72.1–81.6% BPA degraded) (Table 6). This finding confirmed that BPA is easily reduced by sodium hypochlorite chlorination.25 Most recently, Kuruto-Niwa et al.26 has reported that chlorinated BPA, such as 3-ClBPA, 3,3-diClBPA and 3,3,5-triClBPA, could still exhibit some oestrogenic activity as observed from in vitro tests and that polychlorinated BPAs were not easily biodegraded. Although these chlorinated BPA compounds are likely to be rejected by the RO membrane as their molecular weights are above 150,21 it might be necessary to incorporate the detection of chlorinated BPA compounds in the future or to substitute chlorine with other disinfectants or anti-biofouling agents.
It was noted from this study that 33.3 to 45.3% of BPA was removed by MF membrane, whereas more than 90.0% (calculated based on 0.02 µg L−1 as detection limit) was rejected by RO membrane (Table 6). It was also observed that rejection of BPA by RO membrane was not sensitive to the variations in raw feed water characteristics experienced in this study (Table 2). In addition, it was noted that the BPA concentration present in raw feed water did not exert any significant impact on RO performance in terms of BPA rejection (Table 6). This finding suggested that the lab-scale dual-membrane water reclamation system can effectively and consistently abate BPA to an undetectable level. It therefore suggests that membrane technology should be exploited whenever BPA could potentially be present in source water, if direct or indirect potable usage is being considered.
References
- WEF–AWWA, Using Reclaimed Water to Augment Potable Water Resources: a Special Publication, Water Environment Federation, 1998, ch. 1 Search PubMed.
- B. B. Levine, K. Madireddi, V. Lazarova, M. K. Stenstrom and M. Suffet, Water Sci. Technol., 1999, 40, 293 CrossRef CAS.
- B. Levine, K. Reich, P. Sheilds, I. H. Suffet and V. Lazarova, Water Sci. Technol., 2001, 43, 249 Search PubMed.
- J. A. McLachlan, Endocrine Rev., 2001, 22, 319 Search PubMed.
- M. Sharpe, J. Environ. Monit., 1999, 1, 5N RSC.
- R. A. Rudel, S. J. Melly, P. W. Geno, G. Sun and J. G. Brody, Environ. Sci. Technol., 1998, 32, 861 CrossRef CAS.
- M. Sole, M. J. Lopez De Alda, M. Castillo, C. Porte, K. Ladegaard-Pedersen and D. Barcelo, Environ. Sci. Technol., 2000, 34, 5076 CrossRef CAS.
- H. Fromme, T. Küchler, T. Otto, K. Pilz, J. Müller and A. Wenzel, Water Res., 2002, 36, 1429 CrossRef CAS.
- M. Furhacker, S. Scharf and H. Weber, Chemosphere, 2000, 41, 751 CrossRef CAS.
- H. B. Lee and T. E. Peart, Water Qual. Res. J. Canada, 2000, 35, 283 Search PubMed.
- T. Yamamoto and A. Yasuhara, Chemosphere, 1999, 38, 2569 CrossRef CAS.
- M. Y. Chen, M. Ike and M. Fujita, Environ. Toxicol., 2002, 17, 80 CrossRef CAS.
- K. A. Mountfort, J. Kelly, S. M. Jickells and L. Castle, Food. Addit. Contam., 1997, 14, 737 CAS.
- N. Olea, R. Pulgar, P. Perez, F. Olea-Serrano, A. Novillo-Tertrell, V. Pedraza, A. M. Soto and C. Sonnenschein, Environ. Health. Perspect., 1996, 104, 298 Search PubMed.
- K. W. Gaido, L. S. Leonard, S. Lovell, J. C. Gould, D. Babai, C. J. Portier and D. P. McDonnell, Toxicol. Appl. Pharmacol., 1997, 143, 205 CrossRef CAS.
- T. E. Schafer, C. A. Lapp, C. M. Hanes, J. B. Lewis, J. C. Wataha and G. S. Schuster, J. Biomed. Mater. Res, 1999, 45, 192 CrossRef CAS.
- R. M. Bergeron, T. B. Thompson, L. S. Leonard, L. P. Kevin and W. Gaido, Mol. Cell. Endocrinol., 1999, 150, 179 CrossRef CAS.
- A. M. Aloisi, D. D. Seta, I. Ceccarelli and F. Farabollini, Neurosci. Lett., 2001, 310, 49 CrossRef CAS.
- B. S. Rubin, M. K. Murray, D. A. Damassa, J. C. King and A. M. Soto, Environ. Health. Perspect., 2001, 109, 675 Search PubMed.
- N. Sogawa, K. Onodera, C. A. Sogawa, Y. Mukubo, H. Fukuoka, N. Oda and H. Furuta, Methods Find. Exp. Clin. Pharmacol., 2001, 23, 395 Search PubMed.
- H. Ozaki and H. Li, Water Res., 2002, 36, 123 CrossRef CAS.
- M. del Olmo, A. Gonzalez-Casado, N. A. Navas and J. L. Vilchez, Anal. Chim. Acta, 1997, 346, 87 CrossRef CAS.
- Bisphenol A Analytical Working Group, Analytical Method Criteria for the Determination of Bisphenol A in Various Matrices, April 2000, (available at http://www.bisphenol-a.org) Search PubMed.
- D. W. Kolpin, E. T. Furlong, M. T. Meyer, E. M. Thurman, S. D. Zaugg, L. B. Barber and H. T. Buxton, Environ. Sci. Technol., 2002, 36, 1202 CrossRef CAS.
- T. Yamamoto and A. Yasuhara, Chemosphere, 2002, 46, 1215 CrossRef CAS.
- R. Kuruto-Niwa, Y. Terao and R. Nozawa, Environ. Toxicol. Pharmacol., 2002, 12, 27 CrossRef CAS.
| This journal is © The Royal Society of Chemistry 2003 |