Solid-phase microextraction to monitor the sonochemical degradation of polycyclic aromatic hydrocarbons in water
Elefteria
Psillakis
*,
Alexander
Ntelekos
,
Dionissios
Mantzavinos
,
Efthymios
Nikolopoulos
and
Nicolas
Kalogerakis
Department of Environmental Engineering, Technical University of Crete, Polytechneioupolis, GR-73100 Chania, Greece. E-mail: epsilaki@mred.tuc.gr; Fax: +30-28210-37683; Tel: +30-28210-37635
First published on 21st November 2002
Abstract
Solid-phase microextraction (SPME) coupled with GC-MS has been used to monitor the degradation of polycyclic aromatic hydrocarbons (PAHs) by ultrasound treatment. Immersion SPME sampling enabled the fast and solventless extraction of target contaminants at the low µg l−1 concentration level. The developed protocol was found to be linear in the concentration range from 0.1 to 50 µg l−1 for most target analytes, with the limits of detection ranging between 0.01 and 0.70 µg l−1 and the relative standard deviations between 4.31 and 27%. The developed SPME protocol was used to follow concentration profiles of aqueous solutions containing 16 PAHs, which were subject to low frequency ultrasonic irradiation. At the conditions employed in this study (80 kHz of ultrasound frequency, 130 W l−1 of applied electric power density, 30 µg l−1 of initial concentration for each of the 16 PAHs), sonochemical treatment was found capable of destroying the lower molecular weight PAHs (naphthalene, acenaphthylene, acenaphthene, fluorene, phenanthrene, anthracene, fluoranthene and pyrene) within 120–180 min of irradiation. The higher molecular weight PAHs were more recalcitrant to ultrasound treatment.
1. Introduction
Water pollution by organic compounds is a major environmental concern throughout the world. Polycyclic aromatic hydrocarbons (PAHs) are a group of organic compounds which have received considerable attention due to their toxicity, mutagenicity, and carcinogenicity in animals. Contamination by PAHs in nature occurs from natural and anthropogenic sources. PAHs are generally formed during the incomplete combustion or pyrolysis of organic matter and contaminate all the environmental compartments such as air, soil and water.1 Volcanic eruptions, forest and prairie fires are among the major natural sources of PAHs. Important anthropogenic sources include domestic and coal heating, vehicle exhausts, waste incinerators, coke and asphalt production and other industrial activities, due primarily to incomplete combustion. PAHs generally occur as complex mixtures and not as single compounds, thus providing information on their sources. Once they enter the aquatic environment the behaviour and fate of each component depends on its physicochemical properties.While the solubility of PAHs is generally quite low and primarily decreases with increasing molecular weight, their hazard potential can be relatively high. The latter makes their presence in the water cycle an acute and chronic risk to human health and environmental quality.1 In light of this, research is directed towards developing (a) inexpensive, simple and efficient sample preparation and analytical techniques for the detection of even trace quantities of PAHs in water samples, and (b) treatment technologies for the destruction of PAHs in water.
Today, solid-phase extraction (SPE) and liquid–liquid extraction (LLE) are the two most frequently used techniques for the recovery and preconcentration of PAHs from water samples.2,3 Both techniques, and in particular LLE, are multi-step processes, prone to loss of analytes, and demand the use of large volumes of toxic and flammable organic solvents.4 Arthur and Pawliszyn5 developed a new solvent-free extraction technique, termed solid-phase microextraction (SPME), where analytes partition between the stationary phase on a fibre and the aqueous phase until equilibrium is achieved. SPME has been successfully used for the extraction of PAHs6–12 from aqueous samples as well as for a wide range of other applications.13,14
Ultrasonic irradiation is employed in a variety of industrial processes, such as welding of thermoplastics and metals, homogenisation of emulsions, cleaning and degreasing.15,16 Recently, interest has been directed towards the development of an innovative treatment for hazardous chemical destruction based on the use of ultrasound. The potential uses of power ultrasound in this area are enormous and still remain to be explored.16 The chemical degradation effects of ultrasound derive from acoustic cavitation, i.e., the formation, growth and implosive collapse of cavitation bubbles in a liquid. Extreme temperatures and pressures can be developed locally within the bubbles during their collapse with these bubbles serving as hot spot microreactors in an otherwise cold liquid. It is generally believed17 that there are three potential sites for chemical reactions in ultrasonically irradiated aqueous solutions, namely the bubble itself, the interface between the bubble and the surrounding liquid, and the solution bulk. Compounds may degrade directly via pyrolytic reactions occurring inside the bubble and/or at the interfacial region or indirectly via radical reactions occurring at the interface and/or in the solution bulk. The latter involve the participation of OH radicals and possibly H atoms, which are formed from the water dissociation within the bubble and migrate towards the interface and the solution bulk.
In previous studies, the beneficial effect of ultrasonic irradiation on the degradation of several target compounds from aqueous solutions in either bench-scale or large-scale applications has been demonstrated. Such compounds include, amongst others, phenol and substituted phenols, chlorinated hydrocarbons, pesticides, azo dyes and surfactants.15,18–22 However, it is notable that relatively few studies report the use of ultrasound for the remediation of PAHs in water, despite the fact that these contaminants frequently occur in wastewater (such as the effluents of biological wastewater treatment plants).
The sonochemical degradation of phenanthrene and biphenyl in synthetic aqueous solutions was first studied by Wheat and Tumeo23 using GC-FID and GC-MS to follow the concentration of the respective substrate and its degradation intermediates. Taylor et al.24 and Laughrey et al.25 studied the sonochemical degradation of anthracene, phenanthrene and pyrene with emphasis on the effect of matrix components (i.e., fulvic and benzoic acids, pentanol, pentane and sodium dodecyl sulfate) and purging gases (i.e. nitrogen and oxygen) on the kinetics of PAHs degradation. Concentration–time profiles of PAHs during ultrasonic irradiation were followed spectroscopically by measuring PAHs fluorescence, while HPLC coupled with fluorescence detection was used to identify reaction intermediates. In further studies, Park et al.26 studied the effect of various operating conditions (i.e., pH value, ultrasound intensity, addition of hydrogen peroxide as a radical promoter) on the sonochemical degradation of phenanthrene, anthracene, pyrene, coronene, 1-methylnaphthalene and 1,12-benzoperylene in water–ethanol mixtures. The concentration of each substrate was measured by means of UV/Vis absorbance, while GC-MS was used to identify degradation by-products. Little et al.27 studied the sonochemical degradation of phenanthrene as a model PAH molecule, by monitoring the influence of parameters such as power ultrasound energy, temperature and light. Qualitative analysis was performed by using an HPLC system and for quantification, a UV/Vis spectrophotometry system confirmed reduction of phenanthrene during sonication.
The primary scope of this work is to develop a SPME-GC-MS protocol, which will enable the monitoring of PAHs concentration in water. For the first time aqueous solutions containing all 16 PAHs listed by the US Environmental Protection Agency (USEPA) were subjected to ultrasonic treatment and degradation rates were measured using the aforementioned protocol. Although previous reports have dealt with the ultrasonic degradation of single-component solutions containing some of the lower molecular weight PAHs, this is the first report on the use of SPME-GC-MS to monitor the sonochemical degradation of multi-component PAHs solutions.
2. Experimental
2.1. Chemicals
All solvents were pesticide-grade and were obtained from Merck KGaA. The deionized water used for sample preparation was obtained from a water purification system supplied by Barnstead/Thermolyne Corporation (EASYpure® RF). Sodium chloride was purchased from Merck KGaA. Analytical standards of 13 priority PAHs in acetone were purchased from Supelco (Sigma–Aldrich Chemie GmbH). This solution contained 500 µg ml−1 of the following components: acenaphthylene, fluorene, phenanthrene, anthracene, pyrene, benzo[a]anthracene, chrysene, benzo[b]fluoranthene, benzo[k]fluoranthene, benzo[a]pyrene, indeno[1,2,3-cd]pyrene, dibenzo[a,h]anthracene, benzo[ghi]perylene. A 500 µg ml−1 acetonitrile solution of the remaining three PAH priority pollutants, namely acenaphthene, fluoranthene and naphthalene (all >99% and purchased from Aldrich Chemie GmbH, Steinheim, Germany) was prepared. A 500 µg ml−1 acetone solution of acenaphthene-d10, phenanthrene-d10, and chrysene-d12, purchased from Supelco (Sigma–Aldrich), was used as the internal standard solution.2.2. Ultrasound source and reactor setup
An Ultrason 250 (LabPlant, UK) horn-type sonicator, capable of operating either continuously or in a pulse mode at a fixed frequency of 80 kHz and a variable electric power output up to 150 W, was used for the sonication experiments. Reactions were carried out in a round-bottomed, cylindrical, all-glass reaction vessel equipped with a cooling jacket. The titanium-made horn was tightly sealed to the reaction vessel using two O-rings and a Teflon valve. The removable glass-made top part of the reaction vessel was sealed with an O-ring and a metal collar and equipped with two sampling ports with glass stoppers and a glass tube. The liquid bulk temperature was monitored with a Pt100 temperature sensor housed inside the glass tube and connected to a temperature control unit (Polystat cc2 Model, manufactured by Huber, Germany). To avoid any photochemical reactions the vessel was covered with aluminium foil. A schematic diagram of the reactor setup is shown in Fig. 1. Two series of experiments were carried out where ultrasonic irradiation was applied either in pulse mode (1 min on, 1 min off) with the liquid bulk temperature being kept constant at 25 °C (run A) or continuously without temperature control (run B). In all cases, 580 ml of an aqueous solution containing 30 µg l−1 of each PAH under consideration (i.e. the initial total PAH concentration was 480 µg l−1) were subject to ultrasonic irradiation at a constant electric power output of 75 W. Samples of about 5–10 ml were periodically drawn from the vessel and analysed by means of SPME-GC-MS.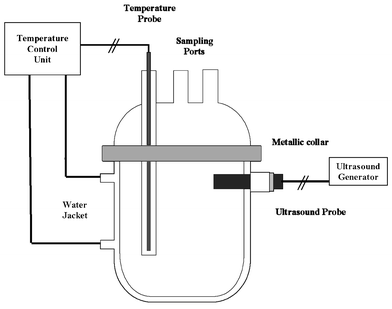 | ||
| Fig. 1 Schematic diagram of the reactor setup. | ||
2.3. Solid-phase microextraction procedure
Working standard solutions were prepared daily at the concentration levels of interest. 5 ml of the spiked working standard solutions containing 4.7% NaCl w/v were transferred into 7 ml clear glass vials and sealed with black Viton septa and screw caps with a hole, all purchased from Supelco (Bellefonte, PA, USA). The caps were lined with aluminium foil. Regarding the samples taken from the reaction vessel, their salt content was first adjusted at 4.7% (NaCl w/v) and then 5 ml of these sample solutions were removed and analyzed according to the same SPME procedure. Magnetic stirring with a glass coated stirring bar was used to agitate the solution at approximately 1000 rpm, 90% of the maximum speed of the stirrer. SPME was performed using a manual 100 µm polydimethylsiloxane (PDMS) SPME fibre and a SPME fibre holder assembly, all purchased from Supelco, Sigma–Aldrich Chemie. For all quantification experiments, the salted aqueous solutions were spiked prior to extraction with the exact amount of the internal standard solution. The SPME fibre holder assembly was then clamped at a fixed location above the glass vial containing the stirred spiked sample solution. The SPME fibre was exposed to the salted aqueous phase and, after sampling for 60 min, the fibre was retracted and transferred to the heated injection port of the GC-MS for further analysis. Possible carryover was removed by keeping the fibre in the injector for an additional time under the splitless mode. Moreover, blanks were run periodically during the analysis to confirm the absence of contaminants.2.4. GC-MS analysis
All analyses were carried-out on a Shimadzu GC-17A (Version 3) QP-5050A Gas Chromatograph-Mass Spectrometer (GC-MS) system. The split/splitless injector operated at 270 °C, with the purge flow closed for 5 min. Helium was used as a carrier gas at 1.2 ml min−1 flow-rate. Separation was performed on a 30 m × 0.25 mm × 0.25 µm HP-5MS capillary column (Hewlett-Packard Co., Palo Alto, CA, USA). A solvent delay time of 1 min was used. The column oven was programmed as follows: 50 °C for 5 min, programmed to 160 °C at a rate of 10 °C min−1, held for 2 min, increased to 300 °C at a rate of 5 °C min−1 and then to 310 °C at a rate of 25 °C min−1, and finally held for 10 min. The ionization mode was electron impact (70 eV). Data was acquired in the full-scan detection mode from 50 to 350 u at rate of 0.5 scan s−1. The interface temperature was set at 330 °C and the detector voltage was 1.40 kV. Quantification of the sample PAHs was based on the GC-MS peak areas found for the base peak of each analyte compared with the base peak of the deuterated PAHs internal standards.3. Results and discussion
3.1. SPME method: extraction conditions and method's performance
There are two main types of SPME sampling: immersion sampling, where the fibre is immersed into the aqueous solution, and headspace sampling, where the fibre is exposed to the headspace above the liquid (or solid) sample.14 Immersion sampling is widespread in the SPME approach, but for volatile compounds and dirty samples the headspace mode is preferred as it results in faster equilibration times and higher selectivity. In the case of PAHs in water matrices both sampling methods have been previously investigated. It was found that headspace SPME extracted efficiently only the lower molecular weight PAHs6,7 (even when applying elevated temperatures, i.e. 80 °C), whereas immersion SPME resulted in the detection of all 16 PAHs.8,10 Thus, in the present studies immersion sampling was used for all experiments.Previous studies on the optimization of the SPME procedure for the extraction of PAHs from water samples revealed that extraction was enhanced when using either a polyacrylate (PA) or a PDMS fibre.10 Although the use of the PA fibre increased the signal response for the two- and three-ring PAHs relative to the PDMS fibre, it was also reported that higher molecular weight PAHs were best extracted when using the PDMS fibre.10 Therefore, the 100-µm PDMS fibre was used for all experiments.
Other parameters, which were controlled for optimizing the SPME method, were the ionic strength of the aqueous solution and agitation of the sample. Salt addition can significantly increase the sensitivity of the method, especially for polar analytes, due to the salting-out effect. However, very high salt contents during immersion SPME can irreversibly damage the fibre, thus limiting its lifetime and introducing imprecision in the measurements.28 Therefore, a 4.7% NaCl w/v salt content was used for all experiments. Regarding agitation of the sample during SPME, it was found that consistent stirring of the aqueous solution enhanced extraction of the target analytes as it reduced equilibration times.13 Therefore, agitation at 1000 rpm (90% of the maximum stirring speed) was applied here, using a glass-coated stir bar which prevented analyte loss or sorption of analytes during extraction, a commonly encountered problem during PAHs analysis.
Overall the extraction conditions used for evaluating the performance of the SPME method were: 60 min immersion sampling, using a PDMS fibre, of 5 ml spiked water samples (4.7% NaCl), stirred at 1000 rpm and at room temperature.
A typical total ion chromatogram obtained when using these conditions is shown in Fig. 2. The PAHs separation yields a number of closely eluting peak pairs with significant time lapses between the pairs. Although the electron impact mode of the GC-MS is a powerful technique it does not provide spectral resolution of the critical pairs (namely phenanthrene–anthracene, benzo[a]anthracene–chrysene and indeno[1,2,3-cd]pyrene–dibenzo[a,h]anthracene). The USEPA Method 8270C clearly defines that sufficient gas chromatographic resolution is achieved if the height of the valley between adjacent isomer peaks is less than 25% of the sum of the two peak heights.3 The analytical results obtained here revealed that the above-mentioned critical pairs are more than sufficiently separated. There is, however, another isomeric pair (non-critical) but the USEPA Method 8270 C does not require separate determination as the two analytes frequently co-elute without any baseline separation.3 The two structural isomers which could not be sufficiently separated were benzo[b]fluoranthene and benzo[k]fluoranthene and are assigned in the text as an isomeric pair. It should be mentioned here that the limits of detection for these two analytes were not determined.
![Total ion chromatogram obtained with SPME-GC-MS for a spiked water sample (25 µg l−1) when using a 100-µm PDMS SPME fibre: (1) naphthalene, (2) acenaphthylene, (3) acenaphthene, (4) fluorene, (5) phenanthrene, (6) anthracene, (7) fluoranthene, (8) pyrene, (9) benzo[a]anthracene, (10) chrysene, (11) benzo[b]fluoranthene, (12) benzo[k]fluoranthene, (13) benzo[a]pyrene, (14) indeno[1,2,3-cd]pyrene, (15) dibenzo[a,h]anthracene, (16) benzo[ghi]perylene.](/image/article/2003/EM/b208970j/b208970j-f2.gif) | ||
| Fig. 2 Total ion chromatogram obtained with SPME-GC-MS for a spiked water sample (25 µg l−1) when using a 100-µm PDMS SPME fibre: (1) naphthalene, (2) acenaphthylene, (3) acenaphthene, (4) fluorene, (5) phenanthrene, (6) anthracene, (7) fluoranthene, (8) pyrene, (9) benzo[a]anthracene, (10) chrysene, (11) benzo[b]fluoranthene, (12) benzo[k]fluoranthene, (13) benzo[a]pyrene, (14) indeno[1,2,3-cd]pyrene, (15) dibenzo[a,h]anthracene, (16) benzo[ghi]perylene. | ||
Calibration was performed by extracting water samples spiked in the concentration range from 0.1 to 50 µg l−1 for most analytes. As can be seen in Table 1, linearity was very good, with the correlation coefficients (r2) ranging between 0.9811 and 0.9999. The r2 values obtained here were similar or better than the ones reported in the literature when using the SPME approach.9,10 The limits of detection (LOD) were determined according to published guidelines by comparing the signal-to-noise (S/N) ratio of the lowest detectable concentration to a S/N ratio of three. The LOD were found in the low µg l−1 level, ranging between 0.01 and 0.70 µg l−1 and were comparable to the LOD reported in the USEPA Method 8270C.3 In accordance with previous SPME reports regarding PAHs analysis,10 high LOD were observed for the higher molecular weight PAHs. It should be mentioned here that, although outside the scope of the present investigations, the LOD could be further improved by using the selective ion monitoring (SIM) mode of the MS detector. Finally, the reproducibility of the method expressed as the relative standard deviation (RSD) of five consecutive replicates (n = 5) ranged between 4.31% and 27 %. The RSD values obtained here were expected as they agreed with previous investigations using the SPME approach;10 in general, higher RSDs were found for the higher molecular weight PAHs.
| Analyte | Correlation coefficient (r2)a | Relative standard deviation (%) (n = 5)b | Limit of detection (LOD)/µg l−1c |
|---|---|---|---|
| a For analytes 1–10 the concentration range was 0.1–50 µg l−1, for 11 and 12 the range was 0.5–50 µg l−1 and for 13–15 the range was 1–50 µg l−1. b Spiking level was 1 µg l−1. c Lowest detectable concentration for a S/N ratio of approximately 3. d Isomeric pair: benzo[k]fluoranthene, benzo[b]fluoranthene. e n.d., Not determined. | |||
| Naphthalene | 0.9998 | 8.64 | 0.02 |
| Acenaphthylene | 0.9998 | 14.0 | 0.01 |
| Acenaphthene | 0.9999 | 9.02 | 0.01 |
| Fluorene | 0.9923 | 10.7 | 0.01 |
| Phenanthrene | 0.9905 | 3.73 | 0.01 |
| Anthracene | 0.9945 | 8.52 | 0.01 |
| Fluoranthene | 0.9903 | 4.31 | 0.01 |
| Pyrene | 0.9811 | 10.9 | 0.02 |
| Benzo[a]anthracene | 0.9925 | 11.9 | 0.01 |
| Chrysene | 0.9946 | 23.5 | 0.03 |
| Isomeric paird | 0.9979 | 18.9 | n.d.e |
| Benzo[a]pyrene | 0.9988 | 22.5 | 0.12 |
| Indeno[1,2,3-cd]pyrene | 0.9991 | 27.0 | 0.12 |
| Dibenzo[a,h]anthracene | 0.9997 | 26.5 | 0.70 |
| Benzo[ghi]perylene | 0.9986 | 13.3 | 0.70 |
3.2. SPME monitoring of PAHs sonochemical degradation
In Figs. 3 and 4, the normalised concentration–time profiles of PAHs during sonochemical degradation runs A and B are shown, respectively. It should be pointed out that for run A (carried out in pulse mode and with temperature control), the timescale shown in Fig. 3 corresponds to the actual sonication time (i.e., the ′on′ period of the duty cycle) rather than the overall treatment time (i.e., the ′on′ and ′off′ period of the duty cycle). It should also be pointed out that in order to minimise volatilisation losses during the experiments, a sealed reaction vessel was used. This is important as the low molecular weight PAHs, although relatively non-volatile, may be released to the headspace above the solution and lead to forged reduction of the PAHs concentration during sonochemical treatment.24 Here, the sealed design ensured that all PAHs released in the headspace could not escape; therefore, it can be assumed that volatilisation losses were negligible and the observed PAHs degradation was primarily due to ultrasound activity.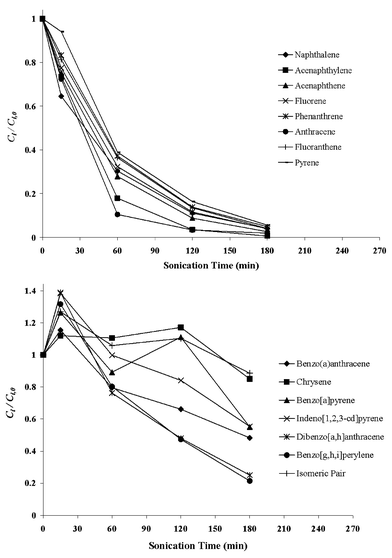 | ||
| Fig. 3 Normalised concentration–time profiles of PAHs during the run A sonochemical treatment (80 kHz ultrasound frequency, 75 W electric power output, 25 °C liquid bulk temperature and pulse mode of operation i.e. 1 min on, 1 min off). | ||
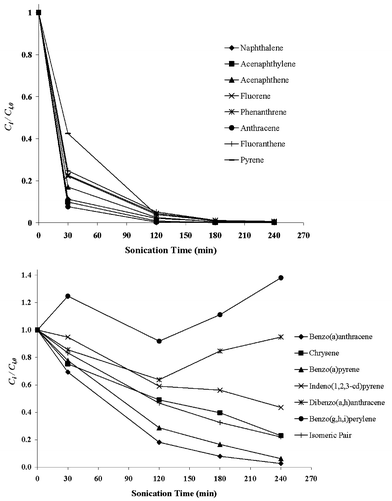 | ||
| Fig. 4 Normalised concentration–time profiles of PAHs during the run B sonochemical treatment (80 kHz ultrasound frequency, 75 W electric power output, uncontrolled liquid bulk temperature and continuous operation). | ||
As can be seen in Figs. 3 and 4, the lower molecular weight PAHs (naphthalene, acenaphthylene, acenaphthene, fluorene, phenanthrene, anthracene, fluoranthene and pyrene) are all readily susceptible to sonochemical degradation; almost complete removal can be achieved within 120–180 min of irradiation at the conditions under consideration. Conversely, the higher molecular weight PAHs (benzo[a]anthracene, chrysene, benzo[b]fluoranthene, benzo[k]fluoranthene, benzo[a]pyrene, indeno[1,2,3-cd]pyrene, dibenzo[a,h]anthracene and benzo[ghi]perylene) are more recalcitrant when compared to the lower molecular weight PAHs. Degradation rates during run B (uncontrolled temperature, continuous operation) are generally greater than those during run A (controlled temperature, pulse mode of operation). A possible explanation would involve the effect of liquid bulk temperature on degradation kinetics. The liquid bulk temperature throughout run B was uncontrolled and gradually increased from 25 °C (time zero) to 51.2 °C (after 240 min of sonication), while it was kept constant at 25 °C throughout run A. Little et al.,27 who studied the effect of liquid bulk temperature on the sonochemical degradation of phenanthrene at 30 kHz, reported that the extent of degradation substantially increased with increasing temperature from 20 to 40 °C. Sonochemical degradation of PAHs is likely to proceed through a combination of pyrolytic reactions (which may occur inside the bubble and/or at the bubble–liquid interface) and OH radical reactions (which may occur at the interface and/or in the solution bulk).24–26 The relative contribution of these mechanisms depends on both the physicochemical properties of the reaction system under consideration and the operating conditions employed;17,22 moreover, it is generally believed15,22 that gas-phase pyrolytic reactions are favoured at relatively high liquid bulk temperatures, while liquid-phase radical reactions are favoured at relatively low temperatures. Although the positive effect of liquid bulk temperature on degradation rates may imply some importance of pyrolytic reactions, it should be emphasised that mechanistic investigations regarding PAHs sonochemical degradation were outside the scope of this work.
Fluctuations in the concentration levels of some of the high molecular weight PAHs were observed during sonochemical treatment. This is possibly due to the fact that the accuracy of the SPME protocol for these contaminants, expressed in terms of RSD, is poor, ranging between 11.9 and 27%. For instance, such fluctuations were more pronounced during run A (controlled temperature, pulse mode of operation) for chrysene, benzo[a]pyrene and the isomeric pair, whose RSD values are 23.5, 22.5 and 18.9%, respectively, and during run B for dibenzo[a,h]anthracene and benzo[ghi]perylene, whose RSD values are 26.5 and 13.3%, respectively.
In previous studies,24–26 the sonochemical degradation of several PAHs was found to be first order with respect to the substrate concentration, i.e.
 | (1) |
 | (2) |
| PAH | Run Aa | Ref. 24 b | Ref. 25 c | Ref. 26 d |
|---|---|---|---|---|
| a Numbers in brackets show r2 values for the linear regression of the logarithm of concentration versus time. b System: single PAH in water; frequency: 20 kHz; electric power: 600 W; bulk temperature: 20 °C; liquid volume: 50–100 ml; initial PAH concentration: 20–100 µg l−1; sonication: pulse (1 s on, 9 s off or 1 s on, 4 s off). Mean values of several runs are quoted as results. c System: single PAH in water; frequency: 20 kHz; electric power: 600 W; bulk temperature: 20 °C; liquid volume: 50–70 ml; initial PAH concentration: 20–100 µg l−1; sonication: pulse (1 s on, 4 s off). Mean values of several runs are quoted as results. d System: single PAH in 70∶30 water:ethanol mixture; frequency: 20 kHz; electric power: 50 W; bulk temperature: 25 °C; liquid volume: 16 ml; initial PAH concentration: 40 mg l−1; sonication: continuous. | ||||
| Naphthalene | 18.1 (0.9937) | — | — | — |
| Acenaphthylene | 28 (0.9992) | — | — | — |
| Acenaphthene | 20.3 (0.9996) | — | — | — |
| Fluorene | 18 (0.9997) | — | — | — |
| Phenanthrene | 16.6 (0.9992) | 354 ± 18 | 660 ± 120 | 2.07 |
| Anthracene | 24.8 (0.9177) | 900 ± 360 | 1566 ± 18 | 2.18 |
| Fluoranthene | 17.4 (0.9974) | — | — | — |
| Pyrene | 15.7 (0.9935) | 360 ± 180 | 624 ± 54 | 1.98 |
Overall, the use of SPME proved to be an efficient tool for monitoring the degradation of PAHs, especially in the case of the lower molecular weight PAHs. However, under the present experimental conditions (type of SPME fiber and analytical equipment), no degradation by-products were detected during the sonochemical treatment. Studies dealing with the degradation products during ultrasound treatment form a part of other published reports. Wheat and Tumeo reported that the primary product in the case of phenanthrene aqueous sonochemical degradation was phenanthrenediol.23 In further studies, Little et al. reported that the aqueous sonochemical degradation of phenanthrene was accompanied by the formation of anthracene, naphthalene and phenol.27 Park et al. reported that pyrene degradation in water–ethanol solutions resulted in the formation of tetrahydro-2,5-dimethylfuran, tetrahydro-2-methylfuranol, 2,2-dimethyl-3-propyloxirane, 3,4-dihydro-6-methyl-2H-pyran and 1,2-benzenedicarboxylic acid.26
In this study, a protocol comprising SPME coupled with GC-MS has been developed to monitor trace levels of 16 PAHs in water. The overall sample preparation time as well as the consumption of toxic organic solvents were minimised without affecting the sensitivity of the method. The SPME protocol has been employed to monitor concentration profiles of PAHs in aqueous solutions subject to low frequency ultrasonic irradiation. With the conditions employed in this study, sonochemical treatment was found capable of effectively destructing most of the PAHs originally present in the reaction mixture.
References
- E. Manoli and C. Samara, Trends Anal. Chem., 1999, 6, 417 CrossRef CAS.
- R. M. Marcé and F. Borrull, J. Chromatogr. A, 2000, 885, 273 CrossRef CAS.
- USEPA, SW-846, Method 8270C, Semivolatile Compounds by Gas Chromatography/Mass Spectrometry (GC/MS), U.S. Environmental Protection Agency, Office of Solid Waste and Emergency Response, Washington, D.C., 1996.
- E. Psillakis and N. Kalogerakis, J. Chromatogr. A, 2001, 907, 211 CrossRef CAS.
- C. L. Arthur and J. Pawliszyn, Anal. Chem., 1990, 62, 2145 CrossRef CAS.
- C. Zwiener and F. H. Frimmel, Fresenius’ J. Anal. Chem., 1998, 360, 820 CrossRef CAS.
- D. Djozan and Y. Assadi, Microchem. J., 1999, 63, 276 CrossRef CAS.
- P. Popp, C. Bauer, M. Möder and A. Paschke, J. Chromatogr. A., 2000, 897, 153 CrossRef CAS.
- A. Paschke, P. Popp and G. Schüürmann, Fresenius’ J. Anal. Chem., 1999, 3630, 426 CrossRef CAS.
- R. A. Doong, S. M. Chang and Y. C. Sun, J. Chromatogr. A., 2000, 879, 177 CrossRef CAS.
- M. R. Negrão and M. F. Alpendurada, J. Chromatogr. A., 1998, 823, 211 CrossRef CAS.
- J. J. Langenfeld, S. B. Hawthorne and D. J. Miller, Anal. Chem., 1996, 68, 144 CrossRef CAS.
- H. Kataoka, H. L. Lord and J. Pawliszyn, J. Chromatogr. A., 2000, 880, 35 CrossRef CAS.
- R. Eisert and J. Pawliszyn, Crit. Rev. Anal. Chem., 1997, 27, 103 Search PubMed.
- H. Destaillats, T. M. Lesko, M. Knowlton, H. Wallace and M. R. Hoffmann, Ind. Eng. Chem. Res., 2001, 40, 3855 CrossRef CAS.
- T. J. Mason, Ultrason. Sonochem., 2000, 7, 145 CrossRef CAS.
- L. H. Thompson and L. K. Doraiswamy, Ind. Eng. Chem. Res., 1999, 38, 1215 CrossRef CAS.
- N. H. Ince, G. Tezcanli, R. K. Belen and I. G. Apikyan, Appl. Cat. B—Environ., 2001, 29, 167 CrossRef CAS.
- S. Goskonda, W. J. Catallo and T. Junk, Waste Manage., 2002, 22, 351 CrossRef CAS.
- N. Gondrexon, V. Renaudin, A. Bernis, Y. Gonthier and P. Boldo, Environ. Technol., 1993, 14, 587 Search PubMed.
- H. Okuno, B. Yim, Y. Mizukoshi, Y. Nagata and Y. Maeda, Ultrason. Sonochem., 2000, 7, 261 CrossRef CAS.
- H. Destaillats, T. W. Alderson and M. R. Hoffmann, Environ. Sci. Technol., 2001, 35, 3019 CrossRef CAS.
- P. E. Wheat and M. A. Tumeo, Ultrason. Sonochem., 1997, 4, 55 CrossRef CAS.
- E. Taylor Jr., B. B. Cook and M. A. Tarr, Ultrason. Sonochem., 1999, 6, 175 CrossRef CAS.
- Z. Laughrey, E. Bear, R. Jones and M. A. Tarr, Ultrason. Sonochem., 2001, 8, 353 CrossRef CAS.
- J. K. Park, S. W. Hong and W. S. Chang, Environ. Technol., 2000, 21, 1317 Search PubMed.
- C. Little, M. J. Hepher and M. El-Sharif, Ultrasonics, 2002, 40, 667 CrossRef CAS.
- E. Psillakis and N. Kalogerakis, J. Chromatogr. A., 2001, 938, 113 CrossRef CAS.
| This journal is © The Royal Society of Chemistry 2003 |