Systematic DIAL lidar monitoring of the stratospheric ozone vertical distribution at Observatoire de Haute-Provence (43.92°N, 5.71°E)
S.
Godin-Beekmann
,
J.
Porteneuve
and
A.
Garnier
Service d'Aéronomie du CNRS, Paris, France. E-mail: sophie.godin@aero.jussieu.fr
First published on 22nd October 2002
Abstract
Long term stratospheric DIAL (Differential Absorption Lidar) ozone lidar (Light Detection and Ranging) measurements have been performed at the Observatoire de Haute-Provence (OHP) since 1985 and as part of the Network for the Detection of Stratospheric Changes (NDSC) since 1991. This paper provides a detailed description of the DIAL lidar instrument implemented at OHP and a discussion of the ozone retrieval analysis. The instrument includes the detection of atmospheric nitrogen Raman scattering wavelengths, which is required for ozone measurements in the presence of strong volcanic aerosol loading. A comprehensive evaluation of the error budget in the 10–50 km altitude range is performed with particular emphasis on the bias associated with background and volcanic stratospheric aerosol. This bias is evaluated using ancillary measurements of the aerosol size distribution obtained from 1991 to 1999 after the Mount Pinatubo volcanic eruption. Results show that the bias associated with background aerosols is smaller than 1% above 13 km while the bias due to volcanic aerosols reaches a maximum of 5% above 15 km in the DIAL Raman ozone retrieval. In background aerosol conditions the total accuracy of the DIAL ozone vertical distribution at OHP ranges from 5% below 20 km to 15–30% above 45 km with a vertical resolution varying from 0.5 km to 5 km.
1. Introduction
The discovery of the Antarctic ozone hole in the early eighties triggered multiple investigations into the ozone layer. The understanding of the mechanisms responsible for the massive ozone destruction in Antarctica emphasized the importance of heterogeneous chemistry with respect to the stratospheric ozone budget. It was shown in particular that the influence of anthropogenic halogen compounds on stratospheric ozone was a maximum in both the upper and lower stratosphere on a global scale.1 Subsequent long-term trend studies showed that ozone depletion was indeed highest in the lower stratosphere and around 40 km, with trends in the former region providing the largest contribution to total ozone decrease.2 In addition substantial losses have been reported in the Arctic for various winters during the nineties and in 1999–2000.3 The causes of the mid-latitude ozone decrease are still under investigation: apart from the impact of polar ozone losses on mid-latitude regions through vortex erosion events and dilution after the vortex final break-up, the decreasing trends can be linked to heterogeneous chemical reactions on particulate matter such as sulfate aerosols outside the polar vortex as well as to changes in the basic stratosphere dynamics connected somehow to the ozone destruction in the polar vortex. Resolving these issues requires accurate long-term measurements of the ozone layer at global scale and in the whole stratosphere. In response to the Montreal protocol which underlined the necessity for careful ozone monitoring around the globe, the Network for the Detection of Stratospheric Changes (NDSC) was created in 1991. Supported by various national and international agencies, this network is based on a set of ground-based stations making use of state-of-the art and complementary sensor technology, and accepting a very strict data protocol. The objectives of NDSC are to establish a database of high quality ground-based measurements likely to permit an early detection of stratospheric ozone changes amidst the natural ozone variability, and to calibrate satellite-borne sensors that provide global coverage of the ozone field. The requirement for reliable ground-based data was highlighted by several international assessments of global ozone trends.2,4 While satellite data provide global fields likely to reduce the statistical variability of measured compounds, the drift of satellite instruments and their limited lifetime prevent them from providing reliable ozone trends on their own. A detailed description of the instruments and measurements sites involved in the NDSC can be found at the following website: http://www.ndsc.ws.The lidar was one of the first instruments to be selected in the frame of NDSC for the measurement of ozone vertical distribution and other atmospheric parameters such as temperature, stratospheric aerosols or water vapour. The Differential Absorption Lidar (DIAL) technique that is used for ozone has the advantage of providing self-calibrated measurements in the whole stratosphere with a reasonably good vertical and temporal resolution, particularly in the lower and middle stratosphere. Lidar measurements are complementary to ozone soundings which provide ozone profile measurements from the ground to around 30 km.
The objective of this paper is to describe DIAL stratospheric ozone measurements which are performed at Observatoire de Haute-Provence (OHP–43.9°N, 5.71°E) since 1985, in order to study the short-term and long-term stratospheric ozone variability at this location. It includes a detailed evaluation of the measurement error budget, with particular emphasis on errors that can affect the detection of long-term trends. It also provides a comprehensive description of the OHP lidar system, including the optical and electronic receiving systems that were implemented in 1994 and had not been published previously. The optical receiver is based on an original multiple-fibre concept that was developed at CNRS for various lidar instruments.5 The OHP DIAL lidar system was one of the first to be accepted within the NDSC. It is part of the primary Alpine station which includes also the Jungfraujoch Observatory for Fourier Transform Infrared (FTIR) spectroscopic measurements of several stratospheric compounds6 and the Observatoire de Bordeaux for microwave measurements of the ozone vertical distribution.7 The paper is organized as follows: after the Introduction, Section 2 is devoted to a reminder of the DIAL ozone technique and to the error budget evaluation. Particular emphasis is put on the influence of stratospheric aerosols on the measurement. Since the stratospheric aerosol optical depth can vary by two orders of magnitude after a major volcanic eruption like the one of Mount Pinatubo in June 1991,8 it is important to quantify this effect on a long-term basis. The description of the OHP lidar system and the ozone retrieval is presented in Section 3, while Section 4 provides a short description of the stratospheric ozone lidar data base at OHP. The conclusion focuses on the error sources that can affect the retrieval of ozone long-term trends by lidar measurements.
2. Principle of the ozone DIAL measurement
The lidar (Light Detection and Ranging) is an active remote sensing instrument based on the interaction of laser light with the atmosphere. According to the atmospheric parameter to be measured, lidar systems use various light-matter interactions such as Rayleigh, Mie and Raman scattering, absorption or fluorescence.9 The use of pulsed laser sources enables range-resolved measurements to be obtained. Lidar ozone measurements are performed using the DIAL (Differential Absorption Lidar) technique originally proposed by Shotland.10 This technique requires the simultaneous emission of two laser wavelengths characterized by a different ozone absorption cross-section. The spectral range is chosen in the ultraviolet where ozone absorption is most efficient, but the selected wavelength pair differs according to the altitude range of the measurements.11 Lidar measurements in the troposphere require a strong UV absorption in order to detect the small tropospheric ozone mixing ratios while for stratospheric measurements, the objective is to reach the stratosphere and measure the high ozone concentrations there.12,13 Furthermore, the simultaneous decrease in the upper stratosphere of the ozone number density and the atmospheric number density which provides the backscatter radiation has to be taken into account. This leads to the need for powerful laser sources and not too strongly absorbed wavelengths. Most teams working on this subject use XeCl excimer laser sources for the absorbed wavelength. These lasers emit directly in the UV at 308 nm14 and are very powerful (100 W is commonly reached with current systems). For the non-absorbed wavelength, different techniques are used among which the most common are the generation of a wavelength at 353 nm corresponding to the first Stokes radiation by stimulated Raman scattering in a cell filled with hydrogen,15,16 the use of the third harmonic of a Nd:Yag laser (355 nm),17,18 or the use of a XeF laser which provides a wavelength at 351 nm,19,202.1 Ozone retrieval from the lidar signals
The ozone number density is retrieved from the lidar signals according to the following equation:9 | (1) |
 | (2) |
is the differential extinction by other atmospheric compounds.

In the DIAL technique, the laser wavelengths are chosen so that the term δnO3(z) represents less than 10% of the term derived from the slope of the lidar signals in the altitude range of interest. The derivation of the ozone number density from the laser signals shows thus that the DIAL technique is a self-calibrated technique which does not need the evaluation of instrumental constants.
2.2 Accuracy and spatial resolution of the measurements
In the altitude range where both laser beams are contained in the telescope field of view, the accuracy of DIAL ozone measurements depends on the accuracy of the ozone absorption cross-sections used in the retrieval, on the laser line width since eqn. (1) is formulated for monochromatic radiations, on the estimation of δnO3(z), and on the linearity of the acquisition device. The precision of the measurement is defined by the statistical error due to the random character of the detection process which basically follows the Poisson statistics.9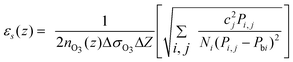 | (3) |
Due to the rapid decrease of the signal-to-noise ratio in the high stratosphere, it is necessary to degrade the vertical resolution of the measurement in order to limit the statistical error at this altitude range, to reasonable values. The final statistical error εs(z) on the measurement is the result of a compromise between the experimental system characteristics, the duration Ta of the measurement, and the final vertical resolution ΔZf according to the following relation, derived from eqn. (3) and the linear dependence of the lidar signals to the telescope area A, the emitted laser power Po and the vertical range over which the lidar signal is averaged:
 | (4) |
2.3 Measurement accuracy
The errors in the measurement linked to the ozone absorption cross section and to the laser line width have previously been evaluated for lidar ozone measurements in the upper stratosphere.22 The absolute value of the ozone absorption cross sections in the Huggins band below 320 nm are known with a ±3% accuracy and their relative precision over the same spectral range is reported to be better than 1–2%.23 The influence of the laser line width was estimated to introduce a small error of the order of ±0.8% that can be reduced to less than 0.2% if the laser spectral emission is monitored. These estimates are valid for ozone measurements in the whole stratosphere. The sensitivity of the ozone absorption cross-section to the local temperature and the Rayleigh extinction term in δnO3(z) are determined using daily pressure–temperature profiles provided by nearby radiosondes or meteorological analyses using assimilated satellite data or temperature lidar measurement in the upper altitude range. Interferences due to absorption by other minor constituents have also to be considered. In the 300–350 nm spectral range, the main other absorbers are SO2 and NO2. The SO2 mixing ratio usually decreases rapidly above the planetary boundary layer so this constituent does not interfere with DIAL stratospheric ozone measurements. However, major volcanic eruptions can inject massive amounts of SO2, with number densities reaching 1011 cm−3 up to 25 km and 15° in latitude from the eruption site.24 Since the SO2 absorption cross sections are of the same order as the ozone ones, the corresponding error on DIAL ozone measurements could then reach a few percent. However, the residence time of SO2 in the stratosphere is reported to be around 30–40 days,25 so massive injection of SO2 in the stratosphere do not perturb durably DIAL stratospheric ozone measurements. The error linked to NO2 absorption can be estimated using NO2 climatological profiles. The NO2 mixing ratio reaches a maximum value of about 10−8 around 35 km at northern mid-latitudes26 and the NO2 differential absorption cross section σNO2(λ1) − σNO2(λ2) is of the order of −3 × 10⁻¹⁹ cm2. The error linked to NO2 absorption on ozone measurements reaches thus a maximum value of 0.4% between 25 and 30 km and does thus not need to be corrected. | (5) |
In the presence of volcanic aerosol, εa(z) is dominated by the backscatter term of eqn. (5), directly linked to vertical gradients in the aerosol profile.27 In case of large stratospheric aerosol loading, as just after a major volcanic eruption, this error can exceed 100% in layers characterized by strong aerosol gradients. εa(z) can be evaluated by computing the aerosol backscatter ratio for the reference wavelength using the Klett method with an assumed backscatter to extinction ratio.28 The evaluation of εa(z) requires then the estimation of the aerosol backscatter and extinction coefficients spectral variation using ancillary measurements of the aerosol size distribution and the Mie theory. However, small deviations in the assumed size distribution can induce large variations in the spectral variation of the backscatter coefficient and the error on the correction can still exceed 100% in the case of very strong aerosol loading.29
A better way to address this problem is to detect the lidar signals corresponding to the first Stokes shift from Raman scattering by atmospheric nitrogen of the emitted wavelengths.30 If laser sources emitting at 308 nm and 355 nm are used, the corresponding Raman wavelengths are 331.8 nm and 386.7 nm respectively. The ozone number density is then determined from the lidar signals received at the λ1R and λ2R Raman wavelengths according to the following equation:
 | (6) |
 | (7) |
The advantage of this method is to suppress the aerosol contribution to the backscatter component of the lidar equation but its drawback is a loss of accuracy due to the much smaller Raman scattering efficiency: in the spectral range considered here, the Raman scattering cross-section is 3 orders of magnitude less than the Rayleigh scattering cross-section. In order to compensate this effect, one has to degrade the vertical resolution of the corresponding measurement following the compromise expressed in eqn. (4). The error on the Raman ozone profiles linked to the aerosol extinction has been shown experimentally to be less than 5% from measurements performed one year after the eruption of Mount Pinatubo.31 However, in order to detect ozone long-term trends which are estimated as several percent per decade in the mid-latitude lower stratosphere,3 it is still necessary to evaluate quite precisely the influence of stratospheric aerosol on the ozone measurements, even if Raman wavelengths are used at the altitude of the volcanic aerosol cloud. To this aim, we have used an ensemble of measurements of atmospheric aerosol size distributions performed in Laramie (USA) by Deshler et al.32 using balloon-borne optical particle counter instruments before and after the Mount Pinatubo eruption. These measurements sampled the aerosol cloud originating from the volcanic eruption. They were continued after the sedimentation of the aerosol cloud around the end of 1995, in order to survey the evolution of background aerosol. From the measured aerosol size distribution, fitted to log-normal size distributions, the extinction and backscatter aerosol coefficients were computed for the 308 and 355 nm emitted wavelengths and for the corresponding 1st Stokes nitrogen Raman wavelengths, using a routine based on Mie theory and proposed by Bohren and Huffman.33 This study allowed us to evaluate the effect of background aerosol on Rayleigh and Raman DIAL ozone retrievals and to study the temporal evolution of the bias linked to the presence of the Mount Pinatubo volcanic aerosol cloud. The bias associated with background stratospheric aerosol is represented in Fig. 1 for DIAL ozone Raman and Rayleigh retrievals. The background aerosol errors are averaged on the 1997–1999 period. For the Rayleigh signals, the errors linked to aerosol backscatter and extinction are shown separately. These errors sum up and the total reaches a maximum of 0.9% around 16 km. For the Raman retrieval, the error, only due to aerosol extinction, is slightly larger than the corresponding error in the Rayleigh retrieval, in relation with the larger spectral range of the wavelengths used in that case. This study shows thus that the bias linked to background aerosol on DIAL ozone retrieval does not exceed ±1% above 13 km.
 | ||
| Fig. 1 Bias due to the presence of background aerosol on DIAL ozone measurements. See text for explanation. | ||
Fig. 2 displays the temporal evolution at various altitude ranges of the bias introduced by the presence of Mount Pinatubo volcanic aerosol cloud on the ozone retrieval using the Raman wavelength pair. The error on DIAL Rayleigh ozone is not considered since only Raman DIAL signals should be used in the presence of volcanic aerosol. After the eruption, the stratospheric aerosol optical depth at 308 nm reached a maximum of 0.18 in the beginning of 1992, as compared to a mean value of 5.5 × 10⁻³ in the background aerosol period. In the 15–20 km range the aerosol extinction error does not exceed 5% but it can reach larger values lower down, due to both strong aerosol loading and low ozone amounts in that altitude range. The change of sign between 20 and 16 km is due to the fact that the aerosol extinction Angstrom coefficient appears to be negative from the end of 1991 to the end of 1992 above 18 km. The Angstrom coefficient describes the spectral variation of the aerosol extinction coefficient αa(λ1,z). It is defined as follows:
 | (8) |
For this study, m(z) was computed between 308 nm and 355 nm. In 1992, it reached a minimum value of −0.5 as compared to 1.5 during the background aerosol period. The variation of the Angstrom coefficient can be explained by the larger size of the particles after the volcanic eruption. At 18 km for example, the measured size distributions are monomodal during the background aerosol period with a mode radius of about 8 × 10⁻² µm, while in 1991–1992, the size distributions were bimodal with mode radii of 0.2 and 0.6 µm.26 The rate of decrease of the bias on the Raman DIAL ozone profiles is directly linked to the sedimentation rate of the particles, which is altitude-dependent.34 The bias decreases with a rate of about 1% per year at 15 km and 4% per year at 20 km, corresponding to the more rapid decline of the volcanic aerosol cloud at this altitude. This study demonstrates that spurious trends of a few percents per year and of opposite sign as a function of altitude can be introduced by the presence of volcanic aerosol clouds in the stratosphere on Raman DIAL ozone time series. Care must thus be taken when using data obtained in strong aerosol loading conditions, e.g. during the two year period after the eruption.
 | ||
| Fig. 2 Temporal evolution of the bias due to Mount Pinatubo volcanic aerosol on Raman DIAL ozone retrieval. | ||
 | ||
| Fig. 3 Residual error on DIAL ozone retrieval after correction of the systematic error linked to ozone absorption coefficients, Rayleigh extinction and background aerosol. | ||
2.4 Instrumental error sources
In addition to errors associated with the ozone retrieval, several experimental artefacts can alter the linearity of the lidar signals and thus introduce biases in the retrieved ozone concentration. The main problems encountered with the DIAL technique are the following:3. The OHP DIAL instrument
Systematic stratospheric DIAL ozone measurements began at OHP in 1986. From 1986 to 1993, a relatively simple lidar system was used, including XeCl and Nd:Yag laser sources, an 80 cm diameter Cassegrain telescope and two counting channels linked to a PC microcomputer for the acquisition.17 In order to improve the temporal resolution and accuracy of the ozone lidar measurements, the instrumental set-up was completely modified in 1993. A new optical detecting system was implemented, based on a multiple-fibre collector concept which was designed initially for the transportable lidar ELSA that was used during the European Arctic EASOE campaign in the winter 1991/1992.29 This concept was thereafter applied to various lidar systems built by Service d'Aéronomie. The following sections provide a detailed description of the lidar system which is still in operation at OHP.3.1 Laser transmitter
The ozone-absorbed laser radiation is provided by a Xenon Chloride Lambda Physik EMG 200 excimer laser emitting at 308 nm. An unstable resonator cavity is used to reduce the laser divergence to 0.6 mrad. The reference line is obtained from the third harmonic (355 nm) of a Continuum Nd:Yag laser emission at 1.06 µm. Both lasers operate at 50 Hz. The output energy of the excimer laser is 200 mJ per pulse. The output energy of the Nd:Yag laser is adapted to provide a return signal equivalent to the on-line signal at 40 km altitude, which results in an emitted pulse energy of approximately 40 mJ. In addition, two beam expanders are used to reduce the divergence of both lasers to 0.2 mrad and 0.1 mrad at 308 nm and 355 nm respectively.3.2 Optical and electronic receiving systems
A schematic view of the lidar layout is displayed in Fig. 4. The optical receiving system consists of four similar F/3 mirrors of 0.53 m diameter, which correspond to an equivalent receiving surface of 1.06 m diameter. Both laser beams are emitted in the centre of the collecting area so that each mirror acts as the receiver of an elementary lidar but the whole system is quasi-coaxial. The light is collected by four optical fibres of 1 mm diameter mounted in the focal plane of each mirror. The fibre mounts can be moved manually in the vertical direction for focusing. They are motorized in the X–Y directions to position the fibres exactly on the image of the scattered light. The optical fibres transmit the backscattered light to the optical analysing device which includes imaging optics, a mechanical chopper and a spectrometer designed for the wavelength separation. The chopper consists of a 40 W cooled motor which drives a blade of 140 mm diameter and 20 mm width, rotating at 24000 rpm in primary vacuum. The 1 mm fibres are assembled together on a line in a specially designed mount which enables a sharp opening of the lidar signal in 5.7 µs. A field lens is used to adapt the output beams to the entrance slit of the F/10 spectrometer. A layout of the spectrometer is displayed in Fig. 5. It comprises a Jobin Yvon 3600 groove per mm holographic grating providing a dispersion of 0.3 nm mm−1 and characterised by an efficiency of 52%. The overall transmission of the spectrometer ranges from 40 to 46% depending on the wavelength. | ||
| Fig. 4 Schematic view of the OHP lidar system. | ||
 | ||
| Fig. 5 Layout of the spectrometer used to separate the lidar signals. | ||
The detected wavelengths are 308 nm, 355 nm and the corresponding 1st Stokes wavelengths in the nitrogen vibrational Raman spectrum (331.8 nm and 386.7 nm). At the output of the monochromator, the elastically backscattered signals at 308 nm and 355 nm are separated into a low and a high altitude channel in the proportion 0.08/0.92 in order to account for the dynamic of the lidar signals in the measurement altitude range, so that in total, the lidar set up includes 6 optical channels. The optical signals are detected by 18 mm wide side-on bialkali photomultiplier tubes (Hamamatsu R2693P), characterised by a quantum efficiency of ∼20% in the 300–400 nm spectral range. The PMTs were selected for a current amplification of 107 at 1000 V voltage operation. The signal is amplified by a 150 MHz bandwidth amplifier to yield an anode current that corresponds to a pulse amplitude above the 1.2 V counting threshold. The amplification results in a broadening of the PMT pulses of up to 5 ns which helps avoid pulse wiggles. Furthermore, electronic gating of the PMT used for the high-energy Rayleigh signal detection was implemented in order to suppress eventual residual signal-induced noise in these channels.
Photon counting is used to process the electronic lidar signals. The counting boards were designed at CNRS. They use high speed counters (300 MHz) which are operated with 1024 time gates of 1 µs corresponding to a sampling vertical resolution of 150 m. For each channel, two counters work in parallel to avoid dead time between two memory bins. Despite the quality of the counters, overlapping pulses of finite duration limit the linearity of the counting system. The maximum count rate that can be used without modifying the signal linearity by more than 10% is in fact limited to 40–60 counts per µs, i.e. 5 times less than the capacity of the counters. As mentioned previously, this problem which affects essentially the Rayleigh signals in the altitude range of interest, is handled by the use of two optical channels for each Rayleigh signal. The whole experiment is controlled by a 486 Compaq PC. The master clock is set at 800 Hz and is provided by the mechanical chopper or by a quartz crystal in case of chopper breakdown. The clock triggers the lasers at 50 Hz with a 5 ms time delay between the firing of the excimer and the Nd:Yag lasers, in order to avoid possible cross-talk between the received signals. The trigger of the counter is set by the laser light pulse, which is detected by a fast photodiode and converted into a transistor-transistor-logic signal. The six counting channels are transferred simultaneously to the computer with an output–input 8 MHZ, 16 bit board. For each channel, the acquisition time of 1024 µs allows a good estimation of the background signals on more than 600 µs. The chopper opens at 8 km, providing full energy lidar signals for ozone retrieval from 9 km. The number of average shots can be selected by the operator. For routine experiments, the data are averaged over 10000 shots, which corresponds to a temporal resolution of 200 s. The corresponding files are stored on the PC hard disk and sent electronically the day after the experiment to the main laboratory for further data processing.
With this configuration, the stratospheric ozone measurement can range from 10 to 50 km. As compared to the initial lidar system, the present system allows a better temporal resolution, a better accuracy in the presence of volcanic aerosols, as well as a better reliability of the measurements in the high stratosphere in relation with the quasi-coaxial character of the system. Its characteristics are summarized in Table 1.
| Transmitter: | ||
|---|---|---|
| XeCl excimer laser | Nd:Yag laser | |
| Emitted wavelength | 308 nm | 355 nm |
| Emitted energy | 200 mJ per pulse | 40 mJ per pulse |
| Repetition rate | 50 Hz | 50 Hz |
| Beam expander magnification | 3 | 2.5 |
| Final divergence | 0.15 mrad | 0.20 mrad |
| Light collecting system: | |
|---|---|
| Telescope | Spectrometer |
| 4 mirrors of 0.530 m diameter | Detected wavelengths: 308, 331, 355 and 387 nm |
| Focal length: 1.5 m | 3600 grooves per mm holographic grating |
| Aperture : F/3 | Spectral resolution: 1 nm |
| Whole system field of view : 0.67 mrad | |
3.3 Alignment procedure
A specific alignment procedure was designed for the multi-fibre lidar instrument. In contrast to other lidar systems, the vertical reference is given by the 308 nm emission axis. The alignment procedure consists in optimising the 308 nm signal for each elementary telescope by adjusting the position of the fibre on the focal plane of the mirror, the other telescopes being closed up. This operation results in making parallel the axes of the 4 telescopes so that the whole system is equivalent to a collecting surface of 1.06 m diameter. The emission axis of the 355 nm wavelength is then aligned on this axis by optimising the signal originated from the 4 telescope system.3.4 DIAL ozone processing
In the routine mode, the lidar signals are time-averaged over the whole measurement period (3–4 h in general) in order to increase the signal-to-noise ratio. Several corrections are then applied to the averaged signal, such as the background correction in which the background light is estimated using a linear regression in the altitude range where the lidar signal is negligible (80–150 km), and the dead-time correction effect in order to account for the saturation of the photon counting signals in the lower ranges. The ozone number density is retrieved from the derivation of the logarithm of the corrected lidar signals. As mentioned in Section 2, it is necessary in the DIAL technique to use a low-pass filter in order to account for the rapid decrease of the signal-to-noise ratio in the high altitude range. In our case, the logarithm of each signal is fitted to a 2nd order polynomial and the ozone number density is computed from the difference of the derivative of the fitted polynomials. The smoothing is achieved by varying the number of points over which the signals are fitted. The resolution is calculated from the cut-off frequency of the low-pass filter defined at −3 dB. The relation between the filter cut-off frequency and the number of points used was obtained empirically by calculating the filter transfer function for various filter orders.The ozone number density is derived from the three lidar signal pairs detected by the experimental system: Rayleigh high-energy, Rayleigh low-energy and Raman, which optimise the accuracy of the retrieved ozone profile in the high stratosphere, the middle-low stratosphere and the lower stratosphere respectively. In condition of background stratospheric aerosol, it is preferable to use the low-energy Rayleigh signals in the lower stratosphere, since they provide a more vertically resolved ozone profile then the Raman signals, as emphasized in Section 2.3.1. The use of these signals in the lowermost stratosphere is prevented by the saturation of the photon counters, as is the use of the high-energy Rayleigh signals higher up. A method based on the adjustment of the parameter used for the pulse pile-up correction was then designed, in order to optimise the range where the most energetic lidar signal pair can be used, improving thus the precision of the final ozone profile. The equation used to compute the true photon count rate from the observed count rate is the following, derived from the Poisson statistics:37
 | (9) |
In the case of the high-energy Rayleigh signals, the parameter x used for the pulse pile-up correction is adjusted for each wavelength in order to obtain the best agreement between the slopes of both low-energy and high-energy Rayleigh signals. For the low-energy Rayleigh signals, we use the Raman signals by computing ‘reference Rayleigh’ slopes from the Raman signal slopes, the derived Raman ozone profile and the Rayleigh extinction correction. This technique allows the best agreement between the ozone profiles derived from the various wavelength pairs to be obtained. The final ozone profile is retrieved first by combining for each wavelength the slopes of the low-energy and high-energy Rayleigh signals and then by combining the Raman and the composite Rayleigh ozone profiles. The altitude range where both profiles are combined depends on the stratospheric aerosol content. The monitoring of the aerosol content in the stratosphere is made by computing the backscatter ratio (defined as the ratio of the total backscatter coefficient to the Rayleigh backscatter coefficient) at 355 nm, using the Klett method, as described in Section 2.3.1. This allows us to check the presence of aerosol layers due to small volcanic eruptions reaching the lower stratosphere or the presence of subvisible cirrus. In background aerosol conditions, the combination of the Rayleigh and Raman ozone profile is made around 14–15 km. Finally, both the Raman and composite Rayleigh profiles are corrected from the Rayleigh extinction using composite pressure–temperature profiles computed from nearby radio soundings performed daily in the nearby town of Nîmes and the CIRA model. No background aerosol correction is made presently which can result in a small positive bias of the order of 1% in the lower stratosphere, as shown in Section 2.3.2.
4. DIAL stratospheric ozone database at OHP
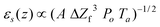
Ozone measurements at OHP are performed during the night and typically last several hours, which results in a spatial resolution of the order of 100 km, depending on the atmospheric conditions. The vertical resolution ranges from several hundred meters in the lower range to several kilometres above 40 km. An example of an ozone profile obtained by the OHP lidar system is displayed in Fig. 6 and the corresponding precision and vertical resolution are presented in Fig. 7. Fig. 6 presents also a tropospheric DIAL ozone measurement obtained at OHP on the same day with a different DIAL system.38 This profile shows a good agreement with the stratospheric DIAL ozone measurement in the lowermost stratosphere, which indicates that both types of measurement can be used to derive an ozone profile in the whole troposphere and stratosphere. The total accuracy of DIAL ozone measurements at OHP corresponds to the RMS of the precision computed from the lidar signals and the total residual error displayed in Fig. 3. It ranges from about 5% below 20 km to more than 20% above 45 km. The lidar measurements are optimum in the 20–30 km altitude range with the use of the high energy Rayleigh signals. In that range, the total accuracy is estimated to about 3% and the vertical resolution varies from 0.5 to 2 km. | ||
| Fig. 6 Example of Rayleigh and Raman ozone lidar profiles obtained at OHP. These measurements are complemented by a tropospheric lidar profile obtained on the same day with a different lidar instrument. | ||
 | ||
| Fig. 7 Typical precision and vertical resolution profile of ozone lidar measurement at OHP. The precision depends on the meteorological conditions. | ||
One main caveat of lidar measurements is the requirement of clear sky meteorological conditions since laser radiation is rapidly absorbed by clouds and only cirrus can be tolerated for accurate stratospheric ozone measurements. However, meteorological conditions at OHP are particularly favourable to lidar measurements and a yearly average of 130 measurements is presently obtained as compared to about 50 ozone soundings. In some winter or summer months, more than 15 measurements are obtained, allowing a fairly detailed study of ozone variability at OHP. Since the beginning of systematic measurements in late 1986, the annual sampling rate increased from about 50 measurements per year to 155 in 2001 with a peak of 194 in 1997. At the end of 2001, the stratospheric DIAL ozone database at OHP amounted to 1463 profiles.
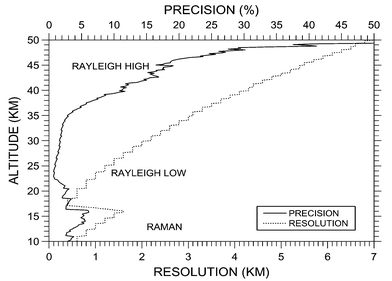
DIAL stratospheric ozone measurements at OHP have been compared to ECC ozone soundings performed at the same location and to SAGE II satellite measurements obtained in the vicinity of the station.39 As an example, Fig. 8 shows the comparison of ozone measurements obtained by the 3 instruments within less than 12 h difference. The SAGE II measurements were selected within ±2.5° latitude and ±10° longitude ranges around the station. The figure shows that when the measurements are sufficiently close in time, the lidar captures similar structures in the ozone profile as the more vertically resolved ECC sondes, with quite good agreement between both measurements. The agreement with the SAGE II measurements is also satisfactory in the middle and high stratosphere. Measurements obtained on March 16, 1999 are particularly interesting since both the ECC sonde and the lidar sampled polar air masses extending to the OHP location. The ozone number density measured around 20 km is very large as compared to values obtained in previous winters during the same period. The 1998/1999 Arctic winter was indeed very warm as compared to previous years, with nearly no chemical ozone loss within the vortex. The SAGE II measurement located around 10° west from OHP did not catch the tongue of polar air and showed much lower ozone amounts.
 | ||
| Fig. 8 Example of quasi coincident measurements obtained by ECC sondes and the DIAL lidar at OHP and by the SAGE II satellite instrument. | ||
The performance of the lidar instrument is further checked by comparing the mean of coincident lidar and ECC sonde measurements obtained within ±6 h difference. Due to large ozone variability in the lower stratosphere, such comparison requires the smallest time difference between the measurements. 16 such quasi coincident measurements were found over the 1994–2000 time frame. The corresponding average profiles are displayed in Fig. 9. The average profiles are computed as a function of potential temperature in order to reduce the effect of vertical displacement between the measurements. Fig. 9 shows that excellent agreement is observed between both types of measurements, from 350 K (11 km) to 800 K (28 km). The lidar average profile shows a small positive bias as compared to the ECC sonde profile between 450 K (16 km) and 500 K (20 km), but this bias is not significant at 2σ standard error level. Above 800 K, the ECC sondes are less efficient and both profiles start to diverge. As suggested from the WMO ozone trend assessment,2 the ECC measurements were not scaled to total ozone measurements. An average correction factor (ratio of total ozone computed from the ozone sounding complemented by SAGE II climatology to local Dobson total ozone measurement) of 1.01 ± 0.028 was found for the 16 profiles.
 | ||
| Fig. 9 Comparison of averaged ozone profiles obtained from 16 quasi coincident ECC sondes and DIAL lidar ozone measurements. The error bars correspond to the 2σ standard error. | ||
5. Conclusion
The DIAL method is a powerful technique for the measurement of the ozone vertical distribution in the atmosphere. It is particularly suited for trend studies since it is self-calibrated. The DIAL measurements are characterised by a good precision and good vertical resolution especially in the middle and low stratosphere down to 12 km. Typical values are vertical resolutions ranging from 0.5 km at 15 km to 5 km at 45 km and total accuracy ranging from about 5% below 20 km to 15–30% above 45 km, depending on the emitted power of the excimer laser and the weather conditions that affect the measurement signal-to-noise ratio. The residual error on the DIAL ozone measurement increases rapidly below 12 km, which indicates that these measurements are less suitable for ozone trend evaluation in the lowermost stratosphere. In the ozone retrieval, some error sources such as the temperature dependence of ozone absorption cross-sections or interference with stratospheric aerosol and other minor compounds can have an effect on ozone trend evaluation. The most important effect is linked to volcanic aerosols since even when Raman channels are used, the bias on Raman ozone retrieval reaches about 5% and decreases at a rate of 1 to 4% per year in the 15–20 km altitude range after large volcanic eruptions, as emphasized in Section 2.3.1. The temperature dependence of ozone absorption cross-sections has also to be considered, since a trend error of 0.1 K per year in the temperature data used in the ozone retrieval can induce a trend of about 0.02% per year in ozone, taking into account the sensitivity of ozone absorption cross-sections to temperature in the 300–340 nm range. In the case of the OHP ozone lidar time series, such potential error should be taken into account in the upper range due to the use of the CIRA model but not in the lower stratosphere where radiosonde data are used. Besides, the whole time series can be recomputed with more accurate ozone absorption cross-sections computed from meteorological analyses provided by the European Centre for Medium-Range Weather Forecast (ECMWF) or the National Center for Environmental Prediction (NCEP). Trends in background aerosol or nitrogen dioxide, if they exist, will have a negligible impact on retrieved ozone trends, due to the very limited effect of these parameters on ozone retrieval. No trend in background aerosols has been reported at the present time.8 For NO2, an increasing trend of 5% per decade has recently been reported40 in the southern hemisphere. Such a trend would result in a maximum trend error of 2 ×10⁻⁴% per decade on the lidar ozone retrieval.Other errors that can affect ozone trend determination are due to instrumental artefacts, such as signal induced noise, detector saturation or alignment problems. These errors are difficult to quantify since they depend completely on the instrumental configuration and on the operating procedure. This is why the lidar set-ups designed for long-term operation and operating in the frame of the NDSC are required to fulfil several requirements in order to maintain the linearity of the lidar signals in the whole altitude range of the measurement. Among these requirements, one can cite in particular: (i) the use of a mechanical chopper and high quality photomultiplier tubes for unbiased measurements in the higher altitude range; and (ii) the use of several optical or electronic channels for the analysis of the lidar returns in order to account for the high dynamics of the lidar signals and obtain unbiased measurements in the lower altitude range.
Another NDSC requirement is the participation in intercomparison campaigns involving the DIAL ozone mobile instrument set up for this type of exercise.19 The OHP DIAL ozone instrument participated in such intercomparison campaigns in 1992 and 1997.41
The stratospheric ozone DIAL database at OHP amounts now to more than 1400 ozone profiles. A first evaluation of stratospheric ozone long-term changes at OHP in the 1985–1995 period was made in 1997, using the lidar ozone data together with Umkehr and ozone sonde measurements performed at OHP and ozone profiles retrieved from SAGE II satellite instrument overpass measurements. Similar ozone trends were obtained from the various data series above 20 km.42 Below this altitude the DIAL ozone time series was not long enough to evaluate trends. Since that study, about 900 ozone profiles have been obtained in the lower stratosphere. These profiles were used recently to study the influence of Arctic ozone depletion on ozone amounts at OHP.43 In the near future, the estimation of long-term ozone trends will be updated, with an evaluation of the influence of dynamical processes on low stratospheric ozone amounts since various recent studies have pointed out the importance of these processes on long term ozone trends in the mid-latitude regions.44
Acknowledgements
The authors wish to thank the whole lidar team at Observatoire de Haute-Provence and especially P. Gildwarg, F. Gomez, G. Kaczmarek and C. Mollet for the operation of the stratospheric ozone lidar. They thank P. Weill, J. L. Conrad, C. Laqui, F. Fassina, C. Leroy, A. Théodon and C. Blaise for the technical support. They are grateful to T. Deshler for the provision of the Laramie optical counter aerosol size distribution time series. The NDSC lidar activities at OHP are supported by a multi-year contract involving the Centre National de la Recherche Scientifique (CNRS), the French Ministry of Environment and the Centre National d’Etudes Spatiales (CNES).References
- S. Solomon, Rev. Geophys., 1999, 37, 275–316 CrossRef CAS.
- WMO, Global Ozone Research and Monitoring Project, Assessment of Trends in the Vertical Distribution of Ozone, Report No. 43, 1998 Search PubMed.
- N. R. P. Harris, M. Rex, F. Goutail, B. M. Knudsen, G. L. Manney, R. Müller and P. von der Gathen, J. Geophys. Res., 2002, 107 Search PubMed , (DOI: 10.1029/2001JD000482).
- WMO, Report of the International Ozone Trends Panel, Report No. 18, 1988 Search PubMed.
- C. Souprayen, A. Garnier, A. Hertzog, A. Hauchecorne and J. Porteneuve, Appl. Opt, 1999, 38, 2410–2421 Search PubMed.
- R. Zander, E. Mahieu, Ph. Demoulin, C. P. Rinsland, D. K. Weisenstein, M. K. W. Ko, N. D. Sze and M. R. Gunson, J. Atmos. Chem., 1994, 18, 129–148 CrossRef CAS.
- J. De la Noë, O. Lezeaux, G. Guillemin, R. Lauque, P. Baron and P. Ricaud, J. Geophys. Res., 1998, 103, 22147–22161 CrossRef CAS.
- WMO, Scientific Assessment of Ozone Depletion 1998, Report No. 44, Global Ozone Research and Monitoring Project, Geneva, 1999 Search PubMed.
- R. M. Measures, Laser Remote Sensing, John Wiley, New York, 1984 Search PubMed.
- R. M. Shotland, J. Appl. Meteorol., 1974, 13, 71 Search PubMed.
- G. Mégie, G. Ancellet and J. Pelon, Appl. Opt., 1985, 24, 3454–3453 Search PubMed.
- E. V. Browell, Proc. IEEE, 1989, 77, 419–432 CrossRef CAS.
- A. Papayannis, G. Ancellet, J. Pelon and G. Mégie, Appl. Opt., 1990, 29, 467–476 Search PubMed.
- O. Uchino, M. Maeda, J. Kohno, T. Shibata, C. Nagasawa and M. Hirono, Appl. Phys. Lett., 1978, 33, 807–809 CrossRef CAS.
- J. Werner, K. W. Rothe and H. Walther, Appl. Phys. B., 1983, 32, 113–118.
- I. S. McDermid, S. Godin and L. O. Lindquist, Appl. Opt., 1990, 29(25), 3603–3612 Search PubMed.
- S. Godin, G. Mégie and J. Pelon, Geophys. Res. Lett., 1989, 16(16), 547–550 CAS.
- O. Uchino and I. Tabata, Appl. Opt., 1991, 30(15), 2005 Search PubMed.
- T. McGee, D. Whiteman, R. Ferrare, J. J. Butler and J. F. Burris, Opt. Eng., 1991, 30, 31–39 CAS.
- H. Nakane, N. Sugimoto, S. Hayashida, Y. Sasano and I. Matsui, Five years lidar observation of vertical profiles of stratospheric ozone at NIES, Tsukuba (36N, 140E), Proc. 17th ILRC, Sendai, Japan, 1994 Search PubMed.
- G. Mégie and R. T. Menzies, Appl. Opt., 1980, 19, 1173 Search PubMed.
- J. Pelon, S. Godin and G. Mégie, J. Geophys. Res., 1986, 91, 8667–8671 CAS.
- A. M. Bass and R. J. Paur, The ultraviolet cross sections of ozone, I. The measurements, Proc. Quadriennial Ozone Symposium, Halkidiki, Greece, ed. C. S. Zerefos and A. Ghazi, D. Reidel, Hingham, Mass., 1985, p. 606 Search PubMed.
- S. A. McKeen, S. C. Liu and C. S. Kiang, J. Geophys. Res., 1984, 4873 CAS.
- D. F. Heath, M. Schlesinger and H. Park, Eos Trans. AGU, 1983, 64, 197.
- G. P. Brasseur, J. J. Orlando and G. S. Tyndall, Atmospheric Chemistry and Global Change, Oxford University Press, Oxford, UK, 1999, pp. 654 Search PubMed.
- W. Steinbrecht and A. I. Carswell, J. Geophys. Res., 1995, 1215–1233 CrossRef CAS.
- J. D. Klett, Appl. Opt., 1985, 24(11), 1638–1642 Search PubMed.
- S. Godin, G. Mégie, C. David, V. Mitev, D. Haner, Y. Emery, C. Flesia, V. Rizi, G. Visconti and L. Stefanutti, Ozone, aerosols and polar stratospheric clouds measurements during the EASOE Campaign, Proc. Quadriennial Ozone Symposium 561, NASA Conf. Pub. 3266, Charlottesville, 1994, pp. 550–553 Search PubMed.
- T. J. McGee, M. Gross, R. Ferrare, W. S. Heaps and U. N. Singh, Geophys. Res. Lett., 1993, 20, 955–958 CAS.
- T. J. McGee, P. Newman, M. Gross, U. Singh, S. Godin, A. M. Lacoste and G. Mégie, Geophys. Res. Lett., 1994, 21(25), 2801–2804 CrossRef.
- T. Deshler, B. J. Johnson and W. R. Rozier, Geophys. Res. Lett., 1993, 20(14), 1435–1438.
- C. F. Bohren and D. R. Hufman, Absorption and Scattering of Light by Small Particles, Wiley Interscience, New York, 1983 Search PubMed.
- P. Chazette, C. David, J. Lefrere, S. Godin, J. Pelon and G. Mégie, J. Geophys. Res., 1995, 100, 23195–23207 CrossRef.
- Vaisala DigiCora MW 11 User's Guide Manual, 1988.
- S. Godin, A. Carswell, D. Donovan, H. Claude, W. Steinbrecht, S. McDermid, T. McGee, M. R. Gross, H. Nakane, D. P. J. Swart, J. B. Bergwerff, O. Uchino, P. Von Der Gathen and R. Neuber, Appl. Opt., 1999, 38(30), 6225–6236 Search PubMed.
- J. Pelon and G. Mégie, J. Geophys. Res., 1982, 87, 4947 CAS.
- G. Ancellet, A. Papagiannis, J. Pelon and G. Mégie, J. Atmos. Ocean. Tech., 1989, 6, 832–839 Search PubMed.
- M. P. McCormick, J. M. Zawodny, R. E. Veiga, J. C. Larsen and P. H. Wang, Planet. Space Sci., 1989, 37(12), 1567–1586 CrossRef.
- D. J. Fish, H. K. Roscoe and P. V. Johnston, Geophys. Res. Lett., 2000, 27, 3313–3316 CrossRef CAS.
- G. Braathen, S. Godin, P. Keckhut, T. McGee, M. R. Gross, C. Vialle and A. Hauchecorne, Intercomparison of stratospheric ozone and temperature measurements at the Observatoire de Haute Provence during the NDSC validation campaign from 1–18 July 1997, to be submitted.
- M. Guirlet, P. Keckhut, S. Godin and G. Mégie, Ann. Geophys., 2000, 18, 1325–1339 Search PubMed.
- S. Godin, M. Marchand and A. Hauchecorne, J. Geophys. Res., 2002, 107 Search PubMed , (DOI: 10.1029/2001JD000516).
- A. C. Fusco and M. L. Salby, J. Clim., 1999, 12, 1619–1629 Search PubMed.
| This journal is © The Royal Society of Chemistry 2003 |