Determination of mutagenic 3-nitrobenzanthrone in diesel exhaust particulate matter by three-dimensional high-performance liquid chromatography
Tsuyoshi
Murahashi
*
Kyoto Pharmaceutical University, 5 Nakauchi-cho, Misasagi, Yamashina-ku, 607-8414, Kyoto, Japan. E-mail: tmu@mb.kyoto-phu.ac.jp; Fax: +81-75-595-4569; Tel: +81-75-595-4650
First published on 28th November 2002
Abstract
Mutagenic 3-nitrobenzanthrone was determined in diesel exhaust particulate matter by three-dimensional high-performance liquid chromatography. Nitrophenylethyl, C18 and pyrenylethyl stationary phases were used as the first, second and third dimensions, respectively. Methanol was used as a mobile phase for the first and second dimensions, and dichloromethane was used for the third. Each column was coupled by a 6-port valve with a concentrator column. Effluent from the third dimensional column was detected by a photodiode array detector. The calibration graph showed good linearity in the range of 1–1000 ng ml−1, and the detection limit (S/N = 3) was 1 ng ml−1. 3-Nitrobenzanthrone could be detected within 45 min without the requirement of a clean-up procedure. 3-Nitrobenzanthrone in diesel exhaust particulate matter was detected in the range of 27–56 pg mg−1 extract (n = 3).
Introduction
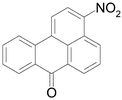
3-Nitrobenzanthrone (3-nitro-7H-benz[de]anthracen-7-one, 3-NBA, Fig. 1) is one of the strongest mutagens that exist in airborne particulate matter.1 It might be produced by both the incomplete combustion of organic compounds and atmospheric formation, because 3-NBA was detected in diesel exhaust particulate matter,1 and 3-NBA was easily produced under an artificial atmosphere containing benzanthrone, gaseous NO2 and O3.1,2 3-NBA induced micronuclei in mouse peripheral blood reticulocytes1 and in the human B-lymphoblastoid cell line.3 3-NBA bound covalently to DNA after metabolic activation, forming multiple DNA adducts in vitro and in vivo, all of which were products derived from reductive metabolites.4,5 Therefore, the determination of 3-NBA in exhaust and the environment has become an important task in order to be able to take countermeasures against contamination by mutagenic 3-NBA. However, the environmental behaviour of 3-NBA has not been clear because the 3-NBA concentration in the environment is too low to be determined. | ||
| Fig. 1 Structure of 3-nitrobenzanthrone. | ||
Nitroarenes are usually analysed by an HPLC with fluorescence detection or chemiluminescence detection after reduction to the corresponding fluorescence aminoarenes.6,7 In this study, a photometric detector was used for the 3-NBA determination, because the reduced product of 3-NBA, 3-aminobenzanthrone, had no fluorescence in methanol–water or acetonitrile–water mobile phase. In order to determine trace levels of 3-NBA in complex matrix such as diesel exhaust particulate matter, a large amount of extract (53–367 mg) from particulate matter was applied to a three-dimensional (3-D) HPLC using the nitrophenylethyl (NPE), C18 and pyrenylethyl (PYE) stationary phases.
Experimental
Materials
3-NBA was kindly provided by Dr Yoshiharu Hisamatsu of the National Institute of Public Health (Tokyo, Japan). n-Dodecane and n-nonylbenzene were purchased from Wako Pure Chemical Industries (Osaka, Japan). Benzo[a]pyrene standard solution was obtained from Supelco (Bellefonte, PA, USA). 6-Nitrobenzo[a]pyrene standard solution was purchased from the National Institute of Standards and Technology (Gaithersburg, MD, USA). HPLC grade dichloromethane and methanol were obtained from Wako Pure Chemical Industries. Water was produced using a Milli-Q system from Millipore (Bedford, MA, USA).Equipment
All chromatographic separations were performed on a Shimadzu (Kyoto, Japan) Class VP HPLC system, incorporating an LC-10ADVP pump (flow rate, 1 ml min−1), an SIL-10ADVP auto sampler, an SPD-10AVP UV detector (λ = 254 nm), an RID-10A refractive index detector and a CTO-10ACVP column oven (temperature, 30 °C). Stationary phases were Develosil C8-UG-5 and C30-UG-5 (Nomura Chemical, Seto, Japan), Cosmosil 5C18MS, 5CNMS, 5Ph, 5NPE, 5PBB and 5PYE (Nacalai Tesque, Kyoto, Japan), Inertsil ODS-P (GL Sciences, Tokyo, Japan), Symmetry Shield RP8 (Waters, Milford, MA, USA), Discovery RP-Amide C16 (Supelco, Bellefonte, PA, USA) and Supelcosil LC-F (Supelco). The column sizes were all 250 × 4.6 mm id, and the particle sizes were 5 μm. The mobile phases were methanol–water (6:4, v/v) for Cosmosil 5CNMS and Supelcosil LC–F, methanol for Cosmosil 5PBB and 5PYE and methanol–water (8:2, v/v) for the other columns. n-C12 was detected by the RID-10A refractive index detector and the other probe solutes were detected using the SPD-10A UV detector.Sampling and pretreatment of diesel exhaust particulate matter
Diesel engine vehicles, including heavy and light-duty vehicles, were driven at 80 km h−1. Diesel exhaust was diluted in a tunnel with charcoal filtered air and the particulate matter was collected on a Pallflex Products (Putnam, CT, USA) Tx filter by an ultra high-volume air sampler. The soluble organic fraction (SOF) was extracted with dichloromethane using a Soxhlet extractor for 24 h. Then, the extract was concentrated using a KD concentrator. Residue was dissolved in methanol.Three-dimensional HPLC system for the determination of 3-nitrobenzanthrone
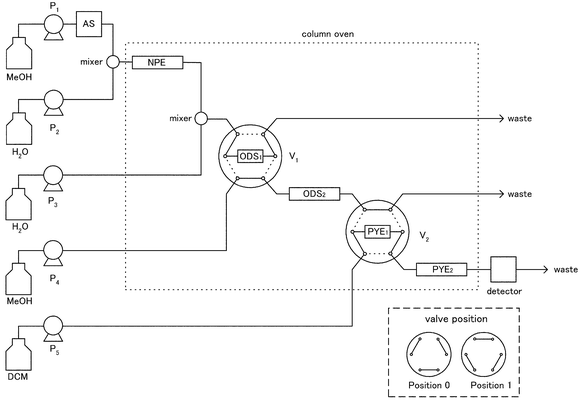
A schematic diagram of the 3-D HPLC system is shown in Fig. 2. The HPLC system consisted of five pumps (P1–P5), an auto sampler (AS), two GL Sciences SM2-05A mixers, two Shimadzu FCV-12AH 6-port-2-position switching valves (V1, V2; initial position, 1), a Shimadzu SPD-M10AVP photodiode array detector (λ = 400 nm) and a column oven (30 °C). P1 and P2 delivered methanol and water, respectively, P3 delivered water at 3 ml min−1 from 8.8 to 9.1 min, P4 and P5 delivered methanol and dichloromethane, respectively, at a flow rate of 1 ml min−1. The columns were a Cosmosil 5NPE (250 × 4.6 mm id) for NPE, a Cosmosil 5C18MS (250 × 4.6 mm id) for ODS2, two Cosmosil 5PYEs (250 × 4.6 mm id) in series for PYE2, a Cosmosil 5C18MS (10 × 4 mm id) for ODS1 and a Cosmosil 5PYE (10 × 4 mm id) for PYE1. The HPLC system was operated under the timing program listed in Table 1. | ||
| Fig. 2 Schematic diagram of the 3-D HPLC system. Abbreviations and conditions are decribed in the Experimental section. | ||
| Step | Time/min | Unit | Value | Purpose |
|---|---|---|---|---|
| 1 | 0.0 | AS | Inject | Sample injection |
| 2 | 0.0 | P1 | 0.5 ml min−1 | Concentration onto NPE |
| 0.0 | P2 | 0.5 ml min−1 | ||
| 3 | 3.0 | P1 | 1 ml min−1 | Separation on NPE |
| 3.0 | P2 | 0 ml min−1 | ||
| 4 | 8.8 | V1 | Position 0 | Concentration onto ODS1 |
| 8.8 | P3 | 3 ml min−1 | ||
| 5 | 9.1 | V1 | Position 1 | Separation on ODS2 |
| 9.1 | P3 | 0 ml min−1 | ||
| 6 | 13.4 | V2 | Position 0 | Concentration onto PYE1 |
| 7 | 13.4 | V2 | Position 1 | Separation on PYE2 |
Results and discussion
Retention behaviour on HPLC columns
In order to clear the retention behaviours on the reversed phase HPLC columns, the retention factors (k) of n-dodecane (C12), n-nonylbenzene (NB), benzo[a]pyrene (BaP), 6-nitrobenzo[a]pyrene (NBaP) and 3-NBA were measured. Table 2 lists the retention factors (k) of the above solutes.The elution order on the monomeric C18 column (Cosmosil 5C18MS) was 3-NBA, NBaP, BaP, NB and C12. The C8 column (Develosil C8-UG) and the C30 column (Develosil C30-UG) also showed the same elution order. In the case of the polymeric C18 column (Inertsil ODS-P) that has shape selectivity, planer BaP was eluted after non-planer NB. The ratios, kC12/k3-NBA, are also listed in Table 2. The ratios on the above alkyl stationary phases were more than 12.
| Stationary phase | Mobile phase MeOH–H2O | k | k C12/k3-NBA | ||||
|---|---|---|---|---|---|---|---|
| C12 | NB | BaP | NBaP | 3-NBA | |||
| Develosil C8-UG | 8∶2 | 20.26 | 13.45 | 4.70 | 4.25 | 1.57 | 12.9 |
| Cosmosil 5C18MS | 8∶2 | 67.91 | 38.59 | 19.12 | 12.47 | 3.16 | 21.5 |
| Inertsil ODS-P | 8∶2 | 101.98 | 56.36 | 89.81 | 46.62 | 8.32 | 12.3 |
| Develosil C30-UG | 8∶2 | 67.03 | 38.39 | 29.89 | 19.81 | 5.22 | 12.9 |
| Symmetry Shield RP8 | 8∶2 | 13.94 | 10.09 | 9.87 | 8.96 | 3.39 | 4.1 |
| Discovery RP Amide C16 | 8∶2 | 14.68 | 9.85 | 9.18 | 7.59 | 2.29 | 6.4 |
| Cosmosil 5CNMS | 6∶4 | 2.23 | 2.18 | 1.91 | 1.92 | 1.15 | 1.9 |
| Cosmosil 5Ph | 8∶2 | 2.29 | 2.33 | 1.94 | 1.97 | 1.26 | 1.8 |
| Supelcosil LC-F | 6∶4 | 10.71 | 9.04 | 9.99 | 9.87 | 4.40 | 2.4 |
| Cosmosil 5NPE | 8∶2 | 1.91 | 2.24 | 5.32 | 10.18 | 4.99 | 0.38 |
| Cosmosil 5PBB | 1∶0 | 0.64 | 1.04 | 14.73 | 18.10 | 11.90 | 0.054 |
| Cosmosil 5PYE | 1∶0 | 0.46 | 0.68 | 3.63 | 16.76 | 75.49 | 0.006 |
The Symmetry Shield RP8 and the Discovery RP Amide C16 are the columns introduced in the amide linkage between the silica gel and alkyl group. In these stationary phases, not only the alkyl group but also the amide bond interacts with the solutes. Although the elution order was the same as that of the monomeric C18 column, the kC12/k3-NBA ratios (4.11, 6.41) were much lower than those on the alkyl stationary phases (12.26–21.49).
The cyanopropyl (Cosmosil 5CNMS), phenyl (Cosmosil 5Ph) and fluorophenyl (Supelcosil LC-F) stationary phases have π electrons, and these electrons interact with π electrons of solutes. On these columns, the retention factors of C12, NB, BaP and NBaP were all similar to each other. The ratios of kC12/k3-NBA were in the range of 1.9–2.4, and these values were much lower than those of the alkyl and alkyl amide stationary phases.
NPE stationary phase (nitrophenylethylsilylated silica gel) is prepared from phenylethylsilylated silica gel by direct nitration.8 NPE stationary phase has effects such as hydrophobic interaction, π–π interaction, charge–transfer interaction and dipolar–dipolar interaction.8,9 The elution order of the NPE stationary phase was C12, NB, 3-NBA, BaP and NBaP. This elution order was quite different from those of the alkyl stationary phases. The ratio of kC12/k3-NBA on the NPE was 0.38.
Pentabromobenzyl stationary phase has been developed by Kimata et al. for the separation of fullerenes.10 This stationary phase is prepared by immobilizing 3-[(pentabromobenzyl)oxy]propylsilyl group onto silica surface.10 The elution order of the pentabromobenzyl stationary phase was C12, NB, 3-NBA, BaP and NBaP. This elution order was the same as that of the NPE stationary phases. The ratio of kC12/k3-NBA on this stationary phase was 0.054.
PYE stationary phase, 2-(1-pyrenyl)ethylsilyl bonded silica gel, has been used for the separation of polychlorinated dibenzo-p-dioxines, polychlorinated biphenyls and polycyclic aromatic hydrocarbons.11–14 This PYE stationary phase has effects such as hydrophobic interaction, π–π interaction, charge–transfer interaction and steric recognition.11 The elution order of the PYE stationary phase was C12, NB, BaP, NBaP and 3-NBA. This elution order was the reverse of the monomeric C18 stationary phase. The ratio of kC12/k3-NBA on the PYE column was 0.006. This value was much lower than that found on the alkyl stationary phases.
Considering the above results, C18, NPE and PYE columns were used for the separation of 3-NBA, because the kC12/k3-NBA ratios were at a maximum on the C18 column, at an intermediate level on the NPE column and at a minimum on the PYE column.
Clean-up effect on C18, NPE and PYE columns
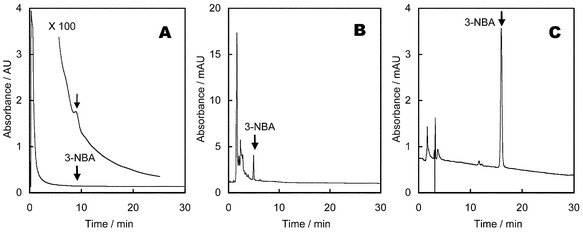
To confirm the clean-up effect on the C18, NPE and PYE columns, the extract from diesel (heavy duty) exhaust particulate matter (0.2 g), spiked with 3-NBA (1 μg), was applied to the PYE, C18 and NPE columns, successively. Methanol at a flow rate of 1 ml min−1 was used as a mobile phase.First, the above sample was applied to the Cosmosil 5PYE column (10 × 4 mm id). As shown in Fig. 3A, a peak of 3-NBA appeared at a retention time of 9.1 min on a large tailing peak. Most of the components were eluted within 2 min. Effluent from the time interval 7.8–10.4 min was collected, and this fraction was applied to the C18 column (Inertsil ODS-P, 250 × 4.6 mm id). A peak of 3-NBA was observed at 4.9 min (Fig. 3B). Some larger peaks than the peak of the 3-NBA was observed in this chromatogram. Effluent during the time interval 4.7–5.2 min was collected and this fraction was analysed on the NPE column (Cosmosil 5NPE, 250 × 4.6 mm id). A peak of 3-NBA was observed at 16.0 min without interfering peaks, and this peak was the largest (Fig. 3C). This result suggested that the combination of PYE, C18 and NPE columns was effective in the separation of 3-NBA in diesel exhaust particulate matter.
 | ||
| Fig. 3 Clean-up effect on PYE, C18 and NPE stationary phases. Sample was applied to a PYE column (A), then to a C18 column (B) and finally to a NPE column (C). | ||
Three-dimensional HPLC
A schematic diagram of the 3-D HPLC system for the determination of 3-NBA in diesel exhaust particulate matter is shown in Fig. 2, and the timing program is listed in Table 1. A sample solution (0.3 ml) was injected by an AS auto sampler (step 1), and the 3-NBA in the sample solution was concentrated onto an NPE column by working a P2 pump to increase the water concentration of the mobile phase (step 2). Then, the first separation was achieved on an NPE column (step 3). 3-NBA in the effluent from an NPE column was concentrated onto an ODS1 column by working a P3 pump and rotating the V1 valve from position 1 to 0 (step 4). After concentrating the 3-NBA, the second separation was started by rotating the V1 valve from position 0 to 1 and stopping the P3 pump (step 5). The 3-NBA in the effluent from the ODS2 column was concentrated onto a PYE1 column without increasing the water concentration of the mobile phase, because the 3-NBA was not eluted by methanol mobile phase from a PYE1 column for 10 min (step 6). By rotating the V2 valve, the mobile phase was changed to dichloromethane, and the third separation was started (step 7). Then, the 3-NBA was detected by a photodiode array detector.Calibration graph and limit of detection
Under the above conditions, the calibration graph showed good linearity (r2 > 0.9999) in the range of 1–1000 ng ml−1. The detection limit, calculated by the signal-to-noise ratio (S/N = 3), was 1 ng ml−1. The reproducibility of this method was examined for 10 ng ml−1. The relative standard deviation (n = 10) was lower than 5%.Analysis of diesel exhaust particulate matter
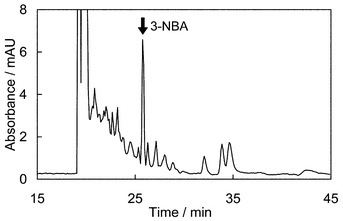
Dichloromethane extract from diesel exhaust particulate matter was applied to the proposed 3-D HPLC system. Fig. 4 shows a typical chromatogram of extracts from diesel exhaust particulate matter. A peak of 3-NBA was observed at an analysis time of 25.8 min, without any interfering peaks. The concentration of 3-NBA in diesel exhaust particulate matter collected from three vehicles, including both heavy and light-duty vehicles, was in the range of 27–56 pg mg−1 SOF. It becomes clear that this proposed method is useful for determining 3-NBA levels in diesel exhaust particulate matter. | ||
| Fig. 4 Typical chromatogram of extract from diesel exhaust. | ||
Acknowledgement
The author thanks Mr Sousuke Sasaki, Ms Fumiko Tsuruga and Dr Tadashi Mori of the Japan Automobile Research Institute for sampling of diesel exhaust particulate matter, Ms Sachiko Kawai and Ms Yukiko Saito for extraction of diesel exhaust particulate matter and Dr Tohru Nakajima and Dr Kenichi Akiyama for useful advice.References
- T. Enya, H. Suzuki, T. Watanabe, T. Hirayama and Y. Hisamatsu, Environ. Sci. Technol., 1997, 31, 2772 CrossRef CAS.
- T. Enya, H. Suzuki and Y. Hisamatsu, Bull. Chem. Soc. Jpn., 1998, 71, 2221 CAS.
- P. T. Phousongphouang, A. J. Grosovsky, D. A. Eastmond, M. Covarrubias and J. Arey, Mutat. Res., 2000, 472, 93 CrossRef CAS.
- C. A. Bieler, M. Wiessler, L. Erdinger, H. Suzuki, T. Enya and H. H. Schmeiser, Mutat. Res., 1999, 439, 307 CrossRef CAS.
- V. M. Arlt, C. A. Bieler, W. Mier, M. Wiessler and H. H. Schmeiser, Int. J. Cancer, 2001, 93, 450 CrossRef CAS.
- S. B. Tejada, R. B. Zweidinger and J. E. Sigsby, Jr, Anal. Chem., 1986, 58, 1827 CrossRef CAS.
- T. Murahashi and K. Hayakawa, Anal. Chim. Acta, 1997, 343, 251 CrossRef CAS.
- K. Kimata, K. Hosoya, N. Tanaka, T. Araki and D. G. Patterson, Jr, J. Chromatogr., 1992, 595, 77 CrossRef CAS.
- K. Kimata, K. Hosoya, T. Araki, N. Tanaka, E. R. Barnhart, L. R. Alexander, S. Sirimanne, P. C. McClure, J. Grainger and D. G. Patterson, Jr, Anal. Chem., 1993, 65, 2502 CAS.
- K. Kimata, T. Hirose, K. Moriuchi, K. Hosoya, T. Araki and N. Tanaka, Anal. Chem., 1995, 67, 2556 CrossRef CAS.
- N. Tanaka, Y. Tokuda, K. Iwaguchi and M. Araki, J. Chromatogr., 1982, 239, 761 CrossRef CAS.
- E. R. Barnhart, D. G. Patterson, Jr, N. Tanaka and M. Araki, J. Chromatogr., 1988, 445, 145 CrossRef CAS.
- C. Bandh, R. Ishaq, D. Broman, C. Näf, Y. R-Nii and Y. Zebühr, Environ. Sci. Technol., 1996, 30, 214 CrossRef CAS.
- K. Kimata, K. Hosoya, H. Kuroki, N. Tanaka, J. R. Barr, P. C. McClure, D. G. Patterson, Jr, E. Jakobsson and A. Bergman, J. Chromatogr., 1997, 786, 237 CrossRef CAS.
| This journal is © The Royal Society of Chemistry 2003 |
