Quantitative liquid chromatography-mass spectrometry determination of catechins in human plasma by automated on-line extraction using turbulent flow chromatography
Masahiko
Takino
a,
Shigeki
Daishima
b,
Kenji
Yamaguchi
b and
Taketoshi
Nakahara
c
aYokogawa Analytical Systems Inc., 3-3-11, Niitaka, Yodogawa-ku, Osaka 532-0033, Japan. E-mail: masahiko_takino@agilent.com; Fax: +81-6-6399-3716
bYokogawa Analytical Systems Inc., 2-11-13, Nakacho, Musashino-shi, Tokyo 180-0006, Japan
cDepartment of Applied Chemistry, Graduate School of Engineering, Osaka Prefecture University, 1-1, Gakuen-cho, Sakai, Osaka 599-8531, Japan
First published on 11th December 2002
Abstract
A simple, fast and sensitive liquid chromatography-mass spectrometry (LC-MS) method with automated on-line extraction using turbulent flow chromatography (TFC) for the determination of five catechins in human plasma was developed. In this method, after on-line extraction by its injection onto an extractor column at turbulent flow, five catechins were backwashed onto a reversed phase column via on-line column switching and separated chromatographically at a laminar flow of 1 ml min−1. Using this tandem LC-LC-MS system, the extraction, the separation and the quantitation of five catechins in human plasma could be achieved with satisfactory selectivity and sensitivity. The limit of detection (S/N = 3) ranged from 0.6 to 2 ng ml−1. The described procedure was very simple and rapid since no off-line sample preparation was required, total analysis time being 18.5 min.
1. Introduction
Tea is one of the most highly consumed beverages in the world. Green tea especially is widely thought to be beneficial to human health because it contains substantial amounts of flavonoid antioxidants which may play a role in the prevention of cancer and cardiovascular disease.1–3 The major tea flavonoids are flavan-3-ols, commonly known as catechins, including (+)-catechin (C), (−)-epicatechin (EC), (−)-epigallocatechin (EGC), (−)-epigallocatechin-3-gallate (EGCG) and (−)-epicatechin-3-gallate (ECG). The chemical structures are shown in Fig.1. Oral bioavailability of these catechins following tea ingestion has been demonstrated.4–6 Furthermore, many kinds of metabolite of catechins have been recently identified in human urine and plasma following ingestion of tea by using LC-MS.7,8 In particular the recent development of soft ionization methods, such as electrospray ionization (ESI) and atmospheric pressure chemical ionization (APCI), have made mass spectrometry (MS) an important tool for biological research. Many investigations using LC-ESI-MS or LC-APCI-MS have been reported for qualitative analysis of catechins.9–11 However, the high selectivity and sensitivity of MS detection methods provide decisive advantages to perform qualitative as well as quantitative analysis and developing a high sensitive quantitative method of catechins in the biological fluids is also very important.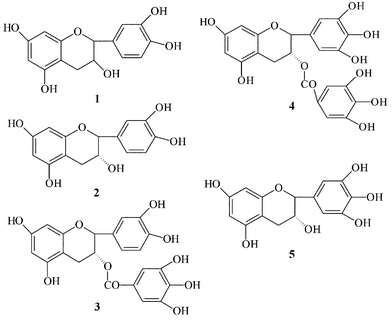 | ||
| Fig. 1 Chemical structure of catechins: 1, (+)-catechin (C); 2, (−)-epicatechin (EC); 3, (−)-epicatechin-3-gallate (ECG); 4, (−)-epigallocatechin-3-gallate (EGCG); 5, (−)-epigallocatechin (EGC). | ||
Liquid–liquid extraction or solid-phase extraction followed by solvent evaporation is the traditional method for sample preparation of biological samples. These procedures are usually time-consuming and often imprecise as many sample manipulations are usually involved. Consequently, there is considerable interest in developing an on-line sample preparation procedure to overcome the need for the time-consuming evaporation and reconstitution steps which are used as the typical off-line sample preparation. On-line direct analysis of biological fluids has been reported using restricted access column12 and solid-phase extraction cartridge.13 Another approach is to employ turbulent flow chromatography (TFC).14–17 To date, almost all of the analytical applications of TFC have been limited to fast quantitative analysis using a very steep gradient14–16 and with little emphasis on chromatographic separation capability. Further, on-line sample preparation for the analysis of catechins in human plasma has never been reported.
This report describes the development of a tandem LC-LC-MS method by using TFC as on-line sample preparation for the determination of five catechins in human plasma.
The proteins in human plasma could be rapidly removed by TFC prior to separation of five catechins by fast-gradient laminar flow chromatography.
2. Experimental
2.1 Materials
The (+)-catechin (C), (−)-epicatechin (EC), (−)-epigallocatechin (EGC), (−)-epigallocatechin-3-gallate (EGCG), (−)-epicatechin-3-gallate (ECG) and human plasma were purchased from Sigma-Aldrich Japan (Tokyo, Japan). HPLC grade acetonitrile and reagent grade formic acid was purchased from Wako Pure Chemicals (Osaka, Japan). Water was purified with a Milli-Q system (Millipore, Tokyo, Japan).2.2 Instrumentation
A tandem liquid chromatography-liquid chromatography-mass spectrometry (LC-LC-MS) system consisted of a Model 2300 TFC system (Cohesive Technologies, Inc., Franklin, MA, USA) including quaternary LC pump, binary LC pump, thermostat column compartment, UV detector (model 1100, Agilent Technologies, Palo Alto, CA, USA), two 6-port switching valves, LC PAL liquid sampler (CTC Analytics, USA) and a 1100 MSD bench top mass spectrometer (Agilent Technologies, Palo Alto, CA, USA) with ESI. The schematic diagram of the tandem LC-LC-MS system and timetable of this system are shown in Fig. 2 and Table 1. An aliquot of human plasma (10 μl) was injected onto a 50 × 1 mm id, 50 μm porous particle TFC C18 column (Cohesive Technologies, Inc., Franklin, MA, USA). A 0.1% formic acid aqueous solution at 5 ml min−1 was used as mobile phase B for on-line extraction to release any catechins from the protein bound catechin. During the extraction step, the eluent from the TFC column was diverted to the UV detector to monitor the protein. The analytes were retained on the TFC column during this period. After 20 s, the TFC column was washed at the same flow rate with solvent B for 10 s by switching the only V-1 so that the flow direction through the TFC column was reversed. For this period, the 150 × 4.6 mm id, 5 μm Zorbax Eclipse XDB C18 analytical column (Agilent Technologies, Palo Alto, CA, USA) was held at 1.0 ml min−1 with 10% solvent C (acetonitrile) and 90% solvent D (0.1% formic acid in water). Subsequently, the V-2 valve was switched so that the analytes trapped at the front of the TFC column were backflushed on the analytical column by 10% solvent C and 90% solvent D. Five catechins were separated using a linear gradient program from 10% solvent C and 90% solvent D to 24% solvent C and 76% solvent D for 13 min, and directed to the ESI source without any splitting. On the other hand, the flow rate of P-1 was reduced to 1 ml min−1 during this period. After that, the analytical column, the V-1 and the V-2 were washed by the five times switching at 1 ml min−1 with solvent A and C for 2 min. Finally, the TFC column and the analytical column were conditioned at 1 ml min−1 for 2 min followed by 5 ml min−1 for 1 min with solvent A, and at 1 ml min−1 with 10% solvent C and 90% solvent D for 3 min, respectively before injection of the next sample. The analytical column was kept at 40 °C and the injection volume was 10 μl. The total cycle time was 18.5 min.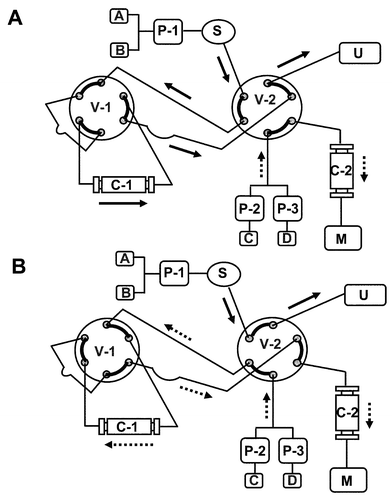 | ||
| Fig. 2 Schematic diagram of the tandem LC-LC-MS system. Pump: P-1, quaternary high pressure pump; P-2 and P-3, binary high pressure pumps. Mobile phase: A and C, acetonitrile; B and D, 0.1% formic acid in water. S, sample injector. Column: C-1, TFC C18 column (50 × 1 mm id, 50 μm); C-2, Zorbax Eclipse XDB C18 column (150 × 4.6 mm id, 5 μm). Six-port switching valves: V-1 and V-2. U, UV detector. M, 1100MSD. A, the flow path during direct extraction under turbulent flow chromatography: V-1 and V-2 are ON. B, the flow path during fast-gradient chromatographic separation under laminar flow chromatography: V-1 and V-2 are OFF. | ||
| Step | Start/s | Period/s | P-1 | P-2 and P-3 | V-1 | V-2 | ||||
|---|---|---|---|---|---|---|---|---|---|---|
| Flow rate | A (%) | B (%) | Flow rate | C (%) | D (%) | |||||
| 1 | 0 | 20 | 5 | 0 | 100 | 1 | 10 | 90 | ON | ON |
| 2 | 20 | 10 | 5 | 0 | 100 | 1 | 10 | 90 | OFF | ON |
| 3 | 30 | 780 | 1 | 100 | 0 | 1 | 24 | 76 | OFF | OFF |
| 4 | 810 | 15 | 1 | 100 | 0 | 1 | 100 | 0 | ON | ON |
| 5 | 825 | 15 | 1 | 100 | 0 | 1 | 100 | 0 | OFF | OFF |
| 6 | 840 | 15 | 1 | 100 | 0 | 1 | 100 | 0 | ON | ON |
| 7 | 855 | 15 | 1 | 100 | 0 | 1 | 100 | 0 | OFF | OFF |
| 8 | 870 | 60 | 1 | 100 | 0 | 1 | 100 | 0 | ON | ON |
| 9 | 930 | 120 | 1 | 0 | 100 | 1 | 10 | 90 | ON | ON |
| 10 | 1050 | 60 | 5 | 0 | 100 | 1 | 10 | 90 | ON | ON |
2.3 Mass spectrometry
Agilent 1100 series MSD single quadrupole instrument equipped with orthogonal spray-ESI (Agilent Technologies, Palo Alto, USA) was used for this investigation. The nebulizer gas (nitrogen, 99.5% purity) and the drying gas (nitrogen, 99.5%, 350 °C) were set to 50 psi and 10 l min−1, respectively. The fragmentor voltage was set to 100 V except for EGC when it was set to 140 V. The other operating parameters of MSD were optimized by Calibrant Delivery System using a calibration standard (Agilent Technologies, Palo Alto, USA) at 0.1 ml min−1. LC-MS determinations were performed by operating the MSD in the negative ion mode. Mass spectra were acquired over the scan range m/z 100–500 using a step size of 0.1 u and a scan speed of 0.5 scans per second. Quantitative analysis was carried out using selected ion monitoring (SIM) of base ion [M–H]− peaks at m/z 305 (EGC), 289 (C and EC), 457 (EGCG) and 441 (ECG) with a dwell time of 500 ms per ion.2.4 Preparation of standard solutions and sample
The method development solutions of 1 μg ml−1 of five catechins mixture solution were prepared in methanol. Working solutions with concentrations of 2, 5, 10, 20, 50, 100, 200, 500 and 1000 ng ml−1 of each compound were prepared in water.Before analysis, the human plasma samples were transferred into a 1 ml polytetrafluoroethene (PTFE) tube and centrifuged at 10000 rpm for 10 min. A 500 μl of the supernatant was transferred into 1.5 ml PTFE vial.
3. Results and discussion
3.1 Evaluation of ESI parameters
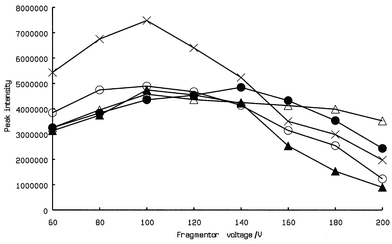
The main operating parameters which have an impact on performance of ESI are the drying gas temperature, flow rate, nebulizer gas pressure and fragmentor voltage. However, optimum drying gas temperature, flow rate and nebulizer gas pressure are not compound dependent and typical values for these parameters are 350 °C, 10 l min−1 and 50 psi, respectively. Only fragmentor voltage was, therefore investigated.The fragmentor voltage is applied to the exit of the capillary and affects the transmission and fragmentation of sample ions by the in-source collision-induced dissociation (CID) in this region.18 In general, the higher the fragmentor voltage, the more fragmentaion will occur and optimum fragmentor voltage is compound dependent. Therefore, the fragmentor voltage was ramped between 60 and 200 V using 1 μg ml−1 standard solution and a distinct optimum in the intensity of the deprotonated ion peak was observed at 100 V for each catechin except EGC. For EGC, the highest intensity of the deprotonated ion peak was observed at 140 V (Fig. 3).
3.2 Optimizations of the on-line extraction parameters by TFC
It has been reported that the plate height of a column is reduced at turbulent flow, which is contrary to prediction by Van Deemter plots.19 This turbulent flow is achieved with acceptable column back pressure using a small inner diameter column packed with large particles.19 However, the use of large particles to achieve suitable column back pressure may decrease the resolution efficiency of this column. Therefore, whether this opposing effect by large particles can be offset by the gain in reduced plate height at turbulent flow, it will impact upon the separation capability of this column. Then, we used TFC only for on-line extraction and performed the analytical separation by conventional reversed phase HPLC using laminar flow in order to improve chromatographic separation. In the two column switching configuration shown in Fig. 2, five catechins were separated from plasma proteins by TFC of 5 ml min−1 using 0.1% formic acid (Fig. 2A). Fig. 2B depicts the elution from the extractor column in the reverse direction at 1 ml min−1 onto the analytical column. The analytical column separates five catechins prior to the mass spectrometric detection. For this on-line extraction by TFC, the effects of loading and washing the extractor column on the recovery of the analytes were investigated using human plasma spiked at 1 ng ml−1 of each catechin. The recovery of each catechin was calculated by comparing the peak intensity obtained by the same LC-MS system without the TFC column using aqueous solutions of five catechins at 1 µg ml−1.As can be seen in Fig. 4, the proteins, a major component of the plasma, were eluted from the extraction column in less than 10 s. On the other hand, the recovery of each catechin for various durations of the loading and the washing stage are shown in Fig. 5. The recoveries obtained for most of the catechins except EC are almost complete and independent of the duration of the loading and the washing in the 10–30 and 5–20 s interval, respectively. Only EC showed values less than 50% when 30 s and 20 s were used to load the plasma and wash the extractor column, respectively. Therefore, in order to obtain a suitable sensitivity and selectivity, the duration of the load step and the wash step was set at 20 and 15 s, respectively.
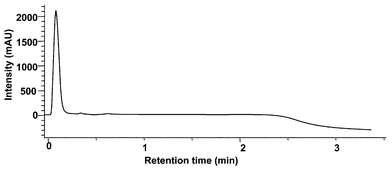 | ||
| Fig. 4 Typical chromatogram of a plasma sample obtained with the extractor column with the UV detector during the loading stage. | ||
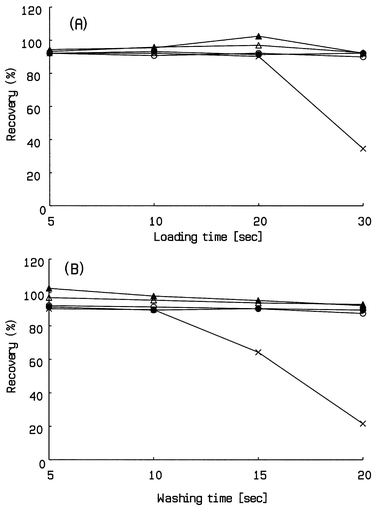 | ||
| Fig. 5 Recoveries of five catechins from the extractor column at loading and washing. Concentration: 1 μg ml−1. For analytical conditions of LC-MS, see Experimental. ● = EGC, ▲ = C, × = EC, ○ = EGCG, △ = ECG (A): Loading stage; (B): washing stage. | ||
Fig. 6 illustrates the SIM chromatograms of a blank plasma sample (Fig. 6A) and a plasma sample spiked at 1 μg ml−1 with a five catechin mixture (Fig. 6B) under the proposed conditions. By comparing these chromatograms, it can be seen that there are no significant co-extractives which may interfere with quantitation of the catechin screen in this study.
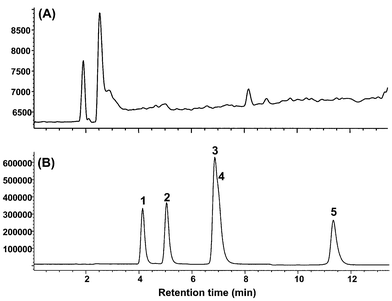 | ||
| Fig. 6 SIM chromatogram of an blank plasma sample (A) and a spiked plasma sample at 1 μg ml−1 of a five catechin mixture (B). 1, EGC; 2, C; 3, EGCG; 4, EC; 5, ECG. | ||
3.3 Recoveries and precision
Table 2 shows the overall recoveries obtained for aqueous solutions of the analytes tested and the spiked plasma samples. It can be observed that the recoveries of all catechins tested in the aqueous sample and the plasma sample are higher than 90%. This indicates that the matrix of the plasma does not affect the recoveries or the ionization efficiency of them. Furthermore, the precision was acceptable for both samples with relative standard deviation (RSD) in the range 2.9 to 4.4% and 3.8 to 5.1%, respectively. Therefore, the addition of the internal standard was not necessary, which is a time-consuming step.3.4 Linearity and sensitivity
In order to achieve optimum sensitivity, all experiments were carried out under SIM conditions and the deprotonated molecular ions were selected as SIM ions for all catechins. For the sensitivity, the limit of detection (LOD) can be decreased if injection volume is increased using this system. However, injection volumes greater than 10 μl decreased the recoveries of some catechins. This phenomenon seems to indicate that the used acidic mobile phase could not completely release all catechins from the protein bound residues. Therefore, injection volume was set at 10 μl. The calibration curve was determined by external calibration in the concentration range from 2 to 1000 ng ml−1 in injection solutions. As shown in Table 3, the linearity was very good for all catechins with correlation coefficients (r2) greater than 0.999.| Catechins | Calibration equation | r 2 a/ng ml−1 | LODsb |
|---|---|---|---|
| y = ax + ba | |||
| a r 2 is the correlation coefficient, x is the injected concentration in ng ml−1 and y is the peak intensity b Limit of detection is defined as S/N = 3 for the spiked human plasma. | |||
| EGC | y = 34291x + 25314 | 0.9993 | 0.6 |
| C | y = 38452x + 19754 | 0.9995 | 2.0 |
| EGCG | y = 43481x + 27541 | 0.9994 | 2.0 |
| EC | y = 58471x + 35421 | 0.9997 | 1.0 |
| ECG | y = 42571x + 17421 | 0.9991 | 1.0 |
The sensitivity of this analytical procedure was evaluated in terms of LOD calculated by using a S/N of 3 with the plasma sample. Human plasma was purchased from Sigma-Aldrich Japan (Tokyo, Japan) having no traces of these catechins and it was spiked with a five catechin mixture solution at 2 ng ml−1. As a result, the LOD of each catechin by this proposed method were in the range of 0.6 to 2 ng ml−1, respectively. The SIM chromatograms of this sample are shown in Fig. 7 and indicate that no significant interference peaks were observed.
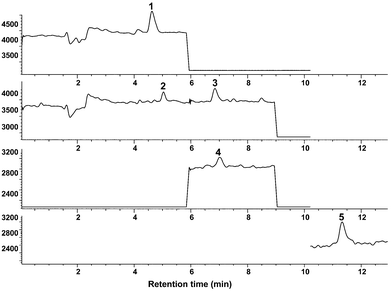 | ||
| Fig. 7 SIM chromatogram of a plasma sample at 2 ng ml−1 of a five catechins mixture: 1, EGC; 2, C; 3, EGCG; 4, EC; 5, ECG. | ||
3.5 Robustness of the method
For the robustness of this method, fifty spiked plasma samples at 5 ng ml−1 were analysed by this developed method. The quantitative results and RSDs of all catechins in the spiked plasma sample using external standard are shown in Table 4. From these quantitative results, the accuracy was in the range of 3.0 to 8.8% and RSDs of quantitative results ranged from 3.9 to 6.1%. These results indicate that any degradation of catechins by oxidation in the plasma was not generated. Further, although fifty plasma samples were directly injected, no rise in back pressure either in the extractor column or in the analytical column was observed. Furthermore, any carry over wasn’t observed in the sequential analysis. These results indicate that almost all sample matrix compounds would be removed from the whole system. As a result, this method seems to be reliable and robust and is therefore applicable to routine analysis. Although the only limiting step is the time required for chromatographic analysis (approximately 13 min after the injection of the sample), the extractor column (C-1) and the flow switching valve (V-1) could be effectively washed to remove any contaminants from the real sample during this step followed by washing the other switching valve (V-2) and the analytical column (C-2).4. Conclusion
The new tandem LC-LC-MS method using TFC has been successfully developed for the direct analysis of five catechins in human plasma for the first time. On-line extraction of catechins from the human plasma sample by TFC was achieved by flowing the moderately acid mobile phase at high flow rate through a short, small-id column packed with large particles. As demonstrated in the present study, this method significantly could reduce the time for sample preparation. The efficiency of the cleanup process by TFC was satisfactory with almost complete recoveries for all analytes tested, precision being excellent. Furthermore, gradient chromatographic separation using laminar flow was demonstrated to be adequate for the separation of all catechins. The present method showed excellent confidence limits at ng ml−1 level of detection of catechins in the human plasma samples.References
- C. S. Yang and Z. Y. Wang, J. Natl. Cancer Inst., 1993, 85, 1038 CrossRef CAS.
- C. S. Yang, Nutrition, 1999, 15, 946 CrossRef CAS.
- T. Ishikawa, M. Sugisawa, T. Ito, H. Yoshida, M. Ayaoti, M. Nishiwaki, A. Yonrmura, Y. Hara and H. Nakamura, Am. J. Clin. Nutr., 1997, 66, 261 Search PubMed.
- K. Okushio, N. Matsumoto, T. Lori, M. Suzuki, F. Nanjo and Y. Hara, Bio. Pharm. Bull., 1996, 19, 326 Search PubMed.
- T. Unno, K. Kondo, H. Itakura and T. Takeo, Biosci. Biotech. Biochem., 1998, 60, 2066 Search PubMed.
- M. J. Lee, S. Prabhu, X. Meng, C. Li and C. S. Yang, Anal. Biochem., 2000, 279, 164 CrossRef CAS.
- C. Li, M. J. Lee, S. Sheng, X. Meng, S. Prabhu, B. Winnik, B. Huang, J. Y. Chung, S. Yan, C. T. Ho and C. S. Yang, Chem. Res. Toxicol., 2000, 13, 177 CrossRef CAS.
- C. Li, X. Meng, B. Winnik, M. J. Lee, H. Lu, S. Sheng, B. Buckley and C. S. Yang, Chem. Res. Toxicol., 2001, 14, 702 CAS.
- J. J. Dalluge, B. C. Nelson, J. B. Tomas, M. J. Welch and L. C. Sander, Rapid Commun. Mass Spectrom., 1998, 11, 753.
- G. K. Poon, J. Chromatogr., A, 1998, 794, 63 CrossRef CAS.
- D. J. Zeeb, B. C. Nelson, K. Albert and J. J. Dalluge, Anal. Chem., 2000, 72, 5020 CrossRef CAS.
- S. R. Needham, M. J. Cole and H. G. Fouda, J. Chromatogr., B, 1998, 718(1), 87 CrossRef CAS.
- G. A. Bowers, C. P. Clegg, S. C. Hughes, A. Harker and S. Lambert, LC-GC, 1997, 15(1), 45 Search PubMed.
- J. Ayrton, G. J. Dear, W. J. Leavens, D. N. Mallet and R. S. Plumb, Rapid Commun. Mass Spectrom., 1997, 11, 1953 CrossRef CAS.
- M. Jemal, Y. Quin and Y. Whigan, Rapid Commun. Mass Spectrom., 1998, 12, 1389 CrossRef CAS.
- D. Zimmer, V. Pickard, W. Czembor and C. Muller, J. Chromatogr., A, 1999, 854, 23 CrossRef CAS.
- H. K. Lim, K. W. Chan, S. Sisenwine and J. A. Scatina, Anal. Chem., 2001, 73, 2140 CrossRef CAS.
- M. Takino, S. Daishima and K. Yamaguchi, Anal. Sci., 2000, 16, 707 Search PubMed.
- H. M. Quin and J. J. Takarewski, International Pat. No. WO 97/16724.
| This journal is © The Royal Society of Chemistry 2003 |