DOI:
10.1039/B209521C
(Paper)
Analyst, 2003,
128, 51-54
Internal standard signal suppression by co-eluting analyte in isotope dilution LC-ESI-MS†
Received 27th September 2002, Accepted 8th November 2002
First published on 25th November 2002
Abstract
The suppression of the internal standard by increasing concentrations of the co-eluting analyte in calibration series and plasma samples analysed by LC-ESI-MS was studied using the isotope dilution technique. A series of three analyte/deuterated analyte pairs including fexofenadine/d6-fexofenadine, dapsone/d4-dapsone and peudoephedrine/d3-ephedrine were investigated. Suppression of the internal standard signal was noticed in extracted plasma samples containing fexofenadine and d6-fexofenadine as internal standard, as well as in solvent based calibration solutions of the three pair of compounds noted above during LC-ESI-MS analysis at flow rates greater than 100 μL min−1. This signal suppression effect was described by invoking Enke’s model of electrospray ion generation. This model suggests that signal suppression can be ascribed to the competition between ionic species for charged surface sites present on the generated droplets during the electrospray process. The slopes of the calibration curves of the three analytes were close to unity (fexofenadien/d6-fexofenadine 0.964 ± 0.008, pseudoephedrine/d3-ephedrine 1.02 ± 0.080 and dapsone/d4-dapsone 0.905 ± 0.048) as predicted by the model, indicating that quantitation should not be affected by the variation in the peak area of the internal standard.
Introduction
Isotope dilution has been extensively used for the quantitation of organic species by gas chromatography-mass spectrometry (GC-MS).1,2 In this technique a stable labelled isotope of the analyte is added to the sample prior to extraction. The physical–chemical similarities between the labelled analyte and the analyte itself ensure that loses during extraction, variations in instrumental response and matrix effects are compensated for. For the same reasons, isotope dilution has also been used in liquid chromatography-electrospray-mass spectrometry (LC-ESI-MS).3–7 In the case of GC-MS, the peak area of the internal standard remains constant, within experimental error, with changes in the co-eluting analyte concentration in a calibration series. This is not the case in LC-ESI-MS. Various reports indicate that the peak area of the internal standard decreases with the increasing concentration of co-eluting analyte in a calibration series.8,9 This effect seems to be prominent under certain LC regimes, such as flow rates greater than 100 μL min−1 into the ESI source. This internal standard signal suppression has been also noticed during analysis of series of samples containing different concentrations of the co-eluting analyte. This variation in the peak area of the internal standard may be interpreted as a sign of response irreproducibility, forcing analysts to increase its concentration in order to reduce peak area variability or to select a non-co-eluting internal standard, thereby losing the advantages that the isotope dilution technique provides.The origin of this signal suppression lies in the electrospray ion generation mechanism itself and it can be explained invoking Enke’s model for electrospray response.10 This model suggests that signal suppression can be ascribed to the competition between ionic species for charged surface sites present on the generated droplets during the electrospray process. In this paper we present examples of this signal suppression effect for various analyte/labelled-analyte pairs. We also demonstrate that despite the predicted variation on the peak area of the co-eluting labelled analyte or internal standard in a calibration curve set, the slope of the calibration curves are not affected.
Background and theory
Enke’s model of ion generation in ESI assumes that there is an exchange of ionised species between the bulk of the generated droplet solution and its charged surface prior to gas phase ion generation, resulting in a partition equilibrium situation. The origin of the surface charge polarisation is either ionised solvent molecules or any other major ionised species with a significant affinity for the surface of the droplets. The on-set of this polarisation takes place the moment the solution is in contact with the high voltage region in the electrospray capillary forming the so called Taylor cone.10,11 Although the process of gas phase ion generation is a complex one and open to various explanations,12 the assumption that the initial ion distribution between bulk liquid and charged surface phases determines in part the composition of the population of gas phase ions is a valid one.11,12 Enke and co-workers10,13,14 expressed this partition equilibrium by means of a coefficient describing the exchange between charged surface and bulk solution species. This coefficient can be expressed as| | | KA/E = [A+]sCE/CA[E+]s | (1) |
where [A+]s and [E+]s are the surface concentration of competing species and CAand CE are their respective concentrations in the bulk phase. In the case of single analyte, A, species E corresponds to charged solvent molecules or solvent impurities present in solution. Addition of a second analyte B, such as co-eluting internal standard, introduces another competing species. The resulting equilibrium will affect the response of analyte A (RA) as described by eqn. (2):| | | RA
∝
CAKA/BQ/[(CAKA/B) + CB + (CEKB/E)] | (2) |
where KA/B is the ratio of KA/E over KB/E and KB/E is defined as in eqn. (1) for species B. Q is the sum total of the ion currents generated during the electrospray process divided by the volume of the droplets surface layer measured as excess charge in equivalents per litre. The value of Q depends on the flow rate, with Q being inversely proportional to it. Increases in the flow rate result in a decrease of the dynamic range, due to a decrease in the value of Q. Under conditions commonly encountered in LC-MS with flow rates greater than 100 μL min−1 and at relatively high concentrations (10−6 to 10−4 M) in the bulk phase, Q is typically close to 10−9 eq L−1. At such values of Q, analyte/internal standard competition for charged surface sites becomes evident8,9 with an exchange between A+ in the bulk of the solution and B+ on the charged surface of the droplets and vice versa taking place. This exchange described as the ratio of KA/E over KB/E can be approximated by:where S is the signal intensity of each ion measured as its peak area. Eqn. (3) assumes negligible depletion of species concentrations in the bulk solution and a direct proportionality between S and the concentration of each species on the charged surface of the droplets. Eqn. (3) also predicts a suppression of the signal from one species with increasing concentration of the second co-eluting species. It also provides an explanation for variations in the peak area of the co-eluting internal standard noticed in samples with significant differences in analyte concentrations.Experimental
The structures of the deuterated compounds used as the internal standard and their respective native analogues are shown in Fig. 1. Fexofenadine (Fex) of purity 99% was obtained from Zenith Gold Line Pharmaceuticals (Northvale, NJ, USA). Dapsone (Dap), and pseudoephedrine (PEph) all of purity greater than 99%, were obtained from United States Pharmacopoeia (Rockville, MD, USA). The synthesised ring-analogues d4-dapsone (d4-Dap) and d6-fexofenadine (d6-Fex) were obtained from Dr Maciejk Kamiski (Mississauga, Ontario, Canada). Ring-deuterated d3-epherine (d3-Eph) was purchased from CND Isotopes (Montreal, Quebec, Canada). Formic acid (FA), trifluoroacetic acid (TFA), ammonium acetate (AcNH4) and HPLC grade acetonitrile (ACN) and methanol (MeOH) were purchased from VWR Scientific (Mississauga, Ontario, Canada). Distilled deionized water was used throughout. All stock solutions were prepared by weighing 10.0 mg of the selected compound on a balance accurate to 1 μg (Model MC-5, Sartorius, Goettingen, Germany) and diluting to 10.0 mL with methanol in a 10.0 mL volumetric flask. Aliquots of the stock solutions were then taken using Eppendorf pipettes to prepare calibration solutions by serial dilution of known volumes of the corresponding compound.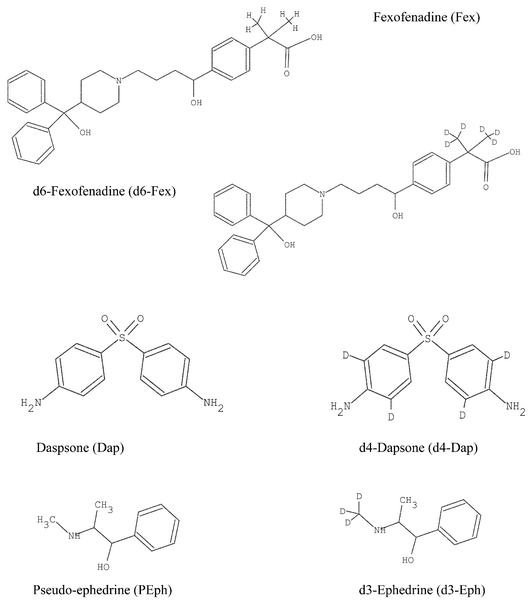 |
| | Fig. 1 Structures of compounds used in the study. | |
Pharmacokinetic data for fexofenadine were obtained from a single-dosed human subject by collecting blood samples at set time intervals for a period of 48 h. Plasma samples were extracted by solid phase extraction using C18 solid phase cartridges followed by liquid chromatography using gradient elution on a Zorbax Eclipse-C18 column (50 mm × 4.6 mm, 3.5 μm) by Agilent® Technologies at a flow rate of 0.6 mL min−1. The solvents used in the chromatographic gradient were 0.01% TFA in water (A) and 0.01% TFA in ACN (B). The gradient consisted of an initial isocratic 30% B conditions kept for 0.5 min, linearly increased to 70% B for 3.5 min, followed by a jump to 100% B and kept for 0.5 min before returning to 30% B followed by an equilibration period of 1.0 min. The column outlet was directly connected to the inlet of ESI source with a 127 μm id stainless steel line. This permitted a flow rate into the source of 0.6 mL min−1. Alternatively, the column outlet line was split by joining the 127 μm id stainless steel line to the centre of a splitter made of a T-joint. One side of the T-joint was connected to a fused silica restrictor capillary of 50 μm id and the other side to a low flow fused silica line of 100 μm id. The restrictor line was directed to waste and the low flow line was connected to the inlet of the ESI source. The LC-ESI-MS system used was an Agilent® 1100 LC-MSD Model G1949-B. The ESI source was operated with a capillary voltage of 4000 V and a fragmentor voltage of 80 V for both pairs of compounds. The source’s temperature was set to 300 °C, the drying gas flow was 13 L min−1 and the pressure was set at 10 psi. The mass spectrometer was used in the positive ion mode. Analyte and internal standard detection was carried out by single ion monitoring the [M+H]+ ions at 502 m/z and 508 m/z for Fex and d6-Fex respectively.
Calibration curves in solvents (1∶1 ACN∶0.1% FA for Dap/d4-Dap and 1∶1 AcNH4∶MeOH pH 9 for PEph/d3-Eph) were prepared to cover the concentration ranges of 0.0 to 8.0 × 10⁻⁵ M for Dap and of 0.0 to 1.5 × 10⁻⁵ M for PEph. The concentration of the internal standards was set for different calibration curves at 0.0, 5.9 × 10⁻⁶ and 5.9 × 10⁻⁵ molar for d3-Eph and at 0, 1.99 × 10⁻⁶, 3.85 × 10⁻⁵ and 9.95 × 10⁻⁵ molar for d4-Dap. LC-ESI-MS analysis was carried out by injection into an Eclipse C18 (4.7 × 50 mm 3.5 µm id column) using 50% v/v 10 mM AcNH4/ACN as mobile phase at a flow rate of 0.5 mL min−1 for Dap/d4-Dap. In the case of PEph/d3-Eph the mobile phase consisted of 40% v/v H2O/ACN containing 0.01% TFA acid and the LC-ESI-MS analysis was done flow rates of 0.6 and 1.2 mL min−1. The LC-ESI-MS system and the conditions were the same as described above. The ions monitored included the [M+H]+ species at 249 m/z and 253 m/z for Dap and d4-Dap respectively and the [M−H2O+H]+ species at 148 m/z and 151 m/z for PEph and d3-Eph respectively. Full scan spectra were taking from 100 to 500 m/z for each compound prior to analysis in order to ascertain their isotopic purity. Labelled analytes did not show any contribution from non-labelled isotopes.
Results
Fig. 2A shows the plot of the peak areas of the analyte Fex and d6-Fex (co-eluting internal standard) versus sampling time in a pharmacokinetic sample batch run at a flow rate of 0.6 mL min−1. It can be clearly seen that the suppression of the internal standard signal is matched with the highest response of the analyte at the maximum concentration in plasma. This signal suppression is significantly reduced when the samples are run with a reduced the flow of 60 μL min−1 into the ESI source (Fig. 2), indicating that at lower flow rates, the source operates under a regime in the value of Q which is sufficiently high to reduce signal suppression. This suppression effect is seen for other analyte–internal standard pairs in response curves as shown in Fig. 3 for Dap/d4-Dap, PEph/d3-Eph and Fex/d6-Fex. This effect can be explained by invoking eqn. (3). As predicted by this model, increasing concentration of the internal standard can also suppress the analyte’s signal. This is clearly demonstrated in Fig. 4 for the PEph/d3-Eph and Dap/d4-Dap pairs. The response curves for both analytes, Dap and PEph, were suppressed by increasing concentrations of their respective co-eluting internal standards.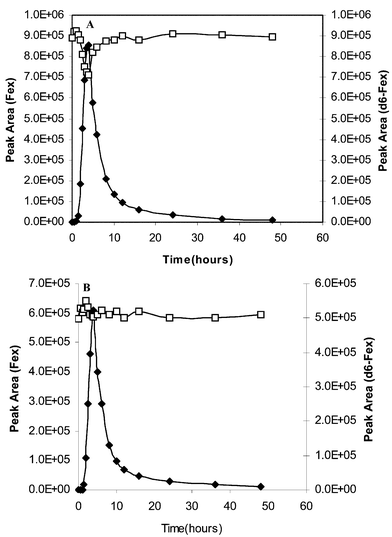 |
| | Fig. 2 Pharmacokinetic curves for fexofenadine in human plasma analysed by LC-MS at (A) 0.6 ml min−1 and (B) 60 μL min−1. Internal standard–deuterated analogue (open symbols) and analyte (close symbols). | |
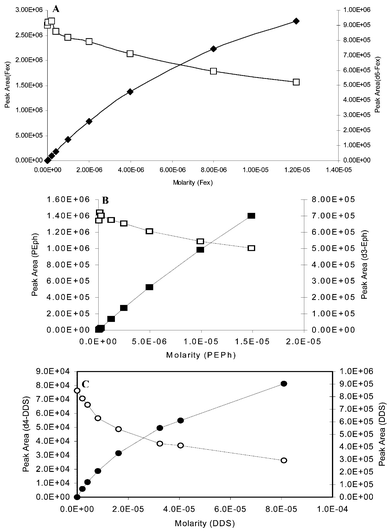 |
| | Fig. 3 Response curves for fexofenadine/d6-fexofenadine (A), pseudoephedrine/d3-ephedrine (B) and dapsone/d4-dapsone (C). Internal standard–deuterated analogue (open symbols) and analyte (close symbols). | |
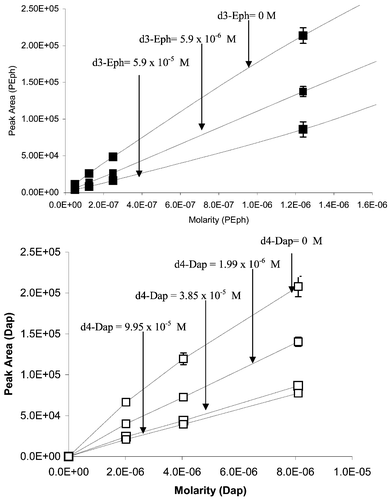 |
| | Fig. 4 Effect of co-eluting internal standard on the response curve for pseudoephdrine (close symbols) and dapsone (open symbols). | |
Eqn. (3) also predicts that the slope of the analyte calibration curves should be constant and equal to KA/Bfor calibration curves generated by plotting the peak area ratio between the analyte and the internal standard versus the concentration ratio of the analyte to internal standard. The values of the slope should be independent from the drop of the internal standard peak area within the analyte’s linear range. Calibration curve followed eqn. (3) in the form SA/SB = KA/BCA/CB as shown in Fig. S1 (Electronic supplementary information (ESI))†. All calibration curves were linear within experimental error. The slopes (KA/B) of the calibration curves are expected to be unity for analytes/internal standard with the same response. Because of their almost identical hydrophobicities,14–16 the exchange coefficient KA/B between analytes and their deuterated analogues should be unity, provided each species behaves exactly the same in the gas phase. The average values for the calibration curve slopes (KA/B) for Fex/d6-Fex, Dap/d4-Dap and Peph/d3-Eph are listed in Table 1. At this point it must be noted that should the co-eluting internal standard be a compound with different response the slope would have been different from unity. In this case the value of the slope would have reflected the relative response of the analyte to the internal standard.
Table 1 Calibration curves slopes for various analyte/internal standards pair
| Analyte/internal standard | Slopea | ±σ | % Relative error | n |
|---|
| Slope = (KA/B). |
|---|
| Fex/d6-Fex | 0.964 | 0.08 | −0.8 | 21 |
| Dap/d4-Dap | 0.905 | 0.048 | −9.5 | 16 |
| Peph/d3-Eph | 1.020 | 0.080 | +7.8 | 16 |
Conclusions
We have shown that the use of isotope dilution techniques for quantitation purposes using ESI-MS may result in variations in the peak area of the internal standard or the co-eluting analyte. These variations are manifested as a steady decrease of the internal standard peak area with increasing concentration of the analyte in a calibration curves or in sample sets. This effect can be accounted for by invoking Enke’s model of electrospray ion generation. Although this variation in the signal of internal standard within a calibration set may be outside the acceptance criteria for signal reproducibility in GLP environments, it has no effect on the calibration curve of the analyte. This is because the ratio of the analyte and internal standard signals is proportional to the ratio of the analyte’s concentration. This effect must then be taken into account when writing acceptance criteria for internal standard peak area reproducibility.Probably the most important effect of co-eluting internal standard is on the method detection limits. Although this study did not focus on detection limits, the results from Fig. 4 indicate that selection of the concentration of the internal standard is of importance. Traditionally, the concentration of the internal standard is selected to be midway between the lowest and the highest concentrations in the calibration curve. This approach may result in significant suppression of the analyte with an increase in detection limit. The implication of this is that concentration of internal standard must be selected in such a way to maintain the desired detection limit.
Acknowledgements
The authors thank Prof. George Agnes of the Chemistry Department at Simon Fraser University, Burnaby, Canada, for valuable discussions on electrospray ion generation.References
- B. A. Way, D. Stickle, M. E. Michael, J. Koenig and J. Turk, J. Anal. Toxicol., 1998, 22, 379–382 Search PubMed.
- P. Ellerbe, S. Meiselman, L. T. Sniegosky, M. J. Welch and E. White, Anal. Chem., 1989, 61, 1710–1723.
- G. O’Connor, C. Dawson, A. Woolford, K. S. Webb and T. Catterick, Proceedings of the 49th ASMS Conference on Mass Spectrometry and Allied Topics, Chicago, Illinois, May 27–31, 2001 Search PubMed.
- L. Gery, B. Ngueyn and P. Yang, J. Chromatogr., A, 2002, 958, 25–33 CrossRef.
- Z. Kuklenyik, D. L. Ashley and A. M. Calafat, Anal. Chem., 2002, 74, 2058–2063 CrossRef CAS.
- F. Magni, S. Pereira, M. Leoni, G. Grisenti and M. Galli Kienle, J. Mass Spectrom., 2001, 36, 670–676 CrossRef CAS.
- R. J. Pwalosky and V. P. Flanagan, J. Agric. Food Chem., 2001, 49, 1282–1286 CrossRef.
- L. E. Sojo, G. R. Agnes, G. Lum and K. M. Verge, Proceedings of the 49th ASMS Conference on Mass Spectrometry and Allied Topics, Chicago, Illinois, May 27–31, 2001 Search PubMed.
- S. Zhou, M. J. Larson, N. Weng and X. Liang, Proceedings of the 49th ASMS Conference on Mass Spectrometry and Allied Topics, Chicago, Illinois, May 27–31, 2001 Search PubMed.
- C. G. Enke, Anal. Chem., 1997, 69, 4885–4893 CrossRef CAS.
- P. Kebarle and M. Peschke, Anal. Chim. Acta, 2000, 406, 11–35 CrossRef CAS.
- S. J. Gaskell, J. Mass Spectrom., 1997, 32, 677–688 CrossRef CAS.
- N. B. Cech, J. R. Krone and C. G. Enke, Anal. Chem., 2001, 73, 208–213 CrossRef CAS.
- N. B. Cech and C. G. Enke, Anal. Chem., 2001, 73, 4632–4639 CrossRef CAS.
- N. B. Cech and C. G. Enke, Anal. Chem., 2000, 72, 2717–2723 CrossRef CAS.
- N. B. Cech and C. G. Enke, Mass Spectrom. Rev., 2001, 20, 362–387 CAS.
|
| This journal is © The Royal Society of Chemistry 2003 |
Click here to see how this site uses Cookies. View our privacy policy here.