DOI:
10.1039/B207558J
(Paper)
Analyst, 2003,
128, 55-60
A pulsed corona discharge switchable high resolution ion mobility spectrometer-mass spectrometer
Received
2nd August 2002
, Accepted 19th November 2002
First published on 11th December 2002
Abstract
A pulsed corona discharge ionisation source, a candidate replacement for 63Ni ionisation sources for ion mobility spectrometry, is described along with a new design of ion mobility spectrometer-mass spectrometer. Preliminary research on the characterisation of the reactant ion peaks associated with the use of this ionisation source was undertaken by assembling a pulsed corona discharge ionisation switchable high-resolution ion mobility spectrometer-mass spectrometer to enable the mobility spectra, atmospheric chemical ionisation mass spectra and selected-mass mobility spectra to be obtained. With ammonia doping at 2.39 mg m−3 in air and a water content of approximately 80 mg m−3 in the positive mode the observed response was attributable to the formation of [(H2O)nNH4]+ and [(H2O)n(NH3)NH4]+ in the reaction region. The observed responses in the negative mode were more complex with evidence for the formation [(H2O)nO2]−, [(H2O)nCO3]−, [(H2O)nHCO3]−, [(H2O)nCO4]− and [(H2O)nNO3]−. The responses due to these species were clearly discernible in the resultant mobility spectra, with enough oxygen-based species formed to support analytically useful responses.
Introduction
Ion mobility spectrometry is an important technological element in the Western Alliance’s chemical weapons defence strategy.1 It is equally important in the technologies deployed to detect the illegal and clandestine transportation of explosives and narcotics. Portable highly sensitive instruments capable of selectively detecting a wide range of analytes from these classes have been developed and distributed in large numbers throughout the world. At the heart of the detection mechanism of these devices lies the production of reactant ions from the currently used 63Ni ionisation source; 241Am sources have also been used, and the arguments associated with 63Ni sources generally tend to apply to these sources as well. In the positive mode, in clean air, the major reactant ion species is [(H2O)nH]+, where the hydration number will map a distribution of sizes of water clusters dependent upon the concentration of water in the ionisation source, the pressure and the temperature. Similarly in the negative mode the reactant ion is mainly based upon [(H2O)nO2]− clusters. The atmospheric pressure chemical ionisation associated with a 63Ni source that yields these species has been described in detail elsewhere.1 The use of 63Ni as an ionisation source has many operational benefits. For instance, it is a stable and long lived ionisation system that requires no power. Further the formation of a wide range of product ions is promoted in the positive and negative modes by the relative low proton affinity of [(H2O)nH]+, and low ionisation energy of [(H2O)nO2]−. However, the continued widespread use of 370 MBq 63Ni sources is problematic as the regulatory environment surrounding manufacture, use, and disposal of portable radioactive sources has resulted in significant resource implications. The development of new ion mobility applications in environmental, clinical and food science applications based on 63Ni is also not a practical proposition, again due to issues associated with portable radioactive sources. Thus, a priority research area in the development of IMS has been the search for a non-radioactive replacement for 63Ni that provides similar, if not equivalent, reactant ion chemistry.
Corona discharge as an alternative
Single point corona discharge sources have been proposed as alternatives to 63Ni. In the positive mode it has been established that similar reactant ion chemistries can be produced,2 with the formation of N2+ in the corona thought to lead to the same sequence of reactions associated with 63Ni.1 Although, studies of tropospheric ion chemistry suggest an alternative route involving the formation of O2+, see eqns (1) to (7).3| | | O2+ + O2 + M → O2+˙O2 + M | (3) |
| | | O2+˙O2 + H2O → O2+˙H2O + O2 | (4) |
| | | O2+˙H2O + H2O → H3O+˙OH + O2 | (5) |
| | | H3O+˙OH + H2O → [(H2O)2H]+ + ˙OH | (6) |
| | | [(H2O)2H]+ + M + H2O→ [(H2O)3H]+ + M | (7) |
As well as this sequence, other side reactions may be identified initiated by the production of NO+.3 Increasing the corona energy unleashes O3 production resulting in a wide variety of atmospheric pressure chemical ionisation pathways. Thus, the adoption of corona discharge sources as replacements for 63Ni for the positive mode requires stable and reproducible corona sources; a non-trivial technical accomplishment. Further, a recent comparative study presented data that clearly indicated different ionisation chemistries between a corona ionisation source and 63Ni, and such a finding raises a wide range of questions relating to the transferability of methods from one point corona discharge ion mobility spectrometer to another.4
Adopting corona discharge ionisation for negative mode ion mobility spectrometry has been problematic due to the formation of NO2−, and NO3− related cluster ions. The reaction pathways that result in the formation of these species are not well defined, but nevertheless the existence of these species is well established. The presence of NO2 in the reactant peak with an electron affinity of 3.91 eV essentially quenches the formation of product ions. Indeed even the formation of Cl− is uncertain in such a case with an electron affinity of 3.61 eV. In contrast the electron affinity of O2 at 0.45 eV explains the wide applicability of 63Ni sources to a range of analytes. Thus until recently it was held that corona discharge ionisation sources were not replacements for 63Ni in the negative mode for fieldable ion mobility spectrometers.
However, a new design of corona ionisation source has been observed to yield ion mobility responses in both the positive and negative modes.5 The essential feature of the approach adopted was to impose a pulsed voltage across two electrodes that caused an ion avalanche with enough energy to produce [(H2O)nO2]− in analytically useful quantities, without producing significant levels of NO2. Further, by pulsing the corona the lifetimes of the electrodes, and hence long-term stability of the system, was enhanced.
Fig. 1 is a schematic diagram of a pulsed corona discharge ionisation source. It shows two electrodes, one longer than the other. The longer electrode is called the primary electrode, and the other is the secondary electrode. Fig. 2 is a plot of the voltage pulse sequence applied to the electrodes during a typical ionisation event in the positive mode. It shows a series of voltage pulses with an approximate frequency of 82 kHz (13 μs period); decaying from an initial pulse amplitude of between ±2 and 4 kV over a period of approximately 1000 μs. The secondary electrode, is used to produce seed ions for the primary electrode which is pulsed to yield an electron avalanche that gives rise to the formation of reactant ions. The cloud of reactant ions rapidly expands under space charge effects, and react with the analyte yielding product ions. Some time after the voltage pulse on the primary electrode (known as the gate delay) the product ions are injected into the drift tube, using a Bradbury–Nielsen ion gate. Preliminary data suggest that the responses obtained from such an ionisation source are equivalent to a 63Ni. Examination of the device and its operating parameters identifies a range of factors that may be exploited to manipulate the reactant ion chemistry associated with it, see Table 1. The operation of a pulsed corona discharge is currently characterised by the secondary electrode offset voltage (2.32 kV in Fig. 2), the primary electrode offset voltage (4.102 kV in Fig. 2), and the primary electrode pulse amplitude (1.942 kV in Fig. 2).
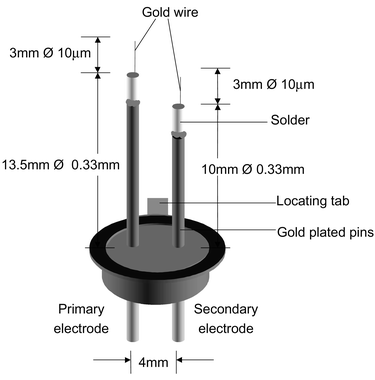 |
| | Fig. 1 Diagram of a pulsed corona discharge ionisation source. | |
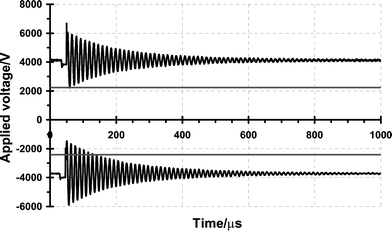 |
| | Fig. 2 A plot of the voltage pulse sequence applied to the electrodes of a pulsed corona discharge ionisation source. The upper pair of traces are used to produce positive ions while the lower pair represent the voltage profile for negative ions production. The flat traces are the voltages of the secondary electrodes, and the oscillating series of pulses are the voltage profiles on the primary electrodes. | |
Table 1 Summary of the operational variables associated with a pulsed corona discharge ionisation source
| Pulsed corona ionisation operational factor |
Positive mode |
Negative mode |
| Primary voltage pulse amplitude |
±1.942 kV |
±2.057 kV |
| Secondary voltage offset |
+2.232 kV |
−2.588 kV |
| Primary electrode voltage offset |
4.102 kV |
3.895 kV |
| Temperature |
298 K |
298 K |
| Pressure |
1.033 bar |
1.033 bar |
| Water concentration |
106 ppm |
106 ppm |
| Analyte concentration |
n/a |
n/a |
| Dopant and concentration |
2.39 mg m−3 |
n/a |
| Gate delay |
12 ms |
11.5 ms |
| Inlet gas flow through source |
150 cm3 min−1 |
150 cm3 min−1 |
Although previously reported ion mobility responses suggest reactant ions similar to those encountered with a 63Ni source, the exact nature of the ions produced by a pulsed corona discharge ionisation source has yet to be established. The aim of this study was to assemble a pulsed corona discharge switchable high resolution ionisation ion mobility spectrometer-mass spectrometer (SHRIMS-MS) to characterise the ion populations present in the resultant reactant ion peaks in the positive and negative modes.
Experimental
Description of the equipment used
Mass spectrometer.
The SHRIMS-MS is shown schematically in Fig. 3. It consisted of a switchable high resolution ionisation ion mobility spectrometer (Graseby Dynamics) and a Model C50 quadrupole mass spectrometer (Extrel). The mass spectrometer was differentially pumped with its pressures measured with Penning gauges and Penning 8 gauges (Edwards). Pressures of approximately 1 × 10⁻⁴ mbar and approximately 1.5 × 10⁻⁶ mbar were observed in the first and second differential pumping stages respectively.
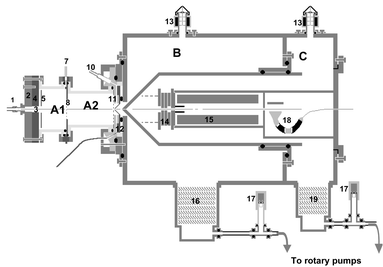 |
| | Fig. 3 A diagram showing the main features of a pulsed corona discharge switchable high-resolution ion mobility-mass spectrometer. Label, description: 1, sample inlet; 2, repeller; 3, electrode assembly; 4, source; 5, extractor; 6, field defining electrodes (reaction region); 7, IMS exhaust; 8, shutter grid assembly; 8a, fixed grid; 8b, moving grid; 9, field defining electrodes (drift region); 10, drift inlet; 11, screen grid; 12, pin hole orifice assembly; 13, penning gauges; 14, lens assembly; 15, quadrupole analyser; 16, turbo pump (Turbovac 1000); 17, pirani gauges; 18, channeltron detector; 19, turbo pump (Turbovac 360H); A1, IMS reaction region; A2, IMS drift region; B, first differential pumping stage; C, second differential pumping stage. | |
The SHRIMS.
Fig. 4 is a simplified drawing of the SHRIMS that was used in this study. In the configuration shown a pulsed corona discharge source was fitted, although it was possible to install a 63Ni source in its place. The pulsed corona discharge was housed in the source of the ion mobility spectrometer. The voltages on the corona electrodes were controlled by the pulsed corona discharge control unit (Graseby Dynamics Ltd). An adjustable 5 kV, 25 W power supply (Stanford Research Systems Inc., Model PS350,) provided the voltage supply, for the SHRIMS. 4 kV was applied to the repeller plate and then divided down on the SHRIMS by a resistor network to provide the source and extractor voltages along with the potentials for the field defining electrodes in the reaction region. The reaction region was 8 cm long and a series of field defining electrodes maintained an electric field gradient of 250 V cm−1. A Bradbury–Nielson ion gate connected the reaction region to the drift tube. The gating signal was derived from the time the corona pulse was initiated and was fed to the IMS control Unit (Graseby Dynamics) which provided the high voltage gating pulse. The gate width and gate delay were controlled from the Pulsed Corona Discharge unit. The 8 cm drift tube electric field gradient (250 V cm−1) was obtained from an adjustable 2.5 kV photomultiplier power supply, (Brandenburg, Model 2476R) set at 2 kV which was then distributed to the field defining electrodes The ion signal detected underwent a two-stage amplification, initially it was passed through the Head Amplifier (Graseby Dynamics) before being further amplified in the IMS Control Unit.
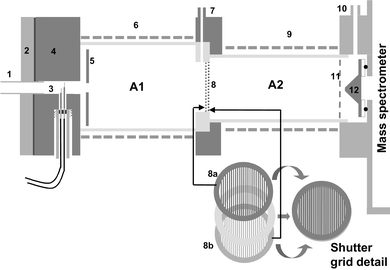 |
| | Fig. 4 Schematic diagram of the switchable high-resolution ion mobility spectrometer. For label descriptions see Fig. 3. | |
The Faraday detector was constructed from gold foil with a 50 μm pin-hole at its centre to allow the passage of a small proportion of the ions into the mass spectrometer for analysis. A Viton o-ring was used to make a seal between the Faraday detector and the first differential pumping stage of the mass spectrometer. A biasing voltage (the cell voltage) was applied to the Faraday detector to accelerate the ions passing through the pin-hole through the first pumping stage with a second voltage applied to the skimmer cone in the first differentially pumped stage of the mass spectrometer to help in reducing the effects seen due to supersonic expansion.
Data collection.
Data was collected using a PC fitted with a PCI-6024E data acquisition (DAQ) card (National Instruments) running a LabView programme specifically written for the task. Two types of data were collected simultaneously: the signal seen from the Faraday plate detector, plotted against drift time; and, the total number of ion counts from the channeltron mass spectrometer detector, plotted against drift time. Tuning the mass spectrometer to a single m/z value enabled the mobility relationships between individual reactant ion species to be studied. While setting the Bradbury–Nielsen shutter to open allowed the complete atmospheric pressure chemical ionisation mass spectrum of the reactant ions formed by the pulsed corona discharge to be acquired.
Gas supplies
Drift gas conditioning.
Two gas supplies were needed to run the experiments. The drift gas and the inlet gas. An air supply for both the inlet and drift gases was generated by passing laboratory service air through a zero air generator (Whatman model 75-83-220). This provided a clean hydrocarbon free supply which was further conditioned using a molecular sieve column to produce air with a moisture content of approximately 7.5 mg m−3. The drift gas was taken from the gas distribution manifold at this point, while the inlet gas was further conditioned by the addition of water.
Preliminary studies indicated that the secondary electrode rapidly deteriorated and failed if the water concentration in the ionisation source fell significantly below 75 mg m−3. Thus, water was continuously added and monitored, Fig. 5. Needle valves V1 and V2 were used to control the flow of gas into the two sections of the system, and the traps T1 and T2 removed any trace contaminants that might have entered the gas streams via the needle valves. The needle valve V2 controlled the gas flow through the water vapour generator which consisted of a stainless steel tube maintained at a constant temperature and filled with 3 mm diameter glass beads. The glass beads were first acid washed, then washed in water and soaked in de-ionised water before being drained. The surface water on the beads was sufficient to introduce trace levels of water into the gas stream when it was passed through them. Stainless steel tubing was used throughout, of note was the use of a coil of 1/16″ tubing to act as a restrictor to balance the back-pressure in the diluent gas section. The two needle valves were adjusted to give the desired flow and a water concentration of 78.8 mg m−3
± 3.8 mg m−3, which was monitored with a moisture analyser (ATAC Model 1803).
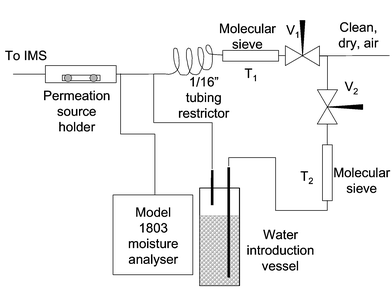 |
| | Fig. 5 Schematic diagram of the gas conditioning and test atmosphere generation system. | |
Introduction of dopant.
In this study an ammonia dopant was used in the positive mode, and the ammonia was introduced by passing the source gas through a test atmosphere generator that contained an ammonia permeation source made from a 0.8 cm3 crimp top glass chromatography vial. The test atmosphere generator was maintained at a constant temperature of 60 °C ± 3 °C. The concentration of ammonia in the inlet gas was determined to be 2.39 mg m−3 based on mass-loss measurements made on the permeation source over a period of 312 h.
Positive and negative mode studies.
Tables 2 and 3 are summaries of the operating parameters used in the positive and negative modes respectively. In each mode a series of atmospheric pressure chemical ionisation mass spectra were obtained to identify the masses of the principal ion species. The mass spectrometer was then tuned and a series of selected ion mobility spectra were obtained.
Table 2 Operational parameters for ion mobility spectrometer
| Ion mobility spectrometer |
| Type |
Switchable high resolution ion mobility spectrometer |
| Inlet |
Direct gas injection |
| Drift gas |
Air |
| Reaction region length |
8 cm |
| Reaction region voltage gradient |
250 V cm−1 |
| Drift length |
8 cm |
| Drift voltage gradient |
250 V cm−1 |
| Ionisation source |
pulsed corona discharge |
| Cell pressure |
Currently estimated at atmospheric—35 torr |
| Cell temperature |
298 K |
| Drift flow |
150 cm3 min−1 |
| Source flow |
100 cm3 min−1 |
| IMS signal processing |
| Period of scan |
40 ms |
| Data points per scan |
1024 |
| Signal averaging |
1000 scans |
| Gating pulse duration |
200 μs |
| Acquisition frequency |
25.6 kHz |
Table 3 Mass spectrometer operational parameters
| Mass spectrometer |
| Mode |
Positive mode |
Negative mode |
Units |
| Emission |
0 |
0 |
|
| IR |
7.0 |
−15.5 |
V |
| eV |
0 |
0 |
V |
| Lens 1 |
−128.9 |
140 |
V |
| Lens 2 |
120 |
−130 |
V |
| Lens 3 |
−22 |
40 |
V |
| Lens 4 |
−50 |
200 |
V |
| Extractor |
−85 |
50 |
V |
| Delta res. |
0 |
0.5 |
|
| Delta M |
|
−0.5 |
|
| Sensitivity |
16 |
16 |
|
| Cell bias |
20 |
−30 |
V |
| Skimmer bias |
−10 |
10 |
V |
| Mass spectrometer signal processing |
|
m/z Scan range |
|
10–400 |
u |
| Dwell time |
|
800 |
ms |
| Signal averaging |
|
2 |
|
Results and discussion
Positive mode
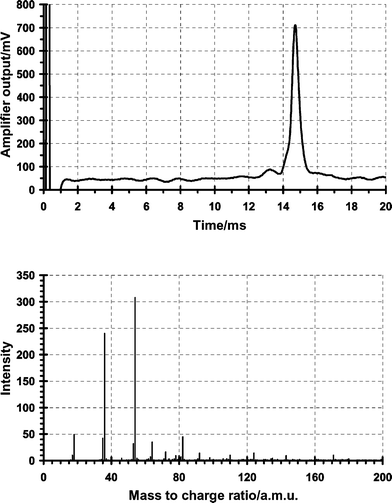
Fig. 6 shows an ion mobility spectrum obtained in the positive mode with a pulsed corona discharge ionisation source and its accompanying atmospheric pressure chemical ionisation mass spectrum. The individual contributions to the reactant ion peak are clearly discerned in Fig. 7, which show predominantly ammonium water clusters with minor ammonia cluster contributions. Table 4 is a summary of the assignments for all the ions identified, note that the mixed clusters with nitrogen are believed to be formed in the ion mobility spectrometer-mass spectrometer interface. These data support the proposition that the reactant ion chemistry was essentially the same as that obtained with 63Ni.1
![Mass-selected ion mobility spectra, with close up, obtained for a gate delay of 12 ms showing the principal species present in the reactant ion peak for an ammonium doped pulsed corona discharge ionisation source operating in the positive under the conditions shown in Tables 2 and 3. m/z 18 = [NH4]+, 35 = [(NH3)(NH4)]+, 36 = [(H2O)(NH4)]+, 54 = [(H2O)2(NH4)]+, 64 = [(H2O)(N2)(NH4)2]+, 72 = [(H2O)2(NH4)]+, 82 = [(H2O)2(N2)(NH4)]+.](/image/article/2003/AN/b207558j/b207558j-f7.gif) |
| | Fig. 7 Mass-selected ion mobility spectra, with close up, obtained for a gate delay of 12 ms showing the principal species present in the reactant ion peak for an ammonium doped pulsed corona discharge ionisation source operating in the positive under the conditions shown in Tables 2 and 3. m/z 18 = [NH4]+, 35 = [(NH3)(NH4)]+, 36 = [(H2O)(NH4)]+, 54 = [(H2O)2(NH4)]+, 64 = [(H2O)(N2)(NH4)2]+, 72 = [(H2O)2(NH4)]+, 82 = [(H2O)2(N2)(NH4)]+. | |
Table 4 Summary of peak assignments from the mass spectrometric study of the reactant ion peak produced by a pulsed corona discharge doped with ammonia in the positive mode under the conditions summarised in Tables 1, 2 and 3
|
m/z |
I
a
|
Assignment |
|
I = intensity of mass peak.
|
| 18 |
49 |
[NH4]+ |
| 35 |
42 |
[(NH3)NH4]+ |
| 36 |
240 |
[(H2O)NH4]+ |
| 37 |
3 |
[(H2O)2H]+ |
| 46 |
4 |
[(N2)NH4]+ |
| 52 |
2 |
[(NH3)2NH4]+ |
| 53 |
32 |
[(H2O)(NH3)NH4]+ |
| 54 |
308 |
[(H2O)2NH4]+ |
| 55 |
4 |
[(H2O)3H]+ |
| 62 |
3 |
[(CO2)NH4]+ |
| 63 |
7 |
[(N2)(NH3)NH4]+ |
| 64 |
35 |
[(H2O)(N2)NH4]+ |
| 71 |
3 |
[(H2O)2(NH3)NH4]+ |
| 72 |
16 |
[(H2O)3NH4]+ |
| 74 |
3 |
[(N2)2NH4]+ |
| 78 |
9 |
[(O2)(N2)NH4]+ |
| 79 |
2 |
[(CO2)(NH3)NH4]+ |
| 80 |
9 |
[(H2O)(CO2)NH4]+ |
| 82 |
48 |
[(H2O)2(N2)NH4]+ |
Negative mode
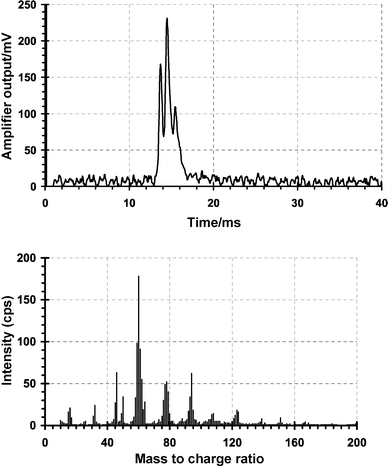
Fig. 8 shows the ion mobility spectrum and its associated mass spectra for a negative mode reactant ion peak in air, and the individual ion contributions obtained from selected-mass mobility spectra are presented in Fig. 9. Table 5 summarises the assignments for the major ions identified.
![Mass-selected selected ion mobility spectra, with close up, obtained for a gate delay of 11.5 ms showing the principal species present in the reactant ion peak for a pulsed corona discharge ionisation source in air operating in the negative mode under the conditions shown in Tables 2 and 3. m/z 50 = [(H2O)(O2)]−, 60 = [(N2)(O2)]−, 61 = [HCO3]−, 62 = [NO3]−, 94 = [(H2O)(CO2)(O2)]−.](/image/article/2003/AN/b207558j/b207558j-f9.gif) |
| | Fig. 9 Mass-selected selected ion mobility spectra, with close up, obtained for a gate delay of 11.5 ms showing the principal species present in the reactant ion peak for a pulsed corona discharge ionisation source in air operating in the negative mode under the conditions shown in Tables 2 and 3. m/z 50 = [(H2O)(O2)]−, 60 = [(N2)(O2)]−, 61 = [HCO3]−, 62 = [NO3]−, 94 = [(H2O)(CO2)(O2)]−. | |
Table 5 Summary of peak assignments from the mass spectrometric study of the reactant ion peak produced by a pulsed corona discharge in air in the negative mode under the conditions summarised in Tables 1, 2 and 3
|
m/z |
I
a
|
Assignment |
|
I = intensity of mass peak.
|
| 32 |
24 |
[O2]− |
| 45 |
27 |
Not assigned |
| 46 |
63 |
[NO2]− |
| 50 |
34 |
[(H2O)O2]− |
| 60 |
178 |
[(N2)O2]−; [CO3]− |
| 61 |
91 |
[HCO3]− |
| 62 |
55 |
[NO3]− |
| 64 |
28 |
[(H2O)NO2]− |
| 76 |
30 |
[(CO2)O2]− |
| 77 |
49 |
Not assigned |
| 78 |
52 |
[(H2O)(N2)O2]− [(H2O)CO3]− |
| 79 |
40 |
[(H2O)HCO3]− |
| 80 |
14 |
[(H2O)NO3]− |
| 91 |
7 |
[(N2)HNO3]− |
| 92 |
17 |
[(O2)CO3]− |
| 93 |
34 |
[(O2)HCO3]− |
| 94 |
62 |
[(H2O)(CO2)O2]− |
| 96 |
7 |
[(H2O)2(N2)O2]−, [(H2O)2CO3]− |
Fig. 8 was obtained with a gate-delay of 11.5 ms and this was selected to enable all three peaks to be present in the same spectra. The electric field and drift length in the reaction region, see Table 3 means that charge separation of the reactant ion groups occurs in the reaction region and that changes in the gate delay produce profound changes in the relative intensities of the individual peaks discernible in Fig. 8. Three distinct groups of ions may be identified from the selected-mass mobility spectra, Fig. 9, and reconciliation of the mobility spectrum to the mass spectrum is complicated by the existence of different species with the same m/z values. The tentative assignments proposed in Fig. 9 and in Table 5 are based on previous studies of negative ion chemistry in the earth’s troposphere and APCI negative ion mass spectrometric studies reported previously.3 At this stage a definitive assignment of all the m/z = 60 features would be premature. These data indicate that there are more than one species with m/z = 60 present in the reaction region. It seems reasonable to consider that [(H2O)nO2]− clusters are present in the reaction tube and these go on to produce [(H2O)n(N2)O2]− (m/z = 60 in Table 5) clusters in the mass-spectrometer interface. Additionally there is some indication that ozone is also formed in the pulsed corona discharge, which rapidly reacts to form the [(H2O)nCO3]− and [(H2O)nHCO3]− (m/z = 60 and 61 in Table 5) clusters observed associated with the middle peak.6 The formation of [(H2O)n(O2)CO2]− is also associated with the middle peak and the association of [(H2O)nO2]− with this set of peaks is thought to arise from dissociation phenomena, once again in the interface region; in designing the experiment a balance had to be struck between sensitivity and the voltage difference between the cell and skimmer cone in that sensitivity could only be bought by increasing the fragmentation and declustering phenomena associated in the interface between the pin hole and skimmer cone orifice. The trailing peak (drift time = 15.48 ms) was due to [(H2O)NO3]− (m/z = 62) also produced by ozonolysis, a range of NOx related species were associated with this peak.
Summary
The reactant ion chemistry in the negative mode yielded by a pulse corona discharge is more complicated than that observed with a 63Ni source.7 The presence of NOx, and especially [NO3]− means that charge will be sequestered to these species. Nevertheless it appears in this preliminary study that enough [O2]− species are produced for this source to be considered as candidate replacement source for 63Ni. The ions observed in the positive mode were to all extents the same as those obtained for 63Ni.
The opportunities for control of the ionisation process offered by a corona discharge are interesting. Early work,5 has already established that ion formation dynamics may be exploited to impart additional selectivity to ion mobility responses and that the voltage and gas flow profiles within the pulsed corona discharge may be manipulated to modify the overall nature of the reactant ion chemistry associated with this ionisation source, and research into this area is a logical application of the instrument described in this work.
Acknowledgements
The Authors gratefully acknowledge the financial support for this research received from DSTL Porton Down. They also thank the staff at Smiths Detection for their technical support and assistance in this work. In particular they wish to thank Alan Brittain and Paul Arnold.
References
-
G. A. Eiceman and Z. Karpas, Ion Mobility Spectrometry, CRC Press Inc., Boca Raton, FL, 1993 Search PubMed.
-
K. R. Marcus, Glow Discharge Plasmas in Analytical Spectroscopy, John Wiley and Sons Ltd, UK, 2003 Search PubMed.
-
Gas Phase Ion Chemistry, ed. M. T. Bowers, Academic Press, New York, 1979, vol I Search PubMed.
- H. Borsdorf and M. Rudolph, Int. J. Mass Spectrom., 2001, 208, 67–72 CrossRef CAS.
-
R. B. Turner, S. J. Taylor, A. Clarke and P. D. Arnold, U.S. Patent 6,225,623, 2001.
-
S. K. Ross and A. J. Bell, Int. J. Mass Spectrom., 2002, 218, pp. L1–L6 Search PubMed.
- V. Bocus-Bintintan, A. Brittain and C. L. P. Thomas, Analyst, 2002, 127, 1211–1217 RSC.
|
| This journal is © The Royal Society of Chemistry 2003 |
Click here to see how this site uses Cookies. View our privacy policy here. 


![Mass-selected ion mobility spectra, with close up, obtained for a gate delay of 12 ms showing the principal species present in the reactant ion peak for an ammonium doped pulsed corona discharge ionisation source operating in the positive under the conditions shown in Tables 2 and 3. m/z 18 = [NH4]+, 35 = [(NH3)(NH4)]+, 36 = [(H2O)(NH4)]+, 54 = [(H2O)2(NH4)]+, 64 = [(H2O)(N2)(NH4)2]+, 72 = [(H2O)2(NH4)]+, 82 = [(H2O)2(N2)(NH4)]+.](/image/article/2003/AN/b207558j/b207558j-f7.gif)
![Mass-selected selected ion mobility spectra, with close up, obtained for a gate delay of 11.5 ms showing the principal species present in the reactant ion peak for a pulsed corona discharge ionisation source in air operating in the negative mode under the conditions shown in Tables 2 and 3. m/z 50 = [(H2O)(O2)]−, 60 = [(N2)(O2)]−, 61 = [HCO3]−, 62 = [NO3]−, 94 = [(H2O)(CO2)(O2)]−.](/image/article/2003/AN/b207558j/b207558j-f9.gif)
