Novel sodium-selective fluorescent PET and optically based chemosensors: towards Na+ determination in serum
Received (in Cambridge, UK) 19th July 2001, Accepted 29th October 2001
First published on 5th December 2001
Abstract
The anthracene based fluorescent PET chemosensor 1 and the azo-dye based chemosensor 2 show high selectivity for Na+ over other alkali and alkaline-earth metal cations in the 12–300 mM concentration range in 50 ∶ 50 MeOH–H2O at pH 7.4. Chemosensor 1 shows fluorescence ‘off-on’ switching upon Na+ complexation with λFmax of 440 nm and a log βNa of 2.5 (±0.05) and a pKa of 5.3 with no concomitant changes in the absorption spectra. Conversely, 2 displays only a weak fluorescent emission at around 520–640 nm, and large changes in its absorption spectra upon addition of Na+, with a log βNa of 1.25 (±0.05) and a pKa
of 3.9. In 100% water the sensitivity of 2 for Na+ was somewhat lower with a log βNa of 0.8 (±0.05). The crystal structure of 2, and its corresponding protonated form (2·H+) were obtained, showing 2 in its trans conformation with the crown ether moiety at a 75° angle to the plane of the chromophore. These results, in conjunction with 1H NMR measurements of 2, and UV–VIS measurements of the ion receptor 3, suggest that upon complexation of Na+, the 2′-methoxy group of the crown receptor participates in the Na+ complexation through chelation to the Na+ ion. We propose that this interaction
forces the amine moiety of the crown ether to twist out of the plane of the chromophore, inducing loss of conjugation which gives rise to large Na+-induced spectral changes in the absorption spectra, which are most noticeable for 2.
Introduction
The recognition and sensing of physiologically important species using optically based chemosensors is of current interest in biology and medicine,1 where changes in photophysical properties such as absorption intensities,2 emission wavelength,3 quantum yield (ΦF) and excited state lifetime4 are modulated upon ion or molecular recognition. In particular, developing sensors for continuous monitoring of group I and II cations in the extra- and in the intracellular environment has been an important area of research.5,6 Nearly all animal cells maintain a large differential in their intra-and extracellular Na+ and K+ concentrations, and the knowledge of [Na+] is essential to estimate many physiological processes occurring within the cell.7
Consequently, several research groups have developed optically based chemosensors for the detection of free cytosolic Na+ and K+.5,7 Less attention has been paid to the developments of optically based sensors for blood sodium,8 but traditionally, electrochemically based sensors have been used to achieve selective detection of blood or serum Na+ which in blood has an upper limit of 145 mM and a lower limit of 133 mM.9 For such selective and reversible detection, optically based sensors have several advantages over ion selective electrodes (ISE). In addition to providing fast response time, real time, on-line and non-invasive monitoring, the need for reference electrodes, or a high concentration of electrolyte is eliminated.10 Furthermore, instability of signal, expensive and multiple fabrication techniques and the
need for frequent calibration is also a drawback to the use of ISE for clinical analysis.9The use of photoinduced electron transfer (PET) sensors is a particularly attractive means of obtaining sensing information through luminescence detection. Designed as a lumophore-spacer-receptor system as developed by de Silva et. al.,4,11 an analyte input at the receptor site modulates the photophysical properties at the emitting site, e.g. the luminescence is switched ‘on’1,4,11 or ‘off’12 upon recognition. The versatility of this design is now well established and examples include a wide variety of sensors for alkali, alkaline-earth and transition metal cations,4,11 anions13 and organic molecules.14 Several excellent reviews have recently been published on this sensing method.4,15
For on-line physiological monitoring of Na+ such chemosensors need to be able to detect the ion at physiological pH with only minimal interference from other physiologically important ions and molecules, especially K+ and Ca2+ which have lower and upper concentration limits in the range 3.5–4.8 and 2.2–2.6 mM, respectively. With this in mind we set out to develop optically based sensors that showed high Na+ selectivity while discriminating over K+, Ca2+ and Mg2+ at physiological pH, with the potential to incorporate these sensors into optodes,16 or optical fibres17 or use them as monolayers on glass surfaces.18 Furthermore, we are interested in designing receptors for Na+ for incorporation into antenna moieties for use in delayed Eu(III)/Tb(III)
luminescent chemosensors, which emit with characteristic line-like emission bands at long wavelengths. We have recently developed several such systems designed to detect H+, Mg2+ and Ca2+,19 as well as using such complexes to demonstrate the function of logic-gate operation on a molecular level.20 Accordingly,21 we set out to prepare the Na+ receptor 3: a 2-methoxy based monoaza-15-crown-5 receptor originally designed by Gokel et al. as a 15-membered nitrogen-pivot lariat ether, which is the starting point for the synthesis of the two new chemosensors 1 and 2 (Scheme 1), described herein.22
 |
| | Scheme 1 Synthesis of compounds 3, 1 and 2: (i) Na2HPO4, KI, ClCH2CO2CH3 and CH3CN; (ii) LiAlH4, THF; (iii) NaH, THF, (TsOCH2CH2OCH2)2; (iv) ZnBr2, CH2Cl2; (v) a. (NO2)C6H4NH2, NaNO2, HCl, THF–H2O (1 ∶ 1), b.3. | |
Results and discussion
Our aim was twofold: to develop the fluorescent PET chemosensor: 1, which would display ‘off-on’ switching upon Na+ recognition, and 2, an Internal Charge Transfer (ICT) based chemosensor that would display colour changes at long wavelengths upon interaction with Na+.23 The role of the aromatic unit of 3 is twofold: the aromatic amine was expected to have a pKa in the region 4–5, allowing selective Na+ recognition in the physiological pH range without any interferences from H+, and the o-methoxy group acts as an extra chelation site, directly participating in the Na+ complexation (the lariat ether effect). Furthermore, we expect that such interaction will also help K+ discrimination due to
steric effects. A similar design has recently been effectively used in the form of the bis(o-methoxy) receptor 4, for the determination of Na+ in an intracellular environment.11,24Synthesis of 1 and 2
The synthesis of 3 was achieved using a modified version of Gokel's procedure, Scheme 1.22 Double alkylation of the nitrogen of o-anisidine using ethyl bromoacetate gave the α-amino diester, which was reduced using LiAlH4 to yield the bis ethyl alcohol, which was reacted with triethylene glycol ditosylate to yield 3 in 35% yield after purification using column chromatography on neutral aluminium oxide (30 ∶ 70 EtOAc–hexane). The anthracene based PET sensor 1 was formed in one step from 3 using a ZnBr2 catalysed Friedel–Crafts alkylation of 9-(bromomethyl)anthracene in refluxing dry CH2Cl2 for 48 hours, followed by successive washing with 1 M EDTA and deionised water.
The crude product was then treated with aqueous acid solution followed by purification by column chromatography on neutral alumina (20 ∶ 80 EtOAc–hexane), yielding 1 in 15% yield as a yellow oil.25 All products were fully analysed using 1H and 13C NMR, IR, electrospray MS (ESMS) and accurate mass analysis. The 1H NMR (in CDCl3) of 1 showed the expected resonances for the aromatic signals between 8.44 and 6.57 ppm, and a singlet at 4.97 ppm for the 2′-methoxy group, a multiplet at 3.65 and a triplet at 3.41 for the crown ether protons. The ESMS, when recorded in MeOH, showed a single peak at 516.3 corresponding to the molecular ion. When recorded in CH3CN, a new peak appeared at 538.7, corresponding to the formation of the Na+ complex of 1.
The azo-dye chemosensor 2 was obtained from the receptor 3 as a red powder in 50% yield in a one-pot reaction, using a synthetic procedure developed by Vögel et. al.26 for synthesis of simple azo-dye based aromatic crown ethers, by first carrying out diazotization on p-nitroaniline in H2O–THF at 0 °C followed by addition of 3. The resulting mixture was stirred at room temperature for 12 hours followed by purification by column chromatography on neutral alumina (30 ∶ 70 EtOAc–hexane). We also attempted the synthesis of other azo-dye sensors by this coupling method, using diazonium salts of p-chloro, p-carboxylic and p-sulfonic acids, but these couplings were unsuccessful, and none of the right products were obtained. The 1H NMR of 2 showed a single resonance for the methoxy group at 3.91 ppm, and a multiplet and a triplet at 3.68 and 3.78 ppm respectively for the crown ether protons. As in the case of 1, the ESMS showed only two peaks at 475.5 and 497.5 for the molecular ion and the Na+ complex of 2, when recorded in CH3CN.Ground and excited state investigation of 1 and 3
The absorption spectra of the PET sensor 1 showed four characteristic absorption bands at 335, 350, 368 and 388 nm, when measured in 50 ∶ 50 (v/v) MeOH–H2O at pH 7.4 (0.01 M Tris buffer), in the presence of 0.1 M tetramethylammonium chloride (TMACl) to maintain constant ionic strength. Due to solubility problems the use of higher H2O volumes was not possible. The four absorption bands showed only a small reduction in intensity (<14%) upon addition of a large excess of HCl or NaCl, demonstrating the insulating effect of the methyl spacer, which minimises any π–π interaction between the chromophore and the receptor, and hence any ground state interactions. In contrast, the absorption spectrum of receptor 3, consisting of two bands at 285 and 245 nm when measured under the same conditions, was significantly affected by the addition of HCl or NaCl,
with both hypsochromic and hyperchromic shifts being observed and an isosbestic point at 275 nm upon complexation of Na+. By careful titration, a pKa of 5.8 (±0.05) was determined from the changes in the absorption vs. pH profile and a stability/binding constant for Na+ (log βNa) of 2.4 (±0.05) was determined when 3 was titrated with sodium acetate, Fig. 1.† The log βNa value is comparable to that obtained by Gokel et al. who determined the stability constant for Na+ in MeOH as 3.86.22 The observed absorption changes are due to complexation of the Na+ within the crown ether, which deconjugates the nitrogen electron pairs from the aromatic ring, causing the absorption to be shifted to shorter wavelength, Fig. 1. Such an observation has previously been shown for the bis aromatic analogue 4.27 With the aim of investigating the selectivity
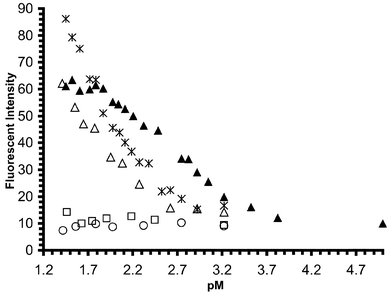
of 3 for Na+ over other competitive cations, an absorption titration was carried out using Li+, K+, Mg2+ and Ca2+ chloride and acetate salts, Fig. 2. The Na+, Li+ and Ca2+ profiles showed sigmoidal behaviour when the absorption changes were plotted vs. pM (pM =
−log [M], M = Na+, Li+, K+, Mg2+ and Ca2+), consistent with a simple ion-binding equilibrium. The trend or the shape of the profiles was not anion dependent. From these changes, log β values of ca. 1.7 and 1.5 were estimated for Ca2+ and Li+, respectively, whereas the absorption changes were too small to be determined for K+ and Mg2+. When these
titrations were carried out in 9 ∶ 1 H2O–MeOH solution, log β was determined to be 1.8 for Na+, and ca. 1.2, 1.1, and 0.9 for Ca2+, Li+ and Mg2+, respectively, whereas the changes for K+ were insignificant.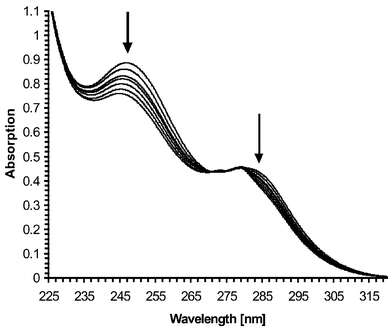 |
| | Fig. 1 Changes in the absorption spectra of the receptor 3 upon addition of sodium acetate (selected spectra from the 0–0.5 M range) to a solution of 3 in 50 ∶ 50 H2O–MeOH solution, and in the presence of 0.1 M TMACl, at pH 7.4. | |
![Absorption vs. pH profiles for the titration of 3 with MeCO2− M+: M+
= Mg2+ (△); K+ (□); Li+ (); Ca2+ (▲); Na+ (♦), measured at 246 nm.(pM =
−log [M]).](/image/article/2002/P2/b106474f/b106474f-f2.gif) |
| | Fig. 2 Absorption vs. pH profiles for the titration of 3 with MeCO2− M+: M+
= Mg2+ (△); K+ (□); Li+ (![[Cross with vertical bar through centre]](https://www.rsc.org/images/entities/char_e113.gif) ); Ca2+ (▲); Na+ (♦), measured at 246 nm.(pM =
−log [M]). ); Ca2+ (▲); Na+ (♦), measured at 246 nm.(pM =
−log [M]). | |
The fluorescence spectra of 1 showed three intense bands at 391, 414, and 438, and a small shoulder at 463 nm, when measured in acidic (pH = 3), 50 ∶ 50 H2O–MeOH solution in the presence of 0.1 M TMACl. In alkaline solution (pH = 10) the emission intensity was, however, substantially reduced without any other spectral changes. A pH titration of 1 revealed that the fluorescence emission was gradually ‘switched on’ upon addition of acid to an alkaline solution of 1, with a fluorescent enhancement factor (FE) of ca. 20, at pH 3, Fig. 3, and a pKa of 5.3 (±0.05). 1 is thus displaying real ‘off-on’ switching upon protonation of the aromatic amine, which is well-documented
behaviour of PET sensors.11 The quantum yield of fluorescence (ΦF) of 1 in acid was found to be 0.38 (±0.005), whereas in base it was 0.02 (±0.005).28,29 The singlet excited state lifetime (τs) for 1 in acid and base was measured as 7.59 and 2.33 ns, respectively. These findings show that an effective PET occurs from the receptor to the fluorophore prior to the H+ recognition by an electron transfer from the electron rich receptor to the anthracene moiety and that upon protonation the thermodynamic pathway for such quenching is reduced, i.e. PET is deactivated and the fluorescence emission is ‘switched on’.
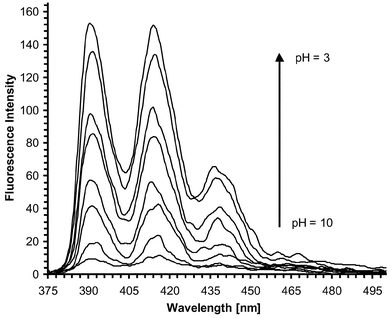 |
| | Fig. 3 Changes in the fluorescence emission of 1 upon titration with H+, (pH = 10–3), in 50 ∶ 50 H2O–MeOH, showing the fluorescence emission spectra being ‘switched on’ upon addition of the acid. | |
It was expected that the fluorescence sensitivity of 1 in the presence of competitive cations would mirror that seen earlier for 3. A fluorescence titration of 1 using Na+, K+, Li+, Mg2+ and Ca2+ salts of acetate and chloride, indeed showed the same trend, which was anion- independent. Under the same conditions as above, the addition of sodium acetate switched on the fluorescence of 1 by a factor 5.5, Fig. 4, with a ΦF of 0.08 (±0.005) and a log βNa of 2.5 (±0.05) Fig. 5. From the changes seen in Fig. 5, log β of ca. 1.8 and 1.6 were determined for the binding of Li+
and Ca2+ to 1, respectively, but from the shape of the binding profile it can be predicted that the fluorescence emission was not fully switched on in these two cases.
![Changes in the fluorescence emission spectra of 1, in 50 ∶ 50 H2O–MeOH upon addition of sodium acetate, in the concentration range [Na+] = 0–1.5 pNa.](/image/article/2002/P2/b106474f/b106474f-f4.gif) |
| | Fig. 4 Changes in the fluorescence emission spectra of 1, in 50 ∶ 50 H2O–MeOH upon addition of sodium acetate, in the concentration range [Na+] = 0–1.5 pNa. | |
 |
| | Fig. 5 Fluorescence emission intensity vs. pM profile. M = Ca2+ (); Na+ (▲); Li+ (△); Mg2+ (□); K+ (○), when observed at 414 nm. | |
The Na+ complexation occurs through electrostatic interactions with the four-oxygen of the macrocycle and the aromatic amine, but additionally through the interaction of the aromatic methoxy oxygen, as observed in the 1H NMR spectra where the CH3 resonance was shifted to lower field upon complexation. These features will be discussed in more detail for 2. No significant binding was observed for Mg2+ and K+, possibly due to the unfavourable size of the latter, and possibly aided by the presence of the aromatic methoxy group, preventing easy access to the cavity. Fig. 5 indicates that larger switching factors could be expected for the binding of Li+ and Ca2+ to 1 compared to that seen for Na+. This can be attributed to a higher charge density of these ions in
comparison with a relatively small cation radius. In the case of Li+, the smaller cation has a higher charge density than Na+, giving rise to a larger increase in the oxidation potential of the receptor upon complexation, which causes an increase in the FE factors. However, due to size discrimination, a tenfold higher concentration of Li+ compared to that of Na+ is needed to bring about such an effect.
From Fig. 5, the cation selectivity is clear; 1 displays the same trend as seen in the absorption spectra of 3: Na+ > Ca2+ > Li+ > Mg2+ and K+. The Na+ sensitivity range is 12.5–0.3 mM which is somewhat lower than that needed for sensing of Na+ in blood. However, since these measurements are carried out in 50 ∶ 50 mixture of H2O–MeOH, the use of these systems in 100% water would consequently decrease the binding constant, which will shift the selectivity to higher Na+ concentration as seen for 3 above. Alternatively the incorporation of these systems into optical fibres, optodes or films could be an attractive way of further developing these systems for on-line
monitoring of Na+, but the efficiency of such a system in aqueous solution requires the use of more hydrophobic based chromophores. For instance the incorporation of an aliphatic chain at the fluorophore side might be sufficient for such purposes.30 We are currently working towards these aims.
Ground and excited state investigation of sensor 2
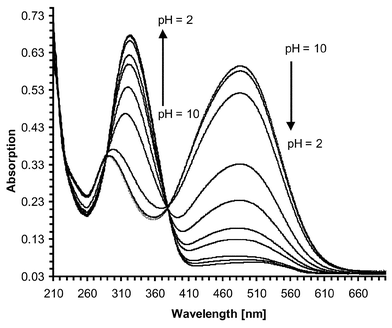
Even though crown ethers have previously been incorporated into azo-dyes, the development of Na+-selective systems for blood has not been previously achieved.26 With this in mind we made 2, which was designed to show substantial changes in absorption spectra rather than in the fluorescence spectra.31 Possessing an ICT excited state, 2 would display changes in the absorption spectrum upon external perturbation, such as protonation or metal ion complexation. Secondly, the absorption of such azo-dyes is shifted substantially towards the visible region, making potential detection in serum or blood more feasible.Our first task was to record the absorption spectrum of 2 under the same conditions as those described above. In alkaline solution (pH 10) a strong absorption band was observed at 487 nm (log ε
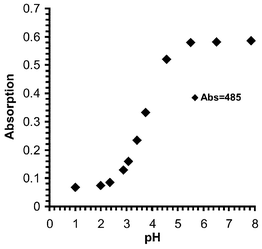
= 4.15 cm−1 M−1) with a smaller band at 288 nm. Upon titration with acid the intensity of the 487 nm band was dramatically reduced as well as hypsochromically shifted to 473 nm, whereas the 208 nm band increased in intensity as well as being bathochromically shifted to 326 nm at pH 3, Fig. 6. From these changes a pKa of 3.9 (±0.05) was determined, Fig. 7, indicating the protonation of the amino moiety at the receptor site. These changes were highly visible to the naked eye.
 |
| | Fig. 6 Changes in the absorption spectra upon addition of HCl to an alkaline solution of 2 in 50 ∶ 50 H2O–MeOH solution at 485 nm. | |
 |
| | Fig. 7 Absorption intensity vs. pH profile for 2, when measured in 50 ∶ 50 H2O–MeOH at 485 nm. | |
With the aim of evaluating the sensitivity and the selectivity of 2, the sensor was titrated with same alkali and alkaline-earth cations as used for the related investigation of 1 earlier. Fig. 8 shows the changes in the absorption spectra of 2 upon addition of 0.1 mM–0.5 M concentrations of Na+, with a λmax at 485 nm which was shifted to 380 nm, and an isosbestic point at 410 nm upon addition of Na+. Much smaller changes were observed at shorter wavelength ca. 290–300 nm. As for the pH titration, these changes can be assigned to the interaction of the Na+ with the nitrogen moiety of the crown ether. In the case of Ca2+ and Li+, the absorption changes were similar to those seen for the addition of Na+
with the ion receptor. The λmax band at 485 nm decreased in intensity, without being substantially shifted to shorter wavelength, upon addition of Ca2+, and an isosbestic point at 400 nm and a new band at 360 nm were formed. The effect of Li+ was much smaller compared to that seen for Na+, with an isosbestic point at 400 nm. The addition of K+ showed substantially different behaviour, Fig. 9, with the 485 nm band shifted to shorter wavelength without the formation of a clear isosbestic point in the 400–440 nm region. In the case of Mg2+ the changes were only minimal compared to the above with a decrease of ca. 10% in the 485 nm band upon titration.
 |
| | Fig. 8 Changes in the absorption spectra of 2 upon addition of sodium acetate in 50 ∶ 50 H2O–MeOH solution. | |
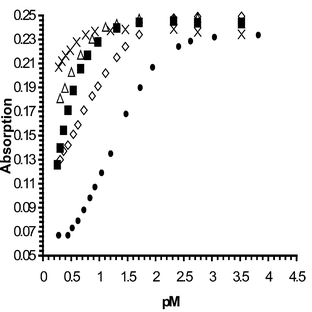 |
| | Fig. 9 Absorption vs. pM profile for 2. M = Na (●); Li+ (◇); Ca2+(■); Mg2+ (△); K+ (×) when measured at 485 nm. | |
The binding affinity of 2 was evaluated from the changes in the absorption spectra as shown earlier, Fig. 9. From these changes a log β of 1.25 (±0.05) was observed for the Na+ complexation, which showed sigmoidal behaviour and changes over 2 pNa units, typically seen for simple equilibrium and 1 ∶ 1 binding. From Fig. 9, one can estimate that log β is ca. 0.5 and 0.3 for Li+ and Ca2+, respectively, however it was not possible to measure these accurately. For Mg2+ and K+ binding, the induced spectral changes were too small for accurate binding determination.
From these changes one can conclude that sensor 2 shows sufficient selectivity for Na+ over any of the other ions tested for, and that accurate coulometric determination of Na+ in the range 3–160 mM is quite feasible even in the presence of high concentrations of K+ and Ca2+. Such determination fits well within the range of Na+ in blood and serum, which as previously mentioned has an upper level of 145 mM and a lower level of 133 mM. In contrast, the K+ levels are much smaller. In comparison with 1, these values are much closer to that needed for accurate Na+ determination in blood. 2 has a low binding affinity compared to that of 1 which is due to the presence of the strongly electron withdrawing nitro
group in 2, which will reduce the electron density on the aromatic amine. This causes the electron lone pair of the nitrogen atom to be much less available for binding of cations, a feature not seen in 1 and 3. Similarly, the pKa of 2, which was measured as 3.9, is over one pH unit lower than that of 1 and almost two units lower than was seen for 3, under the same experimental conditions, for the same reason. The aza-dye sensor 2 can thus be considered as a potential Na+-selective sensor for the determination of Na+ in blood serum. With this in mind we carried out pH and Na+ titrations of 2
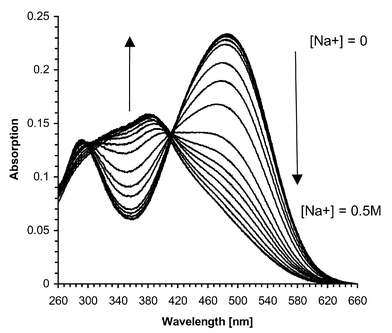
in ca. 100% water (MeOH ∼ 0.5% of total volume) in the presence of 0.1 M TMACl. Under these experimental conditions, the absorption spectra was also blue-shifted compared to that seen previously in 50 ∶ 50 H2O–MeOH solution, with λmax at 474 nm. Upon addition of Na+, the absorption at this wavelength was dramatically reduced, with the formation of a new band at 294 nm and an isosbestic point at 386 nm. From the changes observed in the absorption spectra upon pH titration, the pKa was found to be the same as in 50 ∶ 50 H2O–MeOH solution, but the affinity for Na+ was substantially reduced, and log βNa+ was measured to be 0.8 (±0.05), indicating the difficulties in extracting the ion into the crown ether moiety. The absorption vs. pNa profile showed sigmoidal behaviour and changes over ca.
two pNa units. This range overlaps with the Na+ blood concentration range, but not as ideally as seen in 50 ∶ 50 H2O–MeOH solution. It is thus possible that for such accurate Na+ determination in water, 2 needs to be modified somewhat to push the equilibrium towards this critical region. This can possibly be achieved by having a less electron-withdrawing group on the sensor, which would enable the electron pairs of the amino moiety to be more available for the binding of Na+. However, our earlier attempt to modify the system by replacing the nitro group with other less electron-withdrawing groups, while maintaining the ICT excited state failed (cf. the discussion on the synthesis of 1 and 2 earlier).
The fluorescence emission spectra of 2 was also recorded in 50 ∶ 50 MeOH–H2O solution. Azo-dyes are known to have a low quantum yield of fluorescence since the isomerisation of the N![[double bond, length as m-dash]](https://www.rsc.org/images/entities/char_e001.gif) N bond is forced photochemically.32 Because of this, 2 was not thought to be a particularly good candidate as a fluorescence sensor and the changes in the fluorescence spectra were not expected to be substantial upon Na+ addition. The fluorescence emission spectra of 3 were recorded in acid, base and in the presence of Na+, Fig. 10. In alkaline solution at pH 8, the emission spectra looked broad and rather weak. Unlike that seen in the absorption spectra the wavelength was not shifted upon addition of Na+, but the intensity of the emission at ca.
553 nm was decreased by ca. 60%. However, no attempts were made to quantify the affinity of 2 for Na+ or its pKa by this method, and quantum yields were not recorded.
N bond is forced photochemically.32 Because of this, 2 was not thought to be a particularly good candidate as a fluorescence sensor and the changes in the fluorescence spectra were not expected to be substantial upon Na+ addition. The fluorescence emission spectra of 3 were recorded in acid, base and in the presence of Na+, Fig. 10. In alkaline solution at pH 8, the emission spectra looked broad and rather weak. Unlike that seen in the absorption spectra the wavelength was not shifted upon addition of Na+, but the intensity of the emission at ca.
553 nm was decreased by ca. 60%. However, no attempts were made to quantify the affinity of 2 for Na+ or its pKa by this method, and quantum yields were not recorded.
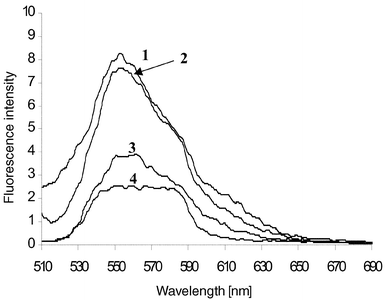 |
| | Fig. 10 The fluorescence emission spectra of 2 when excited at 485 nm in 50 ∶ 50 H2O–MeOH: 1, 2 at pH 2 (HCl); 2, 2 in the presence of tetrabutylammonium hydroxide (TBAOH) and in the presence of 0.3 M Na+; 3, 2 at pH ∼2 (TBAOH); 4, 2 at pH ∼2 (NaOH). | |
X-Ray crystallographic and 1H NMR solution analysis of sensor 2; the possible role of the 2′-methoxy group in the complexation of Na+
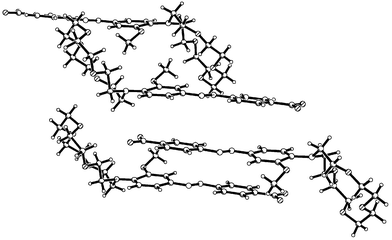
We were interested in trying to elucidate the role of the 2′-methoxy group of 2 in binding various cations, and shed some light on the relationship between solid state and solution properties upon ion binding, a phenomenon which has not been fully examined for sensor–analyte interactions.21,33The sensor 2 is polymorphic, and was crystallised by slow evaporation from methanol solution yielding Form I, 2a, as thin dark red needles. An attempt to crystallise 2·Na from EtOH, CHCl3, or CH3CN solution in the presence of Na+ using PF6−, BF4− or CH3CO2− as counterions gave crystals that were not suitable for crystallographic analysis. Other methods such as diffusion or slow evaporation at 0 °C gave only an off-white powder. We were however, able to isolate, from the sample of an attempted recrystallisation of 2·Na from the CH3CN, PF6− solution, two different coloured crystals: orange needles which correspond to
the protonated form of 2, 2·HPF6, and red needles, which correspond to the second polymorph 2b, Form II of 2. The molecular diagrams and labelling schemes for 2a and 2·HPF6 are illustrated in Figs. 11 and 12, respectively.
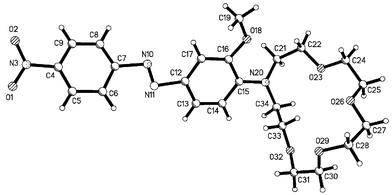 |
| | Fig. 11 X-Ray crystal structure of 2a. | |
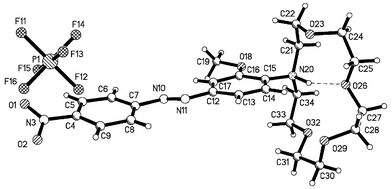 |
| | Fig. 12 X-Ray crystal structure of the protonated form of 2, 2·HPF6. | |
The data for all the compounds discussed were collected by usual methodology‡ and are listed in Table 1. The structure of the sensor 2a, Fig. 11, consists of the crown receptor connected to the chromophore through the nitrogen of the methoxyaniline. The crown ether of 2a was, however, at an angle to the plane of the azobenzene ring with dihedral angles of 75° and −120.7° for C15–N20–C34–C33 and C15–N20–C21–C22, respectively. The compound was found only in its trans conformation, with a dihedral angle of −1.9°
for the N11–N10–C7–C8 and 179.3° for the C6–C7–N10–N11 atoms. The dihedral angle for O18–C16–C15–N20 was measured to be 5.9°, whereas the C21–N20–C15–C16 and C34–N20–C15–C14 angles were measured to be 45° and 10.8°, respectively. These values indicated that the nitrogen lone pair is not fully conjugated with the aromatic π-system. The NO2 group was also found to be coplanar with the azobenzene ring, with a dihedral angle O1–N3–C4–C5 of 1.5°. The packing diagram of 2a, Fig. 13, shows two columns, running anti-parallel to each other, forming an array of tunnels with the crown ether groups stacked along the a axis, and both the aromatic rings involved in extended π–π interactions.
Table 1 Data collection and structure refinement details for 2a, 2b and 2·HPF6
| Empirical formula | C23H30N4O7 | C23H30N3O7 | [C23H31N4O7][PF6] |
|---|
| Reference code | 2a | 2b | 2·HPF6 |
|---|
| M | 474.51 | 474.51 | 620.49 |
| Crystal size/mm | 0.36 × 0.18 × 0.05 | 0.28 × 0.23 × 0.10 | 0.43 × 0.24 × 0.12 |
| Crystal system | Monoclinic | Monoclinic | Monoclinic |
| Space group (Z) | P21/n (4) | P21/c (4) | P21/n (4) |
| a/Å | 7.2110(16) | 14.161(5) | 7.543(4) |
| b/Å | 23.167(6) | 7.521(3) | 25.740(12) |
| c/Å | 14.329(3) | 22.967(9) | 14.221(6) |
| β/° | 97.988(9) | 105.703(8) | 102.167(12) |
| U/Å3 | 2370.5(10) | 2354.9(15) | 2699(2) |
| Dc/g cm−3 | 1.330 | 1.338 | 1.527 |
| F(000) | 1008 | 1008 | 1288 |
| μ(Mo-Kα)/mm−1 | 0.099 | 0.100 | 0.194 |
| ω/gw scans; 2θ range/° | 1.5–50 | 1.5–45 | 1.5–50 |
| Unique reflections | 4134 | 3075 | 4523 |
| wR2 (R1) | 0.1788 (0.0605) | 0.2201 (0.0694) | 0.2227 (0.0671) |
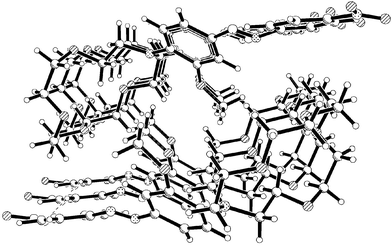 |
| | Fig. 13 Packing diagram for 2a. | |
The structures of 2b and 2·HPF6 are similar to that of 2a in that the azo-dye is essentially planar. The structure of 2·HPF6 is shown in Fig. 12. This coplanarity of the benzene rings allows for the formation of extended π–π interactions, Figs. 14 and 15, and the anions in 2·HPF6 are associated with the azo-moieties via C–H⋯F interactions, Table 2. The differences in the two polymorphs, 2a and 2b are primarily due to the relative orientation of the methoxy
group to the aromatic rings in the azo-dye, and the conformation of the crown receptor with C15–C16–O18–C19 torsion angle of 154° and −163° for 2a and 2b, respectively. This results in different intermolecular interactions between adjacent molecules, Figs. 13 and 14 for 2a and 2b, respectively. In 2b, the compound is associated into dimers, Fig. 14, with both aromatic rings involved in π–π interactions with adjacent dimers, and with the crown receptor exhibiting disorder between two different conformations (76% for the major component) with torsion angles of −163° and 135° for the major and minor conformations C31–C30–O29–C28
and C31–C30′-O29′–C28′ respectively. In 2·HPF6 the amino benzene moiety also forms π–π interactions (3.5–3.7 Å), however, these are now extended such that they form columns along the a axis, Fig. 15. The conformation of the crown moiety is distorted because of a strong N–H⋯O intramolecular hydrogen bond from N20 to O26, Table 2.
Table 2 Hydrogen-bonding and intermolecular-contact geometry for 2·HPF6
| D–H⋯A | r(H⋯A)/Å | r(X⋯A)/Å | ∠(D–H⋯A)/° |
|---|
| Symmetry codes x
− 1, y, z. x
− 1, y, z
+ 1. x,y,z
+ 1. −1/2 +
x, 1 1/2 −
y, 1/2 +
z. 1 −
x, 1 −
y, 2 −
z −1 1/2 +
x, 1 1/2 −
y, 1/2 +
z. |
|---|
| C9–H9A⋯F11a | 2.50 | 3.214(7) | 133 |
| C34–H34B⋯F11b | 2.65 | 3.107(7) | 109 |
| C21–H21B⋯F12c | 2.66 | 3.333(8) | 126 |
| C25–H25B⋯F12d | 2.69 | 3.614(8) | 156 |
| C28–H28B⋯F12d | 2.49 | 3.439(8) | 160 |
| C22–H22A⋯F13c | 2.67 | 3.409(7) | 131 |
| C34–H34B⋯F13b | 2.57 | 3.487(7) | 154 |
| C6–H6A⋯F14e | 2.52 | 3.374(7) | 150 |
| C8–H8A⋯F14a | 2.82 | 3.469(8) | 126 |
| C25–H25B⋯F14d | 2.54 | 3.295(8) | 133 |
| C28–H28A⋯F14f | 2.71 | 3.679(8) | 165 |
| C6–H6A⋯F15e | 2.52 | 3.406(8) | 155 |
| C21–H21B⋯F16c | 2.67 | 3.443(8) | 135 |
| C33–H33B⋯F16b | 2.49 | 3.231(7) | 131 |
| N20–H20⋯O26 | 1.817 | 2.858(7) | 154 |
 |
| | Fig. 14 Packing diagram of Form I of 2·HPF6. | |
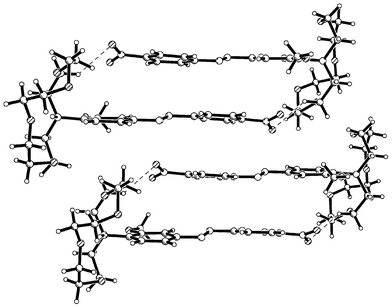 |
| | Fig. 15 Packing diagram of Form II of 2·HPF6. | |
Although we have not been able to show in the solid-state that the methoxy group participates directly in the binding of the Na+, we have strong evidence from solution studies that suggests that it possibly does. The 1H NMR of 2, when recorded in CD3OD, showed a single resonance at 3.93 ppm corresponding to the methoxy group, a triplet at 3.79 ppm, and a multiplet at 3.65 ppm for the crown ether protons. Upon addition of 5 equivalents of NaPF6 to the solution, the methoxy resonance was shifted to higher frequency, appearing at 4.03 ppm, whereas, upon addition of 20 equivalents of the NaPF6 salt the signal was further shifted to 4.10 ppm and the crown ether protons appeared as a set of three multiplets at 3.75, 3.67 and 3.60 ppm and as a singlet at 3.78 ppm, Fig. 16(a). The shift of 0.17 ppm for the methoxy resonance is an indication that the oxygen
atom of the group is participating in the complexation of the ion. The aromatic signals were also affected upon Na+ complexation, Fig. 16(b). In particular, the doublet corresponding to proton adjacent to the amino moiety was shifted substantially, from 7.15 ppm to 7.75 ppm. Other signals were less affected. Similar results were also observed for the bis-methoxy ligand 4.27,34 However, the solid state analysis of 4 showed that upon complexation of Na+, both groups participated in the binding of Na+, forcing the anisidine carbon–nitrogen bond to twist and deconjugate from the crown ether ring, with a dihedral angle of almost 2.2°,27 placing the two methoxy groups above and below the plane of the crown ether. Furthermore, monitoring the changes
in the absorption spectra of 4 upon addition of Na+ revealed a similar effect as seen for the titration of 3 under similar conditions, Fig. 1.27 One can thus draw the conclusion that the 2′-methoxy group in 2 would show similar behaviour upon complexation of Na+, with the exception that the driving force for the deconjugation seen in 4 would be stronger due to the fact that both of the methoxy groups are capable of interacting with the ion, above and below the plane of the crown ether complexed ion. Unfortunately, we are unable to fully quantify the role of the methoxy group in the binding of Na+ at present.
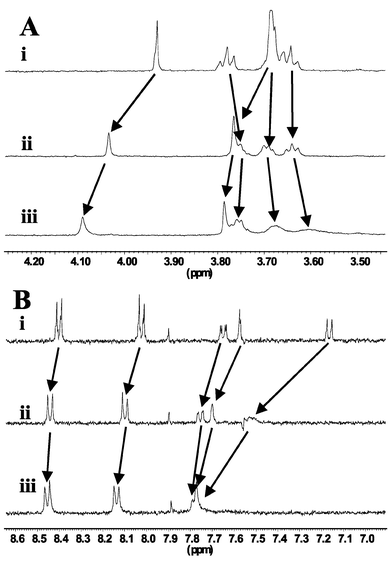 |
| | Fig. 16 1H NMR spectra of 2 (1 mM) in CD3OD, showing the: (A) 2′-methoxy protons, and the crown ether protons; (B) the aromatic protons: (i) without Na+, (ii) with 5 equivalents of NaPF6, (iii) with 20 equivalents of NaPF6. | |
Conclusions
The two chemosensors presented herein show good affinity for Na+ when measured in either 50 ∶ 50 MeOH–H2O or in 100% H2O (as in the case of 2). Our design, based upon the use of 3 as host for selective recognition of Na+, has demonstrated that it is possible to discriminate against other physiologically important ions even at high concentration. In 50 ∶ 50 MeOH–H2O 2 displays excellent affinity for Na+, which overlaps with the Na+ concentration range seen in blood. To the best of our knowledge 2 is the first example of such a system for selective determination of Na+. The PET chemosensor 1 fulfils several important criteria: the sensing
action is only in the form of ‘off-on’ switching (ΦF enhancements), with no other major spectral changes. 2 has a lower affinity for Na+ than that seen for 1 under the same experimental conditions, which can be assigned to the ICT excited state character of 2 which reduces the electron density around the amine part of the receptor, making it less capable of participating in the Na+ binding compared to that seen for 1. Because of this the pKa is also substantially lower than seen for 1 and 3. We have used single X-ray crystallography and 1H NMR to shed some light on the relationship between the solid state and the solution state properties of 2. This investigation indicates that the 2′-methoxy group of the receptor part in 1 and 2, is able to aid the complexation of Na+ and is possibly a major factor in discriminating against K+.In conclusion, the chemosensors 1 and 2 are thus an important contribution to the development of selective, sensitive and fast responding optically based chemosensors for Na+ in blood at physiological pH.
Experimental
Reagents (obtained from Aldrich) and solvents were purified using standard techniques. Solvents were dried over the appropriate drying agent before use: CH3CN and N(CH2CH3)3 over CaH2, THF over Na with benzophenone as an indicator and DMF was used directly from a “Sure-Seal” bottle. The 1H (400.13 MHz) and 13C (100.6 MHz) NMR spectra were recorded on a Bruker DPX 400 spectrometer in d-chloroform unless otherwise stated and chemical shifts were measured in ppm with J values given in Hz. Mass spectra and accurate masses were recorded on a Micromass LCT instrument with methanol as a carrier solvent unless otherwise stated. UV absorption spectra were recorded at 20–25 °C using a UNI-CAM (UV2) spectrometer and on a Shimadzu UV-2401PC. Fluorescence, excitation emission spectra, lanthanide emission spectra, fluorescence quantum yields and lanthanide excited state lifetimes were
obtained using a Perkin Elmer LS50B. Singlet excited state lifetimes were measured using an SPC FL900 Edinburgh Instrument λext. 382 nm with a N2 filled lamp. All spectra were measured by excitation at the given wavelength and were corrected for the wavelength dependence of the photomultiplier tube. Throughout the titration experiments, the ligand and complex solution were in the concentration range 5–7 × 10⁻⁵ M. Aliquots of 3 cm3 were taken for absorption and luminescence measurements in standard quartz cuvettes with a 1 cm path length. Determination of pK and log β values was according to a published procedure.35 Melting points were recorded on a Gallencamp melting point apparatus and are uncorrected. IR spectra were measured using a Perkin Elmer FT-IR Paragon 100 spectrometer using KBr pellets. TLC was carried out using Merck Kieselgel 60 F254
or neutral alumina and chromatograms were visualized by means of a UV lamp and I2. Flash column chromatography was carried out using Merck Kieselgel silica 70–230 mesh.Synthesis of chemosensor 1
Gokel's receptor 3 (100 mg, 0.34 mmol) was dissolved in dry DCM (10 ml) to which ZnBr2 (0.076 g, 0.37 mol) was added. The solution was stirred for five minutes and then 9-(bromoethyl)anthracene (0.084 g, 0.34 mmol) was added slowly to the solution over a period of a few minutes. The resulting mixture was refluxed for 48 h after which it was cooled to room temperature and washed with a 1 M EDTA solution (2 × 15 ml), once with HCl (1 M, 20 ml) and twice with doubly distilled water (15 ml). The organic layer was dried over anhydrous Mg2SO4 and the solvent removed under reduced pressure to give 1 as an oil that was further purified by column chromatography on neutral aluminium oxide with EtOAc–hexane (1 ∶ 4 v/v) to give 1 as yellow oil in 15% yield (0.026 g, 0.05 mmol). Calculated for C32H38NO5:
516.2750, found for C32H38NO5: 516.2752; 1H NMR (CDCl3): δ 8.44 (s, 1H, Ar-H), 8.28 (m, 2H, Ar-H), 8.05 (m, 2H, Ar-H), 7.48 (m, 4H, Ar-H), 6.91 (d, 1H, J
= 8.0 Hz, Ar-H), 6.72 (s, 1H, Ar-H), 6.58 (d, 1H, J
= 8.0 Hz, Ar-H), 4.97 (s, 2H, Ar-CH2-Ar), 3.65 (m, 19H), 3.40 (t, 4H, J
= 6.0 Hz, -O-CH2-CH2-O-); 13C NMR (CDCl3): δ 131.2, 130.1, 128.6, 125.9, 125.3, 124.8, 124.5, 124.4, 124.2, 119.8, 111.5, 70.5, 70.1, 69.8, 69.7, 54.8 (-O-CH3), 32.7 (Ar-CH2-Ar); MS (m/z, EtOH): 516.329 (M + 1, 100%); IR (KBr, cm−1): 3055, 2985, 2927, 2870, 1508, 1446, 1421, 1265, 1122, 739, 706.Synthesis of chemosensor 2
NaNO2 (0.031 g, 0.44 mmol) was added slowly to a mixture of 12 M hydrochloric acid (0.132 ml) and p-aniline (0.062 g, 0.44 mmol) in water–THF (1 ∶ 1 v/v, 10 ml) at 0 °C. This suspension was stirred for a further 20 minutes at 0 °C. The resulting solution was then added dropwise at 0 °C to a solution of 24 (0.145 g, 0.44 mmol) in water–THF (1 ∶ 1 v/v, 10 ml). The mixture was allowed to warm to room temperature and stirred for further 12 hours at room temperature. The THF solvent was removed under reduced pressure and the solution redissolved in CHCl3, and washed with water. The crude mixture was purified by column chromatography on neutral aluminium oxide with EtOAc–hexane (1 ∶ 3 v/v) to give red crystals of 2 in 50% yield (0.105 g, 0.22 mmol). Calculated for C23H31N4O7:
475.2193, found for C23H31N4O7: 475.2184; mp 101 °C; 1H NMR (CDCl3): δ 8.35 (d, 2H, J
= 8.5 Hz, Ar), 7.96 (d, 2H, J
= 9.0 Hz, Ar), 7.64 (dd, 1H, J
= 2 Hz and J
= 8.5 Hz, Ar), 7.48 (d, 1H, J
= 2.0 Hz, Ar), 7.07 (d, 1H, J
= 8.5 Hz, Ar), 3.91 (s, 3H, O–CH3), 3.80 (t, 4H, J
= 6.0 Hz, -O-CH2-CH2-O-), 3.68 {m, 16H, [-2(O-CH2-CH2-O)-N-(O-CH2-CH2-O)2-]}; 13C NMR (CDCl3): δ 124.6, 122.9, 122.7, 116.6, 102.8, 70.6 (CH2), 70.0 (CH2), 69.9 (CH2), 69.6 (CH2), 55.5 (O-CH3); MS (m/z, CH3CN): 475.5 (M + 1, 100%), 497.5 (M + Na+, 60%);
IR (KBr, cm−1): 2923, 2860, 1730, 1587, 1512, 1454, 1375, 1338, 1248, 1103, 864.Crystallography
Crystal data‡ were collected using a Bruker SMART diffractometer with graphite monochromated Mo-Kα radiation at ca. 150 K in a dinitrogen stream. Crystal stabilities were checked and there were no significant variations (< ±1%). ω/ϕ scans were employed for data collection and Lorentz and polarisation corrections were applied. The structures were solved by direct methods and the non-hydrogen atoms were refined with anisotropic thermal parameters. Hydrogen-atom positions were added at idealised positions. A riding model with fixed thermal parameters [Uij
= 1.2Ueq for the atom to which they are bonded (1.5 for Me)], was used for subsequent refinements. The function minimised was Σ[ω(|Fo|2
−
|Fc|2)] with reflection weights ω−1
=
[σ2|Fo|2
+ (g1P)2
+ (g2P)] where P
= [max|Fo|2
+ 2|Fc|2]/3. The SAINT-NT336 and SHELXTL37 program packages were used for data reduction and structure solution and refinement.Acknowledgements
This work was supported by the Department of Chemistry, Trinity College Dublin and Ecole Nationale Supérieure de Chimie de Lille and the European Commission through the SOCRATES and Interreg Programme. We thank Professor John M. Kelly (TCD) for his support, and Dr. Hazel M. Moncrieff for valuable discussion, and Dr. John E. O'Brien for running the NMR spectra.References
- U. S. Spichiger-Keller, Chemical Sensors and Biosensors for Medical and Biological Applications, Wiley-VCH, Weinheim, Germany, 1998 Search PubMed; Chemosensors of Ion and Molecule Recognition, eds. J.-P. Desvergne and A. W. Czarnik, NATO ASI Series, Kluwer Academic Publishers, Dordrecht, The Netherlands, 1996 Search PubMed; Fluorescent Chemosensors for Ion and Molecular Recognition, ed. A. W. Czarnik, ACS Symp. Ser. 538, American Chemical Society, Washington DC, 1993 Search PubMed.
- E. Wang, L. Zhu, L. Ma and M. Patel, Anal. Chem. Acta., 1997, 357, 85 Search PubMed; L. Cazaux, M. Faher, A. Lopez, C. Picard and R. Tisnes, J. Photochem. Photobiol. A, 1994, 77, 217 Search PubMed; S. Misumi, Pure Appl. Chem., 1990, 62, 493 CAS.
- S. Nishizawa, M. Watanabe, T. Uchida and N. Teramae, J. Chem. Soc., Perkin Trans. 2, 1999, 141 RSC; A. P. de Silva, H. Q. N. Gunaratne, T. Gunnlaugsson and P. L. M. Lynch, New J. Chem., 1996, 20, 871 Search PubMed; S. R. Adams, A. T. Harootunian, Y. J. Buechler, S. S. Taylor and R. Y. Tsien, Nature
(London), 1991, 349, 694 CrossRef CAS; G. Grynkiewicz, M. Poenie and R. Y. Tsien, J. Biol. Chem., 1985, 290, 3440; J. Bourson, J. Pouget and B. Valeur, J. Phys. Chem., 1993, 97, 4552 CrossRef CAS; P. Marsau, A. Andrianatoandro, T. Williams, J.-P. Desvergne, H. Bouas-Laurent, H. Hopt and R. Utermöhlen, Chem. Ber., 1993, 126, 1441 CAS.
- A. P. de Silva, D. B. Fox, T. S. Moody and S. M. Weir, Trends Biotechnol., 2001, 21, 29 CrossRef; A. P. de Silva, D. B. Fox, A. J. M. Huxley and T. S. Moody, Coord.
Chem. Rev., 2000, 205, 41 CrossRef CAS; A. P. de Silva, H. Q. N. Gunaratne, T. Gunnlaugsson, A. J. M. Huxley, C. P. McCoy, J. T. Rademacher and T. E. Rice, Chem. Rev., 1997, 97, 1515 CrossRef; R. A. Bissell, A. P. de Silva, H. Q. N. Gunaratne, P. L. M. Lynch, G. E. M. Maguire, C. P. McCoy and K. R. A. S. Sandanayake, Top. Curr. Chem., 223, 168, 1993 Search PubMed; R. A. Bissell, A. P. de Silva, H. Q. N. Gunaratne, P. L. M. Lynch, G. E. M. Maguire and K. R. A. S. Sandanayake, Chem. Soc. Rev., 1992, 21, 187 RSC.
- A. Tahri, E. Cielen, K. J. Van Aken, G. J. Hoornaert, F. C. De Schryver and N. Boens, J. Chem. Soc., Perkin Trans. 2, 1999, 1739 RSC; E. Cielen, A. Tahri, K. Ver Hyden, G. J. Hoornaert, F. C. De Schryver and N. Boens, J. Chem. Soc., Perkin Trans. 2, 1998, 1573 RSC; I. Leray, F. O'Reilly, J.-L. Habib Jiwan, J.-Ph. Soumillion and B. Valeur, Chem. Commun., 1999, 795 RSC.
- J. V. Mello and N. S. Finney, Angew. Chem., Int. Ed., 2001, 40, 1536 CrossRef CAS; W.-S. Xia, R. H. Schmehl and C.-J. Li, Eur. J. Org. Chem., 2000, 387 CrossRef CAS; C. R. Cooper and T. D. James, J. Chem. Soc., Perkin Trans. 1, 2000, 963 RSC; T. Hirano, K. Kikuchi, Y. Urano, T. Higuchi and T. Nagano, Angew. Chem., Int. Ed., 2000, 39, 1052 CrossRef CAS; G. K. Walkup, S. C. Burdette, S. J. Lippard and R. Y. Tsien, J. Am. Chem. Soc., 2000, 122, 5644 CrossRef CAS; W. Wang, G. Sprinsteen, S. Gao and B. Wang, Chem. Commun., 2000, 1283 RSC; P. Grandini, F. Mancin, P. Tecilla, P. Scrimin and U. Tonellato, Angew. Chem., Int. Ed., 1999, 38, 3061 CrossRef; L. Prodi, F. Bolletta, M. Montaliti, N. Zaccheroni, P. B. Savage, J. S. Bradshaw and R. M. Izatt, Tetrahedron Lett., 1998, 39, 5451 CrossRef CAS; G. De Santis, L. Fabbrizzi, M. Licchelli, C. Mangano, D. Sacchi and N. Sardone, Inorg. Chem. Acta, 1997, 257, 69 CrossRef CAS; G. A. Smith, T. R. Hesketh and J. C. Metcalfe, Biochem. J., 1988, 250, 227 CAS.
- A. T. Harootunian, J. P. Y. Kao, B. K. Eckert and R. Y. Tsien, J. Biol. Chem., 1989, 264, 19458 CAS; A. Minta and R. Y. Tsien, J. Biol. Chem., 1989, 264, 19449.
- H. He, M. A. Mortellaro, M. J.
P. Leiner, R. J. Fraatz, Abstract No. 239, 218th ACS National Meeting, New Orleans, LA, August 22–26, 1999.
- A. E. Bruno, S. Barnard, M. Rouilly, A. Waldner, J. Berger and M. Ehrat, Anal. Chem., 1997, 69, 507 CrossRef CAS; O. S. Wolfbeis, I. Klimant, T. Werner, C. Huber, U. Kosch, C. Krause, G. Neurauter and A. Dürkop, Sens. Actuators B, 1998, 51, 17 CrossRef.
- N. J. van der Veen, S. Flink, M. A. Deij, R. J. M. Egberink, F. C. J. M. van Veggel and D. N. Reinhoudt, J. Am. Chem. Soc., 2000, 122, 6112 CrossRef CAS.
- A. P. de Silva, H. Q. N. Gunaratne and C. P. McCoy, Nature (London), 1993, 364, 42 CrossRef; A. P. de Silva, H. Q. N. Gunaratne, T. E. Rice and S. Stewart, Chem. Commun., 1997, 1891 RSC; A. P. de Silva and H. Q. N. Gunaratne, J. Chem. Soc., Chem. Commun., 1990, 186 RSC; A. P. de Silva, H. Q. N. Gunaratne, A. T. M. Kane and G. E. M. Maguire, Chem. Lett., 1995, 125; A. P. de Silva, H. Q. N. Gunaratne and G. E. M. Maguire, J. Chem. Soc., Chem. Commun., 1994, 1213 RSC; D. Parker and J. A. G. Williams, J. Chem. Soc., Perkin Trans. 2, 1995, 1305 RSC.
- H. Kijima, M. Takeuchi, A. Robertson, S. Shinkai, C. Copper and T. D. James, Chem. Commun., 1999, 2011 RSC.
- L. Fabbrizzi, I. Faravelli, G. Francese, M. Licchelli, A. Perotti and A. Taglietti, Chem. Commun., 1998, 971 RSC; C. R. Cooper, N. Spencer and T. D. James, Chem. Commun., 1998, 1365 RSC; L. Fabbrizzi, G. Francese, M. Licchelli, A. Perotti and A. Taglietti, Chem. Commun., 1997, 581 RSC.
- T. D. James, H. Shinnoni and S. Shinkai, Chem. Commun., 1997, 71 RSC; T. D. James, K. R.
A. S. Sandanayake and S. Shinkai, Nature (London), 1995, 374, 6520 CrossRef; A. P. de Silva, H. Q. N. Gunaratne and T. Gunnlaugsson, Tetrahedron Lett., 1998, 39, 5077 CrossRef CAS; C. A. Hunter and R. J. Shannon, Chem. Commun., 1996, 1361 RSC.
- L. Fabbrizzi, M. Licchelli, G. Rabaioli, A. F. Taglietti, M. A. Pina and E. Bernardo, Coord. Chem. Rev., 2000, 205, 85 CrossRef CAS; F. Pina, M. A. Bernardo and E. García-España, Eur. J. Inorg. Chem., 2000, 2143 CrossRef CAS; V. Amendola, L. Fabbrizzi, M. Licchelli, C. Mangano, P. Pallavicini, L. Prodi and A. Poggi, Coord. Chem. Rev., 1999, 192, 649 CrossRef; L. Fabbrizzi, M. Licchelli and P. Pallavicini, Acc. Chem. Res., 1999, 32, 846 CrossRef CAS; B. Valeur and E. Bardez, Chem. Br., 1995, 216 Search PubMed; K. R. A. S. Sandanayake, T. D. James and S. Shinkai, Pure Appl. Chem., 1996, 68, 281; L. Fabbrizzi and A. Poggi, Chem. Soc. Rev., 1995, 24, 197 RSC; A. W. Czarnik, Acc. Chem. Res., 1994, 27, 302 CrossRef CAS.
- P. Buhlmann, E. Pretsch and E. Bakker, Chem. Rev., 1998, 98, 1593 CrossRef; E. Bakker, P. Buhlmann and E. Pretsch, Chem. Rev., 1997, 97, 3083 CrossRef CAS.
- D. Merchant, P. J. Scully, R. Edwards and J. A. Grabowski, Sens. Actuators B, 1998, 48, 476 CrossRef; J. Bromberg, S. Zilberstein, S. Riesemberg, E. Benori, E. Silberstein, J. Zimnavoda, G. Frishman and A. Kritzman, Sens. Actuators B, 1996, 31, 181 CrossRef.
- S. Flink, F. C. J. M. van Veggel and D. N. Reinhoudt, Chem. Commun., 1999, 2229 RSC.
- T. Gunnlaugsson and D. Parker, Chem. Commun., 1998, 511 RSC; O. Reany, T. Gunnlaugsson and D. Parker, Chem. Commun., 2000, 473 RSC; O. Reany, T. Gunnlaugsson and D. Parker, J. Chem. Soc., Perkin Trans. 2, 2000, 1819 RSC.
- T. Gunnlaugsson, D. A. MacDónaill and D. Parker, Chem. Commun., 2000, 93 RSC.
- We have recently reported a preliminary account of part of this work: T. Gunnlaugsson, M. Nieuwenhuyzen, L. Richard and V. Thoss, Tetrahedron Lett., 2001, 42, 4725 Search PubMed.
- R. A. Schultz, B. D. White, K. A. Dishong, W. Arnold and G. W. Gokel, J. Am. Chem. Soc., 1985, 107, 6659 CrossRef CAS.
- Examples of chemosensors for alkali and alkaline-earth metal ions based upon changes in the absorption wavelength include: B. Pipoosananakaton, M. Sukwattanasinitt, N. Jaiboon, N. Chaichit and T. Tuntulani, Tetrahedron Lett., 2000, 41, 9095 Search PubMed; E. Luboch, J. F. Biernat, Y. A. Simonov and A. A. Dvorkin, Tetrahedron, 1999, 54, 4977 CrossRef CAS; U. Oguz and E. U. Akkaya, Tetrahedron Lett., 1997, 38, 4509 CrossRef CAS; G. Sauve, P. V. Kamat, K. G. Thomas, K. J. Thomas, S. Das and M. V. George, J. Phys. Chem., 1996, 100, 2117 CrossRef CAS; M. Mitewa, N. Mateeva, L. Antonov and T. Deligeorgiev, Dyes Pigments, 1995, 27, 219 CrossRef CAS; H. Li, Z. Yao, R. Liu, G. Tan and X. Yu, Chem. Lett., 1998, 1205 Search PubMed; H. Sakamoto, H. Goto, M. Yokoshima, M. Dobashi, J. Ishikawa, K. Doi and M. Otomo, Bull. Chem. Soc. Jpn., 1993, 66, 2907 CrossRef CAS; J. van Gent, E. J. R. Sudhölter, P. V. Lambeck, T. J. A. Popma, G. J. Gerritsma and D. N. Reinhoudt, J. Chem. Soc., Chem. Commun., 1988, 893 CAS.
- We note that during the development of 1 and 2 that the receptor 3 was incorporated into a 1,8-naphthalimide chromophore as a possible Na+ sensor: reference 8. This system emits in the green part of the electronic magnetic spectrum, which in some ways makes the signal purer since light scattering from the physiological environment is partially overcome.
- Several other alkylating methods were unsuccessful, such as the use of AlCl3, ZnCl2
or PdCl2 in DCM, CHCl3 or CH3CN.
- J. P. Dix and F. Vögtle, Chem. Ber., 1980, 113, 457 Search PubMed; H. G. Lohr and F. Vögtle, Acc. Chem. Res., 1985, 18, 65 CrossRef; J. P. Dix and F. Vögtle, Angew. Chem., Int. Ed. Engl., 1978, 17, 857 CrossRef.
- A. P. de Silva, H.
Q. N. Gunaratne, T. Gunnlaugsson and M. Nieuwenhuyzen, Chem. Commun., 1996, 1967 RSC.
- Fluorescence quantum yields were determined using quinine sulfate in aqueous H2SO4 as standard (Φ
= 0.546): J. C. Penedo, M. Mosquera and F. Rodriguez-Prieto, J. Phys. Chem. A., 2000, 104, 7429 Search PubMed.
- When the ΦF was measured in base, and in the presence of 15-crown-5, it was found to be 0.015 (± 0.005).
- R. A. Bissell, A. J. Bryan, A. P. de Silva and C. P. McCoy, J. Chem. Soc., Chem. Commun., 1994, 405 RSC.
- S. Delmond, J.-F. Letrad, R. Lapouyade, R. Mathevet, G. Jonusauskas and C. Rulliere, New. J. Chem., 1996, 20, 861 CAS.
- K. Kumura, Coord. Chem. Rev., 1996, 41, 148.
- S. L. De Wall, E. S. Meadows, L. J. Barbour and G. W. Gokel, Chem. Commun., 1999, 1553 RSC; E. S. Meadows, S. L. De Wall, L. J. Barbour and G. W. Gokel, Chem. Commun., 1999, 1555 RSC; J.-P. Desvergne, J. Lauret, H. Bouas-Laurent, P. Marsau, N. Lahrahar, H. Andrianatoandro and M. Cotrait, Recl. Trav. Chim. Pays-Bas, 1995, 114, 504 Search PubMed; J.-P. Desvergne, F. Fages, H. Bouas-Laurent and P. Masau, Pure Appl. Chem., 1992, 64, 1231 CAS; S. A. Jonker, J. W. Verhoeven, C.
A. Reiss, K. Goubitz and D. Heijdenrijk, Recl. Trav. Chim. Pays-Bas, 1990, 109, 154 Search PubMed.
- A. P. de Silva, H. Q. N. Gunaratne and T. Gunnlaugsson, unpublished results.
- K. A. Connors, Binding Constants, John Wiley & Sons, New York, 1st edn., 1987 Search PubMed.
- SAINT-NT, Bruker AXS, Madison, Wisconsin, 1998 Search PubMed.
- G. M. Sheldrick, University of Göttingen, Göttingen, Germany, 1998.
Footnotes |
| † Typically a solution of the sensor was made up with an absorbance of 0.1 (∼1 × 10⁻⁵ M) in the appropriate solvent systems containing the ionic strength. pH titrations were carried out by adjusting the pH of the above solution (10–20 ml) to a high alkaline value (tetrabutylammonium hydroxide or KOH) and aliquots of acid (HCl or TFA) were added. These measurements were repeated in
the presence of 0.01 M Tris buffer. The titration using groups I and II alkali metals was carried out on 10 ml or 20 ml samples, after adjustment of the pH to 7.4, aliquots (μl) of 3 M or 4 M stock solutions were added. The absorption and the fluorescence spectra were corrected for volume dilution. |
| ‡ CCDC reference numbers 166867, 166865 and 166866. See http://www.rsc.org/suppdata/p2/b1/b106474f/ for crystallographic files in .cif or other electronic format. |
|
| This journal is © The Royal Society of Chemistry 2002 |
Click here to see how this site uses Cookies. View our privacy policy here.