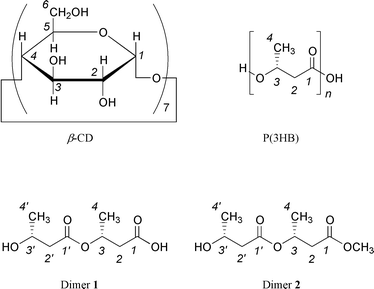
Formation of inclusion complexes between dimers of (R)-3-hydroxybutanoic acid and β-cyclodextrin: thermodynamic study of the complexation and conformational analysis of the complexed dimers
Received
(in Cambridge, UK)
6th June 2001
, Accepted 17th October 2001
First published on 28th November 2001
Abstract
The formation of inclusion complexes of di[(R)-3-hydroxybutanoate] (Dimer 1) and the methyl ester of di[(R)-3-hydroxybutanoate] (Dimer 2) with β-cyclodextrin (β-CD) was studied by NMR spectroscopy. The stoichiometry of the complexation was 1 ∶ 1 (host ∶ guest). Thermodynamic analysis revealed that the complex formation is enthalpically favorable, but entropically unfavorable. Dimer 1 forms hydrogen bonds with β-CD more frequently than Dimer 2 because 1 has two hydroxy groups. Conformational analysis of the 3HB (3-hydroxybutanoate) dimers in the complexes indicates that they have extended (trans) forms. In contrast, in solution without β-CD, the end of both Dimers 1 and 2 takes a sickle (gauche) shape due to formation of intermolecular hydrogen bonds.
Introduction
Poly[(R)-3-hydroxybutanoate] [P(3HB)] is an optically active biopolyester synthesized as a storage material for carbon and energy in many prokaryotic microorganisms.1,2 Besides storage properties, a trace of narrow-disperse low-molecular-weight P(3HB) of physiological significance was found in a variety of prokaryotic and eukaryotic organisms,3,4 and even in human blood plasma.5 Low-molecular-weight P(3HB) always appears to be complexed with other specific large molecules.6 Although the mechanism is still not clear, there is no doubt that molecular recognition plays an important role in the physiological processes involving P(3HB).3c
Oligomers of 3HB have attracted much attention in terms of their synthesis, structures, and functions.7–9 We recently studied conformational structures of dimers and some oligomers of 3HB in solution, and showed that the monomer unit adjacent to the terminal hydroxy group has a different conformational distribution due to intramolecular hydrogen bonding between the hydroxy and carbonyl groups.10
Cyclodextrins (CDs) are a series of doughnut-shaped cyclic oligosaccharides composed of 6, 7, and 8 D-(+)-glucose units linked by α-1,4-linkages, and named α-, β-, and γ-CD, respectively. Their hydrophobic cavities are able to bind various molecules to form inclusion complexes.11 They have been extensively studied as models to mimic enzyme activity and to provide understanding of the mechanism of molecular recognition.11,12 In a previous paper,13 we reported that di[(R)-3-hydroxybutanoate] (Dimer 1) selectively forms an inclusion complex with β-CD in aqueous solution, and carried out a thermodynamic analysis of the complex formation. The methyl ester of di[(R)-3-hydroxybutanoate] (Dimer 2) was synthesized as another model compound of P(3HB).
We have also found an inclusion complex between Dimer 2 and β-CD in aqueous solution. It is of great interest to learn how the complexation affects the conformations of the guest molecules. In this paper, we report the conformational analysis of Dimer 1 and Dimer 2 in the β-CD complexes, and compare the conformational structures of the 3HB dimers in the complexes with those of free 3HB dimers in solution. The thermodynamic analysis of Dimer 2–β-CD complexation is also reported and compared with that of complexation of Dimer 1. Fig. 1 shows the chemical structures of β-CD, P(3HB), Dimer 1, and Dimer 2.
 |
| | Fig. 1 The chemical structures of β-CD, P(3HB), Dimer 1, and Dimer 2. | |
Results and discussion
Complex formation between Dimer 2 and β-CD
Upon addition of β-CD to a D2O solution of Dimer 2, 1H and 13C NMR spectra of Dimer 2 were found to show changes in chemical shift and/or in resonance pattern. Fig. 2 shows 1H NMR spectra of Dimer 2 in the absence and the presence of various amounts of β-CD in D2O solution. Upon addition of β-CD, resonances of H2, H3, and H3′ of Dimer 2 show a marked shift to higher magnetic fields, while those of H4 and –OCH3 shift downfield, and resonance patterns of H2 and H2′ show marked changes. On the other hand, upon addition of α-CD or γ-CD to a D2O solution of Dimer 2, both 1H and 13C NMR spectra of Dimer 2 were found not to show marked changes in chemical shift or in resonance pattern. The results indicate that Dimer 2 selectively forms a complex with β-CD in aqueous solution, the cavity size of which is a fit for the dimers of 3HB. As we reported in a previous paper,13 monomeric 3HB does not form inclusion complexes with α-, β-, or γ-CD at all. Therefore, the complex formation between Dimer 2 and β-CD is of high selectivity, and the size fitting between the dimers of 3HB and β-CD plays an important role in the inclusion complexation.
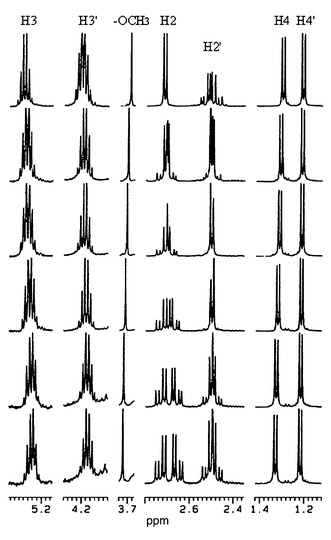 |
| | Fig. 2 500-MHz 1H NMR spectra of Dimer 2 in the absence and the presence of β-CD in D2O at 27 °C. The concentrations for β-CD–Dimer 2 are (from top to bottom) 0 ∶ 20.0, 5.0 ∶ 15.0, 6.7 ∶ 13.3, 10.0 ∶ 10.0, 13.3 ∶ 6.7, 15.0 ∶ 5.0 mmol dm−3. | |
Fig. 3 shows the 1H NMR spectra of β-CD in the absence and the presence of Dimer 2 in D2O solution. Upon addition of Dimer 2 to a D2O solution of β-CD, the spectra show marked changes in chemical shift of proton resonances of H-3 and H-5 of β-CD, which are located in the interior of the cavity,11 while the resonances of H-1, H-2, H-4, and H-6, which are located in the exterior of the cavity,11 remain unchanged. The results reveal that Dimer 2 is included in the interior of the β-CD cavity to form an inclusion complex. The 1H NMR spectra of α-CD and γ-CD in the absence and the presence of Dimer 2 were recorded too. Fig. 4
shows a comparison of changes in chemical shift of protons of α-, β-, and γ-CD upon addition of Dimer 2 in D2O solution. Only H-3 and H-5 of β-CD shift markedly upon complexation with Dimer 2. For all protons of α-CD and γ-CD, no marked changes in chemical shift were observed, because Dimer 2 does not form inclusion complexes with α-CD or γ-CD.
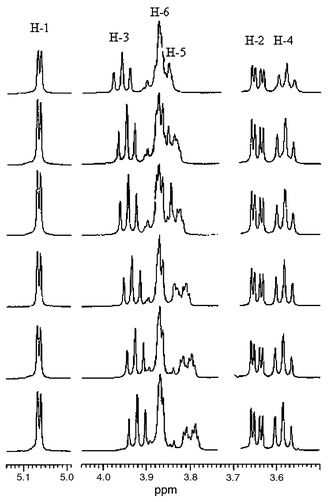 |
| | Fig. 3 500-MHz 1H NMR spectra of β-CD in the absence and the presence of Dimer 2 in D2O at 27 °C. The concentrations for Dimer 2–β-CD are (from top to bottom) 0 ∶ 20.0, 5.0 ∶ 15.0, 6.7 ∶ 13.3, 10.0 ∶ 10.0, 13.3 ∶ 6.7, 15.0 ∶ 5.0 mmol dm−3. | |
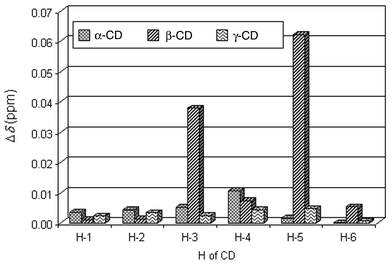 |
| | Fig. 4 Changes in 1H NMR chemical shift for protons of α-, β-, and γ-CD induced by Dimer 2 in D2O at 27 °C. The concentration for Dimer 2–CD is 15.0 ∶ 5.0 mmol dm−3. | |
The stoichiometry of the inclusion complex formation between Dimer 2 and β-CD may be obtained by continuous variation experiments, i.e., recording 1H NMR spectra for solutions where the molar ratio of Dimer 2 and β-CD is varied but the overall molar concentration of the two components is kept constant. Fig. 5 shows the continuous variation plots (Job plots14) for changes in chemical shift of protons of Dimer 2 (a) and β-CD (b). Plots for all protons in Fig. 5 show a maximum at a molar fraction of Dimer 2 or β-CD equal to 0.5, indicating the formation of a 1 ∶ 1 inclusion complex. The stoichiometry is the same as for the complex formation between Dimer 1
and β-CD as we previously reported.13
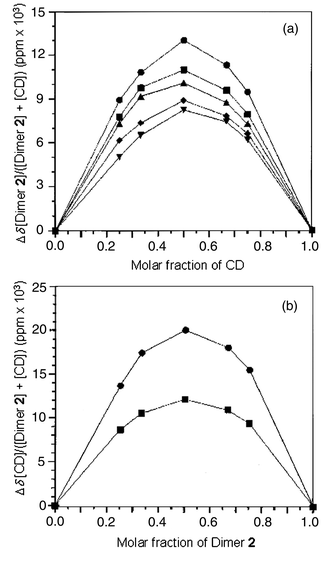 |
| | Fig. 5 Continuous variation plots for Dimer 2–β-CD system in D2O at 27 °C. (a) Job plots for changes in chemical shift of H3 (●), –OCH3 (■), H4 (▲), H2 (◆), and H3′ (▼) of Dimer 2; (b) Job plots for changes in chemical shift of H-5 (●) and H-3 (■) of β-CD. | |
Dissociation constant and thermodynamic parameters
Since Dimer 2 and β-CD form a 1 ∶ 1 inclusion complex, the equilibrium of the complex may be expressed by: | | 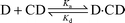 | (1) |
Then, the dissociation constant Kd for the complex formation is given by: where [D] and [CD] are the equilibrium concentrations of Dimer 2 and β-CD, respectively, and [D·CD] is the equilibrium concentration of the complex. For a proton of Dimer 2, the observed chemical shift δ
=
δD
+ ([D·CD]/[D]0)(δD·CD
−
δD),
where [D]0 is the initial concentration of Dimer 2, and δD and δD·CD are the chemical shifts of the proton in pure Dimer 2 and in pure complex, respectively. Therefore, the observed induced chemical shift Δδ is: | | | Δδ
=
δ
−
δD
= ([D·CD]/[D]0)ΔδD·CD | (3) |
where ΔδD·CD
=
δD·CD
−
δD. The following equation then is applicable from eqns. (2) and (3):
| | |
1/Δδ
= 1/ΔδD·CD
+ (Kd/ΔδD·CD)(1/[CD])
| (4) |
If one is working under a condition of initial β-CD concentration [CD]0 in large excess over [D]0, then eqn. (4) becomes:
| | | 1/Δδ
= 1/ΔδD·CD
+ (Kd/ΔδD·CD)(1/[CD]0) | (5) |
This is an analogue of the Benesi–Hildebrand equation.
15 For a series of solutions, a plot of 1/Δ
δ against 1/[CD]
0 should be linear. The intercept with the ordinate yields 1/Δ
δD·CD and from the gradient
Kd/Δ
δD·CD may be obtained.
However, our conditions were only [CD]0 > 5. So we first obtained approximate values of ΔδD·CD and Kd by using eqn. (5). The values were taken to calculate [CD] in the given solutions. Then we estimated new values of ΔδD·CD and Kd by using eqn. (4). These procedures were repeated until new values of ΔδD·CD and Kd were identical to previous ones.16 For our data, the identical values were reached after three repetitions. The dissociation constants Kd at various temperatures between 17 and 45 °C were determined. The temperature dependence of the dissociation constants yields an enthalpy ΔH° of −6.5 kcal mol−l for the
complex formation. The free energy ΔG° and the entropy ΔS° were also calculated. Table 1 summarizes all of the thermodynamic parameters for the complex formation between Dimer 2 and β-CD. For comparison, thermodynamic parameters for complex formation between Dimer 1 and β-CD are also listed in the table. It is clear that the driving force for formation of both complexes is the large favorable enthalpy. It seems that the large favorable enthalpy is due to the contribution of van der Waals forces and hydrogen bonding between the host and the guest molecules, while the unfavorable entropy is due to the loss of conformational and rotational freedom of the dimers and/or conformational freedom of β-CD.17 The changes both in enthalpy and in entropy reveal a tight inclusion and a deep penetration
of the guest molecules within the cavity of β-CD. A key factor which affects the complex formation is the size correspondence between the dimers and the β-CD cavity. Therefore, we can understand why the 3HB dimers do not form complexes with α-CD and γ-CD, whose cavities are too small or too large for the 3HB dimers. Another factor is the capability to form hydrogen bonding between the 3HB dimers and β-CD. The hydroxy end group of both Dimer 1 and Dimer 2 can form hydrogen bonding with β-CD. However, Dimer 1 has another free carboxy end group capable of forming hydrogen bonding with β-CD more efficiently than Dimer 2, whose corresponding end group is a methyl ester. This may be a primary reason that the enthalpy for Dimer 1–β-CD is larger
than that for Dimer 2–β-CD. The decrease in entropy for Dimer 1–β-CD is larger than that for Dimer 2–β-CD, which may result from loss of more rotational freedom of Dimer 1 due to formation of more hydrogen bonding between the guest molecule and β-CD.
Table 1 Thermodynamic parameters for complex formation of 3HB dimers with β-CD in D2O solution at various temperaturesa
| System |
Temperature/°C |
K
d/mol dm−3 |
ΔG°/kcal mol−1 |
ΔH°/kcal mol−1 |
ΔS°/cal mol−1 K−1 |
|
Parameters were determined from 1H NMR titration.
This work. Chemical shift changes of H4 were used for the calculations.
Data from ref. 13.
|
| Dimer 2–β-CDb |
17.0 |
1.07 × 10⁻² |
−2.61 |
−6.5 |
−13.0 |
| |
27.0 |
1.58 × 10⁻² |
−2.46 |
|
|
| |
35.0 |
2.49 × 10⁻² |
−2.25 |
|
|
| |
45.0 |
3.27 × 10⁻² |
−2.15 |
|
|
| Dimer 1–β-CDc |
15.0 |
6.59 × 10⁻³ |
−2.87 |
−10.4 |
−25.6 |
| |
27.0 |
1.06 × 10⁻² |
−2.71 |
|
|
| |
37.0 |
2.56 × 10⁻² |
−2.21 |
|
|
| |
47.0 |
3.69 × 10⁻² |
−2.10 |
|
|
Conformational analysis and structures of complexes
For each monomer unit of a 3HB dimer, there are three possible conformers: trans (T), plus gauche (G), and minus gauche (Ḡ), as shown in Fig. 6. The two monomer units of a 3HB dimer show different conformational behavior due to formation of intramolecular hydrogen bonding and the different polarities of the solvents.10 It is of great interest to analyze the conformations of the 3HB dimers in the complexes and make a comparison of the conformational structures between the complexed and uncomplexed dimers.
 |
| | Fig. 6 Newman projections of possible conformers of 3HB dimers for C2–C3 bond (a) and C2′–C3′ bond (b). | |
As described in previous papers,10,18 the distribution of conformers around the CH2–CH bonds of a 3HB unit in solution can be determined by means of 1H NMR spectroscopy. The methylene proton resonances are associated with the methine proton (HX) and are analyzed as an ABX three-spin system with a vicinal coupling of HA and HB protons. Then, the coupling constants JAX and JBX are presented by average values of the component coupling constants in the three conformers weighted by their fractional populations PT, PG, and PḠ, as follows:
| | | JAX
=
PTJt
+
PGJg
+
PḠJg | (6) |
| | | JBX
=
PTJg
+
PGJt
+
PḠJg | (7) |
where
Jg and
Jt are the
gauche and
trans vicinal coupling constants, respectively. Assuming the reasonable values of
Jg
= 2.1 Hz and
Jt
= 11.0 Hz,
19 we can calculate the fractional populations
PT,
PG, and
PḠ for the CH
2–CH bonds under various conditions.
Table 2 summarizes the coupling constants of methylene protons and conformer distributions of CH2–CH bonds in 3HB dimers in D2O solution obtained from the 1H NMR spectra of 3HB dimers in solution and in β-CD complexes. For the C2–C3 bond of both free 3HB dimers in D2O solution, predominant conformers are trans and plus gauche, while the minus gauche conformer is strongly disfavored. This is in accordance with the steric energies of the trans and plus gauche conformers being much lower than that of the minus gauche conformer for both 3HB dimers, because the carbonyl oxygen receives van der Waals repulsion from only one of either –CH3 or –OR groups in the trans and plus gauche conformers, but from both –CH3 and –OR groups in the minus gauche conformer.
For the C2–C3 bond of both 3HB dimers in β-CD complexes, the most preferred conformer becomes trans, while the plus gauche conformer becomes the next preferred. The conformational distribution is more like the case in a non-polar organic solvent.10 The results indicate that the complexed 3HB dimers are in a different environment from that formed by D2O solvent, where the dimers have less chance to interact with the aqueous molecules.
Table 2 Coupling constants of methylene protons (H2 and H2′) in 500-MHz 1H NMR spectra and conformer distributions of CH2–CH bonds of 3HB dimers in D2O solution in the absence and the presence of β-CD at 27 °C
| |
|
|
Coupling constant/Hz |
Conformer fraction |
| System |
Bond |
Probe H |
J
AX
|
J
BX
|
P
T
|
P
G
|
P
Ḡ
|
|
[Dimer 1] = 5.0 mmol dm−3.
[Dimer 1] = 5.0 mmol dm−3; [β-CD] = 15.0 mmol dm−3.
[Dimer 2] = 5.0 mmol dm−3.
[Dimer 2] = 5.0 mmol dm−3; [β-CD] = 15.0 mmol dm−3.
|
| Dimer 1a |
C2–C3 |
H2 |
6.6 |
6.6 |
0.50 |
0.50 |
0.00 |
| |
C2′–C3′ |
H2′ |
5.5 |
7.3 |
0.38 |
0.58 |
0.04 |
| Dimer 1–β-CDb |
C2–C3 |
H2 |
7.4 |
6.0 |
0.58 |
0.43 |
0.00 |
| |
C2′–C3′ |
H2′ |
7.4 |
6.0 |
0.58 |
0.43 |
0.00 |
| Dimer 2c |
C2–C3 |
H2 |
6.4 |
6.4 |
0.49 |
0.49 |
0.02 |
| |
C2′–C3′ |
H2′ |
5.2 |
7.8 |
0.35 |
0.64 |
0.00 |
| Dimer 2–β-CDd |
C2–C3 |
H2 |
7.3 |
6.1 |
0.57 |
0.44 |
0.00 |
| |
C2′–C3′ |
H2′ |
7.3 |
5.8 |
0.57 |
0.41 |
0.02 |
For the C2′–C3′ bond of both free 3HB dimers in D2O solution, the predominant conformer is plus gauche, and the next preferred conformer is trans, while the minus gauche conformer is strongly disfavored (Table 2). As described in our previous papers,10 the plus gauche conformer of the C2′–C3′ bond of 3HB dimers in D2O solution is stabilized by the formation of an intramolecular hydrogen bond between the hydroxy end group and the vicinal carbonyl group. However, for the C2′–C3′ bond of both 3HB dimers in β-CD complexes, the most preferred conformer becomes trans, while the plus gauche conformer becomes the next preferred, indicating that the intramolecular hydrogen bond is broken. It seems that the hydroxy end group of the
3HB dimers tends to form hydrogen bonding with β-CD, which contributes to the favorable enthalpy for the complexation, as discussed in a previous section of this paper.
Table 3 summarizes 1H NMR chemical shifts of Dimer 2 in the absence and the presence of β-CD and the chemical shifts for protons of Dimer 2 induced by β-CD in D2O. The induced chemical shifts for H2, H3, and H4 are more marked than those for H2′, H3′, and H4′, respectively, indicating that the 3HB unit with a –COOCH3 end group is more subject to the effect of the inner wall of the cavity of β-CD. A probable explanation of the results is that the 3HB unit with a –COOCH3 end group is included in the narrow side of the β-CD cavity. Such geometry makes the 3HB unit with a –COOCH3 end group closer to the inner wall of the β-CD cavity, and the chemical shifts of protons of the 3HB unit with a –COOCH3 end group are more subject to the effect of β-CD.
Based on the data of 1H NMR induced chemical shifts, and the thermodynamic and conformational analyses, a schematic illustration of a proposed structure of the Dimer 2–β-CD complex is shown in Fig. 7. In the complex, the hydroxy end of Dimer 2 forms hydrogen bonding with one of the secondary hydroxy groups of β-CD.
Table 3
1H NMR chemical shifts of Dimer 2 in the absence and the presence of β-CD and the chemical shifts of Dimer 2 (Δδ) induced by β-CD in D2O at 27 °C
| |
Chemical shift of protons of Dimer 2 (ppm) |
| |
–OCH3 |
H2 |
H2′ |
H3 |
H3′ |
H4 |
H4′ |
|
[Dimer 2] = 5.0 mmol dm−3.
[Dimer 2] = 5.0 mmol dm−3; [β-CD] = 15.0 mmol dm−3.
|
| Dimer 2a |
3.690 |
2.717 |
2.507 |
5.281 |
4.196 |
1.299 |
1.209 |
| Dimer 2–β-CDb |
3.722 |
2.691 |
2.495 |
5.243 |
4.172 |
1.328 |
1.217 |
| Δδ |
0.032 |
−0.026 |
−0.012 |
−0.038 |
−0.025 |
0.029 |
0.008 |
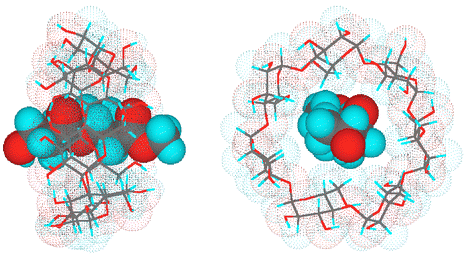 |
| | Fig. 7 Proposed structure of Dimer 2–β-CD complex (left, side view; right, top view). | |
Conclusions
Two 3HB dimers, Dimer 1 and Dimer 2, selectively form inclusion complexes with β-CD in D2O solution, while 3HB monomer does not form any complex with cyclodextrins. The thermodynamic analysis reveals that the complex formation is enthalpically favorable but entropically unfavorable, indicating that the driving forces for the complex formation are van der Waals forces and hydrogen bonding. A comparison of the thermodynamic parameters for complex formation of the two 3HB dimers with β-CD reveals that Dimer 1 may form hydrogen bonding more efficiently than Dimer 2, while the decrease in entropy for Dimer 1–β-CD is larger than that for Dimer 2–β-CD, which may result from loss of more rotational freedom
of Dimer 1 due to formation of more hydrogen bonding between the guest molecule and β-CD. Both the selectivity and the thermodynamic analysis imply that the size correspondence between the guest and host molecules plays an important role in the complex formation.
Conformational analysis of the 3HB dimers in solution and in the complexes indicates that both C2–C3 and C2′–C3′ bonds of the two 3HB dimers in β-CD complexes mainly take trans conformations, which is different from the case of the free 3HB dimers in D2O solution. A 3HB dimer complexed in the cavity of β-CD is in a different environment from that formed by D2O solvent, where the dimer has less chance to interact with the solvent molecules. In D2O solution, an intramolecular hydrogen bond between the hydroxy end group and the oxygen of the adjacent carbonyl group is formed and the C2′–C3′ bond takes mainly the plus gauche conformation for the two 3HB dimers. In the complexes, instead of the intramolecular hydrogen bonding, the hydroxy end group forms hydrogen bonding with β-CD, and the C2′–C3′
bond takes mainly the trans conformation for the two 3HB dimers. It is also concluded that the 3HB unit with a –COOCH3 or –COOH end group is included in the narrow side of the β-CD cavity from an analysis of the 1H NMR induced chemical shifts for respective protons of the 3HB dimers.
Experimental
Materials
α-CD, β-CD, and γ-CD were purchased from Wako Pure Chemical Ind. Ltd. Other chemicals for synthesis were supplied by Aldrich. Deuterium oxide (D2O, 99.95%) was obtained from Merck. Dimer 1 and Dimer 2 were prepared according to the procedures described in our previous papers.10
Dimer 1: 1H NMR δH(500 MHz; CDCl3; DSS) 5.34 (m, 1H, C(3)H), 4.21 (m, 1H, C(3′)H), 2.55–2.69 (m, 2H, C(2)H2), 2.39–2.48 (m, 2H, C(2′)H2), 1.33 (d, J
= 6.4 Hz, 3H, C(4)H3), 1.23 (d, J
= 6.4 Hz, 3H, C(4′)H3). FAB-MS m/z 191.3 (M+
+ l; 100%), 105.6 (57%). Elemental Anal. Found: C, 49.80; H, 7.44%. Calc. for C8H14O5: C 50.52; H, 7.42%.
Dimer 2: 1H NMR δH(500 MHz; CDCl3; DSS) 5.29–5.36 (m, 1H, C(3)H), 4.16–4.22 (m, 1H, C(3′)H), 3.69 (s, 3H, OCH3), 3.05 (s, broad, 1H, OH), 2.51–2.67 (m, 2H, C(2)H2), 2.37–2.48 (m, 2H, C(2′)H2), 1.32 (d, J
= 6.1 Hz, 3H, C(4)H3), 1.23 (d, J
= 6.4 Hz, 3H, C(4′)H3). FAB-MS m/z 205.0 (M+
+ 1; 100%), 119.2 (44%). Elemental Anal. Found: C, 50.83; H, 7.68%. Calc. for C9H16O5·0.4H2O: C, 51.13; H, 8.01%.
Measurements
The 1H and 13C NMR spectra were recorded on a JEOL GX-500 NMR spectrometer at 500 and 125 MHz, respectively. The 1H NMR measurements were carried out with 5.3-s pulse repetition, 5000-Hz spectral width, and 32768 data points. Chemical shifts were referred to DSS (δ
= 0.00 ppm) as external reference in a D2O solution. Mass spectra were obtained on a JEOL JMS-HX 110 mass spectrometer by the fast atom bombardment (FAB) method in positive ion mode with a glycerol matrix, 5.0–10.0 kV acceleration voltage, and 1000 resolution. Mass calibration was carried out with a CsI spectrum.
Continuous variation experiments
The total concentrations of 3HB dimer and β-CD were maintained at 20.0 mmol dm−3 in D2O, while the molar ratios of 3HB dimer and β-CD were varied to be 1 ∶ 0, 3 ∶ 1, 2 ∶ 1, 1 ∶ 1, 1 ∶ 2, 1 ∶ 3, and 0 ∶ 1. The 1H NMR spectra of the samples were recorded at 27 °C. The Job plots14 were drawn based on the induced chemical shifts of protons of 3HB dimer and β-CD, respectively.
Determination of dissociation constant
A series of D2O solutions which include 1.5 mmol dm−3 of 3HB dimer and 0.0, 8.0, 10.0, 12.0, 14.0, and 16.0 mmol dm−3 of β-CD were prepared. The 1H NMR spectra of the solutions were recorded at different temperatures. The dissociation constants and other thermodynamic parameters were estimated from the induced chemical shifts of H4 of Dimer 2. The average chemical shift values for the double peaks of H4 were used.
References
- M. Lemoigne, Bull. Soc. Chim. Biol., 1926, 8, 770 Search PubMed; E. A. Dawes and P. J. Senoir, Adv. Microb. Physiol., 1973, 10, 135 Search PubMed.
-
Y. Doi, Microbial Polyesters, VCH Publisher, New York, 1990 Search PubMed; H.-M. Muller and D. Seebach, Angew. Chem., Int. Ed. Engl., 1993, 32, 447 Search PubMed; Y. Poirer, C. Nawrath and C. Somerville, Bio/Technol., 1995, 13, 142 CrossRef.
-
(a) R. Reusch and H. Sadoff, J. Bacteriol., 1983, 156, 778 CAS;
(b) R. Reusch, T. Hiske and H. Sadoff, J. Bacteriol., 1986, 168, 553 CAS;
(c) R. Reusch and H. Sadoff, Proc. Natl. Acad. Sci. U. S. A., 1988, 85, 4176 CAS;
(d) R. Reusch, Proc. Soc. Exp. Biol. Med., 1989, 191, 377 Search PubMed;
(e) C. E. Castuma, R. Huang, A. Kornberg and R. Reusch, J. Biol. Chem., 1995, 270, 12980 CrossRef CAS;
(f) R. Reusch, R. Huang and L. L. Bramble, Biophys. J., 1995, 69, 754 Search PubMed.
- S. Schulz and S. Toft, Science, 1993, 260, 1635 CAS.
- R. Reusch, A. Sparrow and J. Gardiner, Biochim. Biophys. Acta, 1992, 33, 1123.
- R. Reusch, FEMS Microbiol. Rev., 1992, 103, 119 CAS.
- D. Seebach, G. F. Herrmann, U. D. Lengweiler and W. Amrein, Helv. Chim. Acta, 1997, 80, 989 CrossRef CAS; D. Seebach and M. G. Fritz, Int. J. Biol. Macromol., 1999, 25, 217 CrossRef CAS; D. Seebach, A. K. Beck, M. Rueping, J. V. Schreiber and H. Sellner, Chimia, 2001, 55, 98 Search PubMed.
- I. Olsen, J. M. Merrick and I. J. Goldstein, Biochemistry, 1965, 4, 453 CrossRef CAS; T. Tanino, T. Fukui, Y. Shirakura, T. Saito, K. Tomita, T. Kaiho and S. Masamune, Eur. J. Biochem., 1982, 124, 71; Y. Shirakura, T. Fukui, T. Saito, Y. Okamoto, T. Narikawa, K. Koide, K. Tornita, T. Takemasa and S. Masamune, Biochem. Biophys. Acta, 1986, 880, 46 Search PubMed; T. Hiraishi, T. Ohura, S. Ito, K. Kasuya and Y. Doi, Biomacromolecules, 2000, 1, 320 CrossRef CAS.
- D. Seebach, U. Brandli, P. Schnurrenberger and M. Przybylski, Helv. Chim. Acta, 1988, 71, 155 CrossRef CAS; D. A. Plattner, A. Brunner, M. Dobler, H.-M. Muller, W. Petter, P. Zbinden and D. Seebach, Helv. Chim. Acta, 1993, 76, 2004 CrossRef CAS; H. M. Burger and D. Seebach, Helv. Chim. Acta, 1993, 76, 2570 CrossRef; D. Seebach, H. M. Burger, H. M. Muller, U. D. Lengweiler, A. K. Beck, K. E. Sykes, P. A. Barker and P. J. Barham, Helv. Chim. Acta, 1994, 77, 1099 CrossRef CAS; D. Seebach, A. Brunner, H. M. Burger, R. N. Reusch and L. L. Bramble, Helv. Chim. Acta, 1996, 79, 507 CrossRef CAS.
- J. Li, J. Uzawa and Y. Doi, Bull. Chem. Soc. Jpn., 1997, 70, 1887 CAS; J. Li, J. Uzawa and Y. Doi, Bull. Chem. Soc. Jpn., 1998, 71, 1683 CAS.
-
M. L. Bender and M. Komiyama, Cyclodextrin Chemistry, Springer-Verlag, Berlin, 1978 Search PubMed; W. Saenger, Angew. Chem., Int. Ed. Engl., 1980, 19, 344 Search PubMed;
J. Szejtli, Cyclodextrins and Their Inclusion Complexes, Akademiai Kiado, Budapest, 1982 CrossRef.
- G. Wenz, Angew.
Chem., Int. Ed. Engl., 1994, 33, 803 CrossRef; J. Li, A. Harada and M. Kamachi, Bull. Chem. Soc. Jpn., 1994, 67, 2808 CAS.
- J. Li, J. Uzawa and Y. Doi, Bull. Chem. Soc. Jpn., 1998, 71, 1953 CAS.
- P. Job, Ann. Chem. Phys., 1928, 9, 113 Search PubMed.
- H. A. Benesi and J. H. Hildebrand, J. Am. Chem. Soc., 1949, 71, 2703 CrossRef CAS.
- R. P. Lang, J. Am. Chem. Soc., 1962, 84, 1185 CrossRef CAS.
- R. J. Bergeron, D. M. Pillor, G. Gibeily and W. P. Roberts, Bioorg. Biochem., 1978, 7, 263 Search PubMed; T. Nakajima, M. Sunagawa, T. Hirohashi and K. Fujioka, Chem. Pharm. Bull., 1984, 32, 383 Search PubMed; Z. P. Yi, H. L. Chen, Z. Z. Huang, Q. Huang and J. S. Yu, J. Chem. Soc., Perkin Trans. 2, 2000, 121 RSC.
- Y. Doi, M. Kunioka, Y. Nakamura and K. Saga, Macromolecules, 1986, 19, 1274 CrossRef CAS; Y. Doi, M. Kunioka, Y. Nakamura and K. Saga, Macromolecules, 1986, 19, 2860 CrossRef CAS; N. Kamiya, Y. Inoue, Y. Yamamoto, R. Chujo and Y. Doi, Macromolecules, 1990, 23, 1313 CrossRef.
-
F. A. Bovey, High
Resolution NMR of Macromolecules, Academic, New York, 1972 Search PubMed.
|
| This journal is © The Royal Society of Chemistry 2002 |
Click here to see how this site uses Cookies. View our privacy policy here.