Nitrate occurrence in the groundwater of the Loukkos perimeter
Fouad Mourabit*a, A. Ouassinib, A. Azmania and R. Muellerc
aDepartment of Chemistry, Faculty of Sciences, Abdelmalek Essaadi University, B.P. 2121 Tetouan, Morocco
bEnvironmental Laboratory, Faculty of Sciences and Techniques, Tangier, Morocco
cInstitut f. Siedlungswasserbau, Wassergüte-u. Abfallwirtschaft, Abt. Biologie, Universität Stuttgart, Stuttgart, Germany
First published on 9th January 2002
Abstract
This study assesses the occurrence of nitrate in the groundwater beneath the R'mel area of the Loukkos perimeter (north-west Morocco), which covers an approximate area of 2560 km2 and is located between the towns of Ksar el Kebir and Larache. It also borders the Atlantic Ocean. Groundwater supplies are the principal source of drinking water in this region and there is no public drinking water network in the rural area. This perimeter has a population of about 500 000 inhabitants of which the rural population represents 60%, many of whom have depended on and used the water from the aquifers for many years. The inhabitants and farmers depend on the groundwater supplies for drinking water, crop irrigation and other uses. The plain provides the ideal conditions for agriculture and the use of chemical fertilisers has been increasing. In this study, 53 water samples were collected from wells and springs. Each well or spring was sampled once or twice during 1998–2000. Nitrate concentrations ranged from extremely low up to 144 mg L−1. Nitrate concentrations exceeded the maximum contaminant level (MCL) of 50 mg L−1 in 12 of the 53 groundwater samples (23%), whereas 31 of the 53 samples (58%) had nitrate concentrations of less than 25 mg L−1.
Introduction
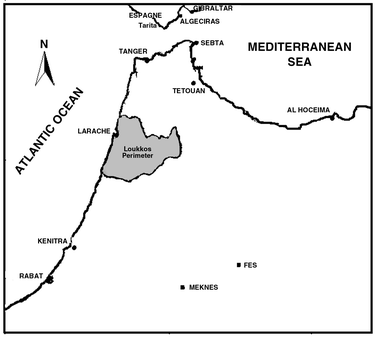
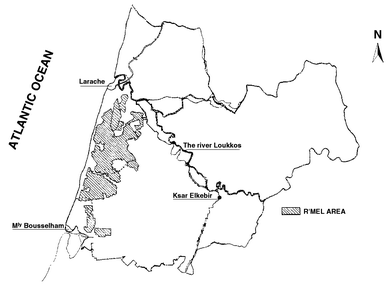
Nitrate contamination of groundwater is a world-wide problem mainly related to the use of organic and chemical fertilisers in intensive agriculture.1 Nitrates seep slowly into the soil until they reach the groundwater. However, tonnes of nitrogen are carried into the groundwater each year by runoff and infiltration. The health effects of groundwater contamination by nitrates have been assessed several times and are known to lead to important consequences for infants. Thus, it is the prevention of this that is of concern in the Moroccan drinking water standard for such substances. The standard permits a maximum level of nitrates of 50 mg L−1 in drinking water. The intake of nitrates in drinking water by humans is currently one of the major environmental problems associated with agricultural practice. Nitrate is itself inert but concern arises due to its possible conversion into nitrite, which is highly toxic.Groundwater is the principal source of drinking water and a significant source of agricultural supply in the Loukkos perimeter (Fig. 1). Over the past 30 years the perimeter, and especially our study area (Fig. 2), has been intensively farmed and irrigated. The large quantity of fertilisers used and the generally permeable sols (sandy sols) have resulted in several problems with groundwater contamination from nitrate.
 | ||
| Fig. 1 Loukkos perimeter, geographical situation in Morocco. | ||
 | ||
| Fig. 2 Loukkos perimeter, geographical situation of R'mel area. | ||
In the R'mel area, the nitrate concentration in the groundwater is greatly influenced by the use of nitrogen fertilisers, which has increased according to an analysis carried out by the Hydraulic Regional Department (DRH) in 1996–1998 (16% exceeded the maximum contaminant level of 50 mg L−1),2 nitrate occurrence is also linked to other source of nitrogen, such as rural septic systems, and other combined factors attributed to land use.3–5
There have been numerous studies focusing on the distribution of nitrate and an investigation of factors related to the observed concentrations has been carried out by the Regional Office of Agricultural Valorisation (ORMVA) and the DRH, but nitrate has not previously been studied in the context of extensive regional agricultural land-use settings in the Loukkos perimeter. The purpose of this study was to assess the quality of the groundwater beneath the R'mel area and to evaluate the factors that affect the groundwater quality.
In addition to a nitrate occurrence survey in the land-use setting, other physicochemical parameters and factors were evaluated, such as nitrite, ammonium, sulfate, conductivity, well depth, and soil.
Area description
The choice of Loukkos perimeter (Fig. 1) was not fortuitous, the economic activity in this area is mainly agricultural. It covers an approximate area of 2560 km2, located between the towns of Ksar el Kebir and Larache. The total population in this region was 500 000 in 1994, with a 60% rural population. The average annual rainfall is estimated at 700 mm and most of the farms are irrigated. Alluvium and sandy soils characterise the sediments in the R'mel area, which represents a high risk for groundwater contamination. The groundwater drinking wells range in depth from shallow (6–16 m) mainly in the south to intermediate in the north and deep (40–50 m) in the littoral.Cultures and fertiliser situation
An investigation of the cultures and use of fertilisers was carried out with the support of the landowners, sales companies and ORMVA. The cultivated area is around 15 000 ha. The main crops are groundnuts (27%), sugar cane (23%), cereals (20%), potatoes (12 %), melon and watermelons (7%), strawberry plants (4%), and others (7%). The amount of fertilisers used each year is 3000 t. The main fertilisers used are NPK 14∶28∶14 (the ratio means 14% nitrogen, 28% P2O5 and 14% K2O); urea 46%; ammonium nitrate 33.5% and ammonium sulfate 21%.Sampling
The selection of water sources was on the basis of the risk of their exposure to nitrate contamination. The wells and springs were located in arable areas, in which the nitrates were mainly used. Water samples were collected between November 1998 and July 1999 using Good Laboratory Practice (GLP) to minimise contamination during sampling. Before a sample was collected, sufficient volumes of water were extracted to ensure that the sample was from the groundwater in the aquifer and not from water stored in the well. Reading of pH, temperature, conductivity, salinity and total dissolved solids (TDS) were done in the sampling sites according to the methods defined by Koterba et al.6 The estimate for the depth of the well was based on personal communication with the landowner.All the samples to be analysed for nitrates were collected in 1 L polyethylene bottles. They were placed in a cooler filled with ice during shipment. All the samples were filtered using a 0.45 µm membrane filter to remove any suspended solids. The water samples were analysed for all forms of nitrogen using the Standard Methods7 and those for general water analysis.8 The apparatus used was a PerkinElmer (Lambda 2 UV/VIS spectrometer).
Results and discussion
The results obtained from the sampling campaign (Table 1) showed that the groundwater was contaminated most frequently and at higher levels to the east and south-east side of the R'mel area (Fig. 3) (Oudiniyine and Boucharene). Nitrate was detected in 52 of the 53 groundwater samples; with concentrations ranging from extremely low up to 144. mg L−1. The nitrate concentrations in 38% of the groundwater samples exceeded 13 mg L−1; nitrate concentrations below 13 mg L−1 may represent groundwater that is unaffected by anthropogenic factors.9,10 12 of the groundwater samples (23%) had nitrate concentrations greater than the maximum contaminant level (MCL) (50 mg L−1). This elevated concentration of nitrate in the groundwater is a threat to human health because nitrate is a factor in the development of infant methemoglobinemia,11 hence an MCL of 50 mg L−1 was chosen because it is the concentration below which there are no cases of infant methemoglobinemia. Nitrogen compounds that occur naturally in water include nitrite, nitrate, and ammonium, although nitrate is the dominant nitrogen species in oxygenated groundwater. In this study, the percentage of wells with nitrite and ammonium concentrations exceeding the MCLs (0.1 mg L−1 and 0.5 mg L−1, respectively) were 7% and 11%, respectively.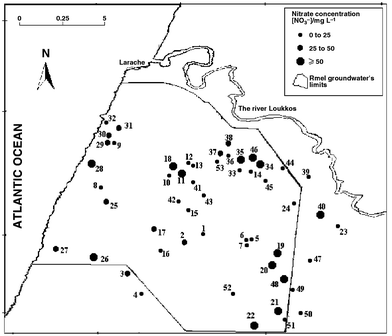 | ||
| Fig. 3 R'mel area; groundwater sample collection points. | ||
| Sample | Area | X | Y | Z | Well depth/m | pH | Conductivity/µS cm−1 | Salinity (‰) | TDS/mg L−1 | TH/meq L−1 | [Ca2+]/mg L−1 | [Mg2+]/mg L−1 | Nitrate (as NO3−)/mg L−1 | Nitrite (as NO2−)/mg L−1 | Ammonium (as NH4+)/mg L−1 | Sulfate (as SO42−)/mg L−1 |
|---|---|---|---|---|---|---|---|---|---|---|---|---|---|---|---|---|
| a X,Y,Z, coordinates Lambert. Well depth below land surface in m. TDS (total dissolved solids), nitrate, nitrite, ammonia and sulfate concentrations in mg L−1.b —, No data available. | ||||||||||||||||
| 1 | Mwar'a | 434 | 496.15 | 56 | 20 | 6.5 | 707 | 0.3 | 339 | — | — | — | 14.53 | 0 | 0.028 | — |
| 2 | Mwar'a | 433.15 | 495.5 | 63 | 7 | 7.2 | 875 | 0.4 | 421 | — | — | — | 32.4 | 0.023 | 0.072 | — |
| 3 | Hchicha | 429.75 | 492.1 | 95 | 22 | 7.6 | 747 | 0.4 | 360 | — | — | — | 45.28 | 0 | 0.123 | — |
| 4 | Hchicha | 431..2 | 489.95 | 120 | 12 | 6.95 | 612 | 0.3 | 293 | — | — | — | 8.63 | 0.047 | 0.1 | — |
| 5 | Lawamra | 437.28 | 495.73 | 35 | 14 | 7.2 | 1183 | 0.6 | 575 | — | — | — | 23.857 | 0.052 | 0.356 | — |
| 6 | Lawamra | 437 | 495.63 | 45 | 7 | 6.8 | 1407 | 0.7 | 688 | — | — | — | 2.76 | 0.021 | 0.08 | — |
| 7 | Lawamra | 436.95 | 495.3 | 58 | 5 | 7.41 | 1725 | 0.9 | 847 | — | — | — | 1.54 | 0.06 | 0.11 | — |
| 8 | Lahyayda | 428.13 | 500.3 | 39 | 40 | 8.43 | 780 | 0.5 | 507 | — | — | — | 17.71 | 0.141 | 0 | — |
| 9 | Ar'Ryah | 428.95 | 504.35 | 26 | 48 | 7.27 | 780 | 0.5 | 445 | — | — | — | 19.68 | 0.027 | 0 | — |
| 10 | O-Hammou | 432.14 | 501.18 | 28 | 10 | 7.76 | 136 | 0.1 | 101 | — | — | — | 6.65 | 0.65 | 1.88 | — |
| 11 | O-Hammou | 432.96 | 501.43 | 20.2 | 10 | 6.94 | 500 | 1 | 987 | — | — | — | 56.01 | 0.05 | 1.95 | — |
| 12 | Hssassna | 433.28 | 502.4 | 21.5 | 60 | 7.37 | 350 | 0.3 | 330 | 1.92 | 33.66 | 5.76 | 11.03 | 0 | 0 | — |
| 13 | Hssassna | 433.63 | 502.15 | 20 | 55 | 7.48 | 367 | 0.3 | 257 | 5.02 | 90.6 | 11.9 | 13.26 | 0 | 0.35 | — |
| 14 | Boucharen | 437.1 | 501.65 | 33.5 | 14 | 7.21 | 483 | 0.3 | 331 | 3.71 | 72.1 | 2.3 | 16.54 | 0.066 | 0 | — |
| 15 | Lawamra | 433.45 | 498.3 | 46.7 | 26 | 7.2 | 648 | 0.5 | 470 | 4.64 | 67.53 | 30.83 | 7.75 | 0.034 | 0 | — |
| 16 | Mwar'a | 431.73 | 494.53 | 68 | 15 | 7.33 | 619 | 0.4 | 350 | 5.53 | 43.3 | 2.9 | 6.05 | 0.047 | 1.345 | — |
| 17 | Rouafa | 431.3 | 496.6 | 61.8 | 10 | 7.15 | 915 | 0.7 | 676 | 7.02 | 125 | 18.71 | 29.42 | 0.036 | 0 | — |
| 18 | O-Hammou | 432.55 | 502 | 25 | 11 | 7.2 | 888 | 0.6 | 611 | 2.71 | 53.13 | 1.3 | 85.37 | 0.06 | 0 | — |
| 19 | Zouad-Diab | 438.7 | 494.2 | 29.3 | 8.5 | 7.15 | 877 | 0.6 | 602 | 7 | 104.8 | 42.77 | 111.7 | 0.01 | 0.002 | 127.82 |
| 20 | Mrawna | 438.45 | 493.8 | 36.4 | 8 | 7.6 | 686 | 0.4 | 394 | 5.8 | 108 | 9.72 | 57.21 | 0.014 | 0 | 54.26 |
| 21 | Oudiniyine | 438.75 | 489 | 67.5 | 15 | 6.15 | 720 | 0.5 | 514 | 5.8 | 73.6 | 51.52 | 107.23 | 0.033 | 0 | 83.37 |
| 22 | Zouad | 438.55 | 488.25 | 73 | 6 | 7.15 | 1231 | 0.7 | 645 | 7.08 | 140 | 1.92 | 104.25 | 0.035 | 0.005 | 98.93 |
| 23 | Chlihat | 442.43 | 496.9 | 19.4 | 18 | 6.5 | 320 | 0.2 | 212 | 1.88 | 20.8 | 20.41 | 15.33 | 0.012 | 0.007 | 5.15 |
| 24 | Berwaga | 439.75 | 499 | 23 | 8 | 7.62 | 410 | 0.3 | 264 | 3.8 | 71.2 | 5.83 | 22.96 | 0.014 | 0 | 5.82 |
| 25 | Lahyayda | 427 | 499 | 68 | 47 | 7.96 | 545 | 0.4 | 493 | 6.64 | 132 | 0.972 | 43.68 | 0.027 | 0.21 | 53.15 |
| 26 | Zlawla | 427.8 | 493.77 | 75 | 18 | 7.16 | 502 | 0.4 | 434 | 6.4 | 117.6 | 12.63 | 93.84 | 0 | 0.08 | 31.15 |
| 27 | O-Skhar | 425.68 | 495.9 | 39.7 | 15 | 7.2 | 540 | 0.6 | 546 | 6.92 | 134.4 | 4.86 | 29.38 | 0.01 | 0.059 | 39.6 |
| 28 | Ar'Ryah | 428.8 | 501.95 | 20.05 | 32 | 7.27 | 624 | 0.6 | 632 | 5.76 | 143.6 | 0 | 51.2 | 0.09 | 0.04 | 66.04 |
| 29 | Ar'Ryah | 428.95 | 504.2 | 21.05 | 50 | 6.96 | 647 | 0.7 | 652 | 7.52 | 152 | 0 | 41.6 | 0 | 0.059 | 37.82 |
| 30 | Ar'Ryah | 428.63 | 504.78 | 35 | 31 | 7.33 | 656 | 0.5 | 514 | 6.64 | 143.2 | 0 | 36.99 | 0.041 | 1.5 | 44.04 |
| 31 | Ghdira | 429.2 | 505.25 | 25 | 43 | 6.96 | 623 | 0.5 | 496 | 6.92 | 134.4 | 4.86 | 44.2 | 0.03 | 0.64 | 28.71 |
| 32 | Ghdira | 428.33 | 505.85 | 33.5 | 39 | 7.55 | 456 | 0.4 | 414 | 3.28 | 84 | 0 | 15.41 | 0.26 | 0.86 | 13.37 |
| 33 | Boucharen | 436.94 | 502.075 | 34 | 6 | 7.33 | 741 | 0.4 | 431 | 6.72 | 131.36 | 3.7 | 9.88 | 0.13 | 0 | 43.82 |
| 34 | Boucharen | 437.53 | 502.3 | 31 | 8 | 7.42 | 846 | 0.5 | 498 | 9.6 | 157.6 | 41.8 | 98.52 | 0.027 | 0.004 | 63.15 |
| 35 | Boucharen | 437.04 | 503.50 | 31 | 7 | 6.82 | 353 | 0.2 | 202 | 3.76 | 63.2 | 14.58 | 50.15 | 0.02 | 0.006 | 25.6 |
| 36 | Boucharen | 436.52 | 504.1 | 27 | 5.5 | 6.3 | 200 | 0.1 | 114 | 1.48 | 16 | 16.52 | 14.44 | 0 | 0 | 4.27 |
| 37 | Dhiria | 436.44 | 504.4 | 30 | 9 | 5.84 | 209 | 0.1 | 123 | 1.12 | 11.2 | 13.6 | 29.61 | 0 | 0 | 2.93 |
| 38 | Dhiria | 436.87 | 505.1 | 10 | 10 | 6.97 | 540 | 0.3 | 321 | 4.8 | 67.2 | 34.99 | 43 | 0.01 | 0.078 | 23.38 |
| 39 | Brouaga | 440.69 | 501.32 | 55 | 55 | 7.45 | 449 | 0.2 | 250 | 4.68 | 76.8 | 20.41 | 4.84 | 0 | 0.014 | 6.04 |
| 40 | Shisshat | 441.44 | 497.85 | 10 | 10 | 6.65 | 992 | 0.7 | 681 | 1.88 | 24 | 77.7 | 144.43 | 0.035 | 1.08 | 95.6 |
| 41 | Sakhsoukh | 434.6 | 500.72 | 18 | 0 | 7.2 | 610 | 0.4 | 361 | 8.48 | 168.8 | 0.97 | 2.96 | 0 | 0.003 | 5.2 |
| 42 | Sakhsoukh | 432.9 | 499 | 35 | 0 | 7.2 | 510 | 0.3 | 302 | 6.64 | 124 | 10.69 | 1.18 | 0 | 0 | 3.6 |
| 43 | Lawamra | 434.29 | 499.43 | 40 | 18 | 7.55 | 570 | 0.3 | 332 | 7.48 | 148 | 1.94 | 15.99 | 0.04 | 0.09 | 63.04 |
| 44 | Bou Jnanet | 439.01 | 501.89 | 8 | 6 | 7.13 | 717 | 0.4 | 423 | 10.16 | 189.2 | 17.01 | 1.73 | 0.01 | 0.01 | 32.6 |
| 45 | Sba Ayoun | 437.98 | 500.78 | 34 | 23 | 7.18 | 835 | 0.5 | 456 | 9.76 | 180 | 18.47 | 7.07 | 0.014 | 0.02 | 37.42 |
| 46 | Boucharen | 437.76 | 502.73 | 28 | 15 | 7.65 | 730 | 0.4 | 421 | 9.84 | 181.6 | 18.47 | 6.97 | 0.044 | 0.03 | 24.51 |
| 47 | Zouada | 440.54 | 493.65 | 41.5 | 96 | 7.46 | 1341 | 0.7 | 659 | 6.86 | 104 | 39.37 | 0 | 0.04 | 0.0003 | 4.48 |
| 48 | Oulad Rafa | 439.35 | 492.6 | 62.4 | 60 | 7.43 | 1880 | 0.1 | 1115 | 10.67 | 189.6 | 28.79 | 51.42 | 0.02 | 0.024 | 11.59 |
| 49 | O-Roain | 439.52 | 491.01 | 60 | 0 | 6.46 | 179 | 0.1 | 80 | 1.04 | 16.8 | 4.86 | 6.31 | 0 | 0.007 | 3.82 |
| 50 | Oudiniyine | 440.09 | 488.83 | 59 | 0 | 6.72 | 217 | 0.1 | 131 | 2.4 | 38.4 | 11.66 | 4.17 | 0 | 0.012 | 4.04 |
| 51 | Oudiniyine | 438.85 | 488.8 | 71 | 22 | 5.15 | 319 | 0.3 | 271 | 5.5 | 108.8 | 1.46 | 1.99 | 0 | 0.019 | 54.04 |
| 52 | O-Ahmed | 435.94 | 490.87 | 91 | 16 | 7.59 | 274 | 0.2 | 206 | 3.28 | 52.8 | 15.55 | 4.93 | 0 | 0.029 | 22.93 |
| 53 | Sodea | 434.92 | 502.69 | 6 | 0 | 7.41 | 401 | 0.2 | 205 | 4.64 | 88 | 5.83 | 2.71 | 0.001 | 0.034 | 12.71 |
The nitrate concentrations in the groundwater in the study area are probably related to the use of fertilisers because a large percentage of the land use is agricultural. The application rates of nitrogen fertilisers vary depending on the crop type. However, other sources of nitrogen, such as animal waste and septic tanks are also linked to the elevated concentrations.12,13 Despite the fact that septic tanks are known sources of contaminants, they are both poorly monitored and poorly maintained.
The nitrate concentrations and the other data were examined to determine whether the occurrence of nitrate is linked to either physical or chemical characteristics, such as well depth12,14 or conductivity.15 The physical characteristics may affect the nitrate concentrations in the groundwater by controlling the rate and amount of nitrate leaching beyond the root zone, whereas the chemical characteristics of the water reflect others factors that influence nitrate occurrence in groundwater, such as the biological conditions, the groundwater residence time, and the relative impact of anthropogenic factors.
The nitrate concentrations were evaluated in relation to the depth of the well below the land surface (Fig. 4). The nitrate concentrations generally decrease with depth because, in recharge areas, groundwater that is deeper is generally older; this older water generally has lower nitrate concentrations, which reflect the lower historical application rates of nitrogen fertilisers. A decrease in the nitrate concentrations with well depth has also been noted by other investigators.10,16 The nitrate concentrations also were correlated to the specific conductance (Fig. 5). Conductivity is related to the total ion composition of the groundwater. In the study area, the nitrate concentrations for samples 6, 7 and 47 were very low but their conductivities were 1407, 1725 and 1341 µS cm−1, respectively (Table 1). The groundwater samples from these three points were chemically reduced; therefore, the low nitrate concentrations may have been a result of nitrate reduction but, in general, the nitrate concentrations and the conductivity are positively correlated.
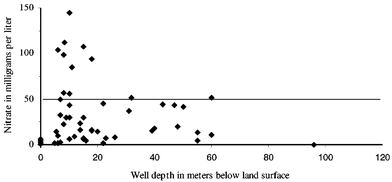 | ||
| Fig. 4 Relation between nitrate concentration and well depth in the R'mel area, Loukkos perimeter. | ||
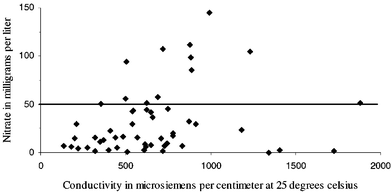 | ||
| Fig. 5 Relation between nitrate concentration and conductivity in the R'mel area, Loukkos perimeter. | ||
In summary, the high nitrate concentrations in the R'mel area are associated with water characteristics that indicate increased anthropogenic effects.
Summary and conclusions
This paper presents the results of a study of the occurrence of nitrate in the groundwater beneath the R'mel area of the Loukkos perimeter. 53 groundwater samples were collected and analysed for nitrate and other physicochemical parameters.Nitrate was detected in 52 of the 53 groundwater samples collected in 1998–2000. The concentrations ranged from extremely low up to 144 mg L−1, and exceeded the MCL of 50 mg L−1 in 12 of the 53 samples (23%). The nitrate concentrations generally decrease with the depth of the well, being higher in the shallow well groundwater samples than in the deep well samples at 77% of the sites.
The present study confirms that intensive application of fertilisers could have serious impacts on the quality of groundwater. While the present findings are probably less alarming than those found in intensive agricultural areas of Europe and USA1,4 they are a signal that such a practice could have long-term impacts on the quality of groundwater.
Acknowledgements
This study was funded by INCO DC project, contract n° ERBIC18CT970167. The authors wish to thank Professor F. H. Frimmel for providing all the instrumental assistance. The authors also wish to thank Professor K. R. Burow for her scientific assistance.References
- World Health Organisation, Health Hazards From Nitrates In Drinking Water, WHO, Geneva, 1985 Search PubMed.
- Bulletin d'analyse de la qualité des eaux, Hydraulic Regional Department, Morocco, 1996–1998 Search PubMed.
- National Research Council, Agric. Ecosyst. Environ., 1989, 26, 165 CrossRef.
- D. C. Bouchard, M. K. Williams and R. Y. Surampalli, J. Am. Med. Assoc., 1992, 7, 85 Search PubMed.
- D. Kenney, CRC Crit. Rev. Environ. Control, 1986, 16, 257 Search PubMed.
- M. T. Koterba, F. D. Wilde and W. W. Lapham, Groundwater Data-Collection Protocols and Procedures for the National Water-Quality Assessment Program: Selection, Installation and Documentation of Water-Quality Samples and Related Data, US Geological Survey, Denver, CO, 1995, Open-file Report 95-398, p. 69 Search PubMed.
- A. D. Eaton, L. Clesceri and A. E. Greenbergs, Standard Methods, American Public Health Association, Washington, DC, 19th edn., 1995 Search PubMed.
- J. Rodier, L’analyse de l’eau, Dunod, Paris, 7th edn., 1984 Search PubMed.
- R. J. Madison and J. O. Brunett, Overview of the occurrence of nitrate in groundwater of the United States, in national water summary 1984, hydrologic events, selected water-quality trends, and groundwater resources, US Geological Survey, Denver, CO, 1985, Water-Supply Paper 2275, pp. 93–105 Search PubMed.
- D. K. Mueller and D. R. Helsel, Nutrients In The Nation's Water; Too Much Of A Good Thing?, US Geological Survey, Denver, CO, 1996, Circular 1136, p. 24 Search PubMed.
- H. H. Comly, Am. Med. Assoc. J., 1945, 129, 112 Search PubMed.
- C. L. Macleod, T. H. Barringer, E. F. Vowinkel and C. V. Price, Relation of Nitrate Concentration in Groundwater to Well Depth, Well Use, and Land Use in Franklin Township, Gloucester County, 1970–85, US Geological Survey, Denver, CO, 1995, Water-Resources Investigations Report 94-4174, p. 29 Search PubMed.
- E. F. Vowinkel and R. J. Tapper, Indicators of the Sources and Distribution of Nitrate in Water from Shallow Domestic Wells in Agricultural Area of the New Jersey Coastal Plain, US Geological Survey, Denver, CO, 1995, Water-Resources Investigations Report 96-4178, p. 48 Search PubMed.
- J. J. Troiano and J. Sitts, Survey for Alachlor, Atrazine, Metolachlor and Nitrate Residues in Well Water in Merced County and Their Relation to Soil and Well Characteristics, California Department of Food and Agriculture, CA, 1990, Environmental Hazards Assessment Program Report EH 90-3, p. 83 Search PubMed.
- K. D. Schmidt, Proceedings of the National Water Well Association Western Regional Conference on Groundwater Management, 1983, San Diego, CA, pp. 77–84 Search PubMed.
- K. R. Burow, S. V. Stork and N. M. Dubrovsky, Nitrate and Pesticides in Groundwater in the Eastern San Joaquin Valley, California: Occurrence and Trends, US Geological Survey, Denver, CO, Water-Resources Investigations Report 98-4040, 1999, p. 16 Search PubMed.
| This journal is © The Royal Society of Chemistry 2002 |