Heavy metal concentration and distribution in a dated sediment core of Nainital Lake in the Himalayan region
Received
13th September 2001
, Accepted 6th December 2001
First published on 14th January 2002
Abstract
The concentrations and distribution of the elements, including heavy metals such as As, Ba, Br, Co, Cr, Cs, Fe, Ga, K, Mn, Na, Rb, Sc, Sr, Th and Zn, were investigated in dated sediment cores of Nainital Lake located in the Himalayan region, in Uttar Pradesh state of India, which is considered as a remote background area. The concentrations of the elements were measured by instrumental neutron activation analysis using the k0 method. The International Atomic Energy Agency certified reference material SL-3 was used to evaluate the accuracy of the method. The normalized data for a series of elements were used to understand the source of loading. Elements like Br, Co, Cr, Fe, K, Mn and Zn show a negative correlation with increasing depth whereas elements like As, Ba, Cs, Na and Rb show a positive correlation with increasing depth. By considering the concentration for the bottom segments of the core as close to the baseline concentration, recent flux values for
different elements were calculated. An increase in the flux value was observed for Br, Cr, Fe, K, Mn and Zn, which can be attributed to anthropogenic contribution in recent years.
Introduction
Rivers and freshwater lakes are the historical sites of civilization. In modern times, due to increasing population, large-scale industrialization and newer methods of farming, water bodies are continuously being loaded with large amount of elements, which were either absent earlier or present in very small quantities. The prevailing physicochemical conditions might be responsible for these elements precipitating and becoming a permanent part of the sediment. With accurate knowledge of sedimentation rates coupled with the determination of the elemental concentration as a function of the depth of the sediments, it is possible to unfold a chronology of input of different heavy metals to the water bodies. Over the last few decades, elemental concentrations in sediments have been employed as indicators of the history of metal pollution in many areas1–4 as the sediment is considered to be a major sink for the chemical components of the water
bodies. Such studies are useful to estimate the impact of a particular industrial activity on water bodies and also to provide guidelines for planned development. Remote regions where pollution and the impact of industrialization is negligible are considered as representatives of pristine environments.
In the present study, heavy metal concentration profiles in a dated sediment core of Nainital Lake were determined to obtain information about the flux of different elements and their anthropogenic contribution in Himalayan regions. The concentration of the elements was measured by instrumental neutron activation analysis (INAA). In the present case we have used k0 based INAA.5–8 This method involves the simultaneous irradiation of a sample and a neutron flux monitor, such as gold, and the use of a composite nuclear constant called k0.5–8 The certified reference material (CRM) SL-3 (lake sediment) from the International Atomic Energy Agency (IAEA) has been used to evaluate the accuracy of the method.
About the study area
Crescent-shaped Nainital Lake (also called Lake Naini) is a tectonically formed sub-tropical and eutrophic lake9 situated at an altitude of about 1937 m above mean sea level (latitude 29° 24′ N and longitude 79° 23′ E) in the Nainital district of the Kumaun Himalayas. The lake is divisible into a Mallital (northwest) basin and a Tallital (southwest) basin due to the presence of submerged transverse ridge trending east–west about 8 m below the lake surface. The average depth of the lake is 18.5 m spread over an area of 4.65 km2 with a maximum depth of 27.3 m. The volume of water is about 8.5 × 10⁶ m3. The catchment area of the lake is about 4.9 km2
(Fig. 1). The lake is the only source of drinking water to the Nainital Town situated and developed in all directions around the Nainital Lake. The houses
are situated on the local plains and on small slopes across the lake. The annual rainfall in the catchment of Lake Nainital ranges from 2200 to 2500 mm. There are occasional snowfalls in and around the lake basin during winter, varying between 20 and 60 mm in recent years. The lake is sheltered by steep cliffs, with practically no wind effect on the water mixing below a depth of few meters.4
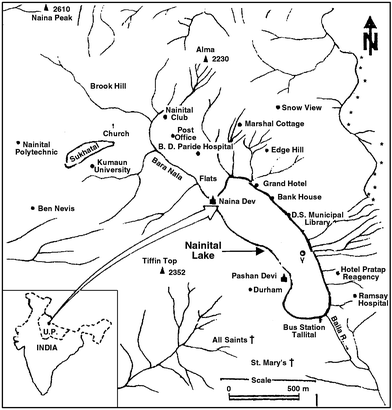 |
| | Fig. 1 Location map of Nainital Lake, Uttar Pradesh, India with sampling location 'V'. | |
Methodology
Sampling
The sampling station is the deepest point of the lake and a large number of streams loaded with considerable amounts of sediments enter the lake basin near this station. The core sample was collected at location ‘V’
(Fig. 1) in the lake using a gravity corer. The corer was made of PVC rigid piping with inner and outer diameters of 5.2 and 6.0 cm, respectively. The length of the core obtained was 51 cm. The core was extruded vertically and sliced at 2 cm intervals. All the samples were handled with plastic and glass implements to avoid contamination. Care was taken during sampling and transportation to prevent sediments coming in to contact with metals and dust.10 The sliced core sections were homogenized, freeze-dried and stored. The core sample was mainly clay and silt. The clay mineralogy was montmorillonite, illite, kaolinite and chlorite.9
Irradiation and radioactive assay
The homogenized freeze-dried samples were powdered to a fine mesh size in the range of 200–100 corresponding to a 75–150 µm particle size. Samples weighing 40–75 mg were sealed in polypropylene tubes (3 mm id). The sealed tubes containing sample along with accurately weighed gold solution, containing about 5 µg, were doubly sealed in polythene, placed in a standard irradiation can and irradiated in the D8 position of the APSARA reactor, BARC, Trombay, Mumbai. The f and α values for this position were determined simultaneously based on co-irradiation of three bare resonance detectors (197Au, 94Zr and 96Zr);8 the values obtained were 65.2 ± 5.8 and 0.054 ± 0.01, respectively.11 This f value corresponds to a thermal neutron flux of 1012 n cm−2 s−1. The duration
of irradiation was varied between 15 min and 7 h depending on the half-lives of the radionuclides of interest.
The radionuclides with half-lives of between 2 h and 8.6 years were studied in the present case. CRM SL-3, weighing about 50–100 mg, was prepared and irradiated in a similar manner to the sample. Irradiated samples were assayed for gamma-activity of the activation products using an 80 cm3 HPGe detector coupled to a PC-based 4 K channel analyzer in an efficiency calibrated position with reproducible sample-to-detector geometry. The detector system had a resolution of 2.1 keV at 1332 keV. Gamma-ray standard 152Eu was used for calibration of the detector. The sample-to-detector distance was maintained at between 8 and 15 cm depending upon the level of activity, to avoid pileup, coincidence effects and care was taken to keep the dead time below 5% by adjusting the sample-to-detector distance.
Calculations
The specific count rate (Asp) for the activation product of the element of interest is given by eqn. (1),5| |  | (1) |
where PA is the net counts or peak area under the photo peak, S
(=1−e−λti) is the saturation factor, D
(=e−λtc) is the decay factor, λ is the decay constant, ti is the duration of irradiation and tc is the cooling time, C
(=(1−e−λCL)/λ) is the correction factor for the decay during counting period (CL) and w is the mass of the element or comparator (usually
taken in µg). The concentration of the ith element (Ci in mg.kg−1) was calculated using eqn. (2),6| | 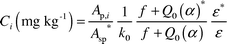 | (2) |
where Ap,i is the specific count rate of ith nuclide =
PA/(SDCW)
(where W is the sample mass in g), Asp* is the specific count rate of the comparator (gold) and the symbol * refers to the corresponding parameters of the comparator (gold), f is the subcadmium-to-epithermal neutron flux ratio, α is the epithermal neutron flux shape factor and Q0(α)8 is the ratio of resonance
integral corrected for α
(I0(α)) to the thermal neutron cross-section (σth), k0 is the recommended k0–factors10 and ε is the gamma-ray detection efficiency. Relevant nuclear data are taken from the compilations of Browne and Firestone.11 Other details including calculations can be found elsewhere.6–8,12,13
Determination of sedimentation rate in Nainital Lake
The excess 210Pb in different core sections was measured in this laboratory using a literature procedure.14,15 The total 210Pb profile at this location shows an exponential decrease in concentration with depth to a constant value maintained by in situ decay of 226Ra. For dating different sections of the core, a constant flux and constant sedimentation rate model was used. The 210Pb dating is based on the following assumptions: (1) loss of 210Pb from the sediment depth horizons is only by radioactive decay (i.e., there is no mixing of various layers and there is no chemical mobility of 210Pb after deposition); (2) the radionuclide flux at the sediment/water interface has remained constant; (3) the in situ concentration of 210Pb due to the decay of present 226Ra in the sediment is constant. The
sedimentation rate from the vertical distribution of excess 210Pb in the core was obtained using the following equation.16| |  | (3) |
where A(Z) is the activity of excess 210Pb (Bq kg−1) in the sediment at any depth Z from the sediment/water interface, A0 is the activity of excess 210Pb (Bq kg−1) in freshly deposited sediment at a depth Z
= 0 (sediment/water interface), b is the slope of the line for the logarithmic excess of 210Pb activity versus the depth and is equal to λ/S, where S is sedimentation rate in cm year−1 and λ is the decay constant (0.0311 year−1).
From the slope of the plot of excess 210Pb concentration versus depth, the sedimentation rate at the deepest zone of the lake, i.e., location ‘V’ of the lake (Fig. 1) was obtained as 0.48 cm year−1.17 From the linear sedimentation rate, dates were assigned to each section of the core. A dry mass sedimentation rate17 of 0.112 ± 0.010 g cm−2 year−1 was used to calculate the flux. Details of analytical method of determination of sedimentation rate in the Nainital Lake are given elsewhere.17
Results and discussion
The measured concentrations of the different elements in the sediment samples, with the corresponding depth and year, are given in Table 1. The reported values are average values from triplicate measurements and the error quoted is the standard deviation at ±1σ confidence limit. The elemental concentrations in CRM SL-3 from five independent measurements are given in Table 2. The percentage deviation of the measured elemental concentration with respect to the recommended values18 are within ±1–6%
(except for a value of 10% for Cs). The measured values are well with in the confidence interval18
(Table 2).
Table 1 Elemental concentrations (mg kg−1 unless indicated) on a dry weight basis in Nainital Lake
| Year |
Depth/cm |
As |
Ba |
Br |
Co |
Cr |
Cs |
Fe/g kg−1 |
Ga |
K/g kg−1 |
Mn/g kg−1 |
Na/g kg−1 |
Rb |
Sc |
Sr |
Th |
Zn |
| 1996 |
1 |
18.2 ± 0.9 |
745 ± 15 |
1.85 ± 0.11 |
31.3 ± 1.8 |
113 ± 5 |
12.11 ± 0.52 |
52.3 ± 1.8 |
9.8 ± 0.7 |
32.2 ± 1.5 |
1.72 ± 0.1 |
4.2 ± 0.2 |
100 ± 5 |
13.6 ± 0.9 |
532 ±10 |
13.9 ± 1.1 |
146.0 ± 5.2 |
| 1981 |
7 |
16.5 ± 1.1 |
752 ± 32 |
1.50 ± 0.07 |
24.0 ± 1.0 |
107 ± 4.2 |
12.50 ± 0.67 |
51.1 ± 1.0 |
10.2 ± 0.8 |
30.6 ± 1.4 |
1.67 ± 0.1 |
4.2 ± 0.2 |
101 ± 5 |
12.8 ± 0.7 |
453 ± 15 |
12.7 ± 1.1 |
144.0 ± 5.2 |
| 1969 |
13 |
17.3 ± 1.3 |
780 ± 25 |
1.50 ± 0.08 |
23.9 ± 1.0 |
104 ± 4.1 |
13.87 ± 0.82 |
51.1 ± 1.0 |
10.5 ± 0.9 |
29.8 ± 0.7 |
1.42 ± 0.1 |
4.2 ± 0.2 |
101 ± 4 |
12.1 ± 0.5 |
375 ± 20 |
11.5 ± 1.0 |
136.0 ± 4.5 |
| 1956 |
19 |
17.5 ± 1.3 |
794 ± 18 |
1.40 ± 0.06 |
21.8 ± 0.9 |
103 ± 5 |
14.06 ± 0.61 |
50.1 ± 0.9 |
9.4 ± 0.7 |
27.4 ± 0.6 |
1.36 ± 0.1 |
4.4 ± 0.3 |
101 ± 4 |
12.4 ± 0.7 |
332 ± 17 |
13.6 ± 1.0 |
126.0 ± 4.2 |
| 1940 |
27 |
18.1 ± 1.3 |
798 ± 45 |
1.39 ± 0.06 |
20.5 ± 0.6 |
96 ± 4.2 |
14.15 ± 0.90 |
50.0 ± 0.9 |
10.5 ± 0.8 |
24.5 ± 1.8 |
1.29 ± 0.1 |
4.6 ± 0.3 |
110 ± 4 |
13.8 ± 0.7 |
282 ± 16 |
11.3 ± 0.9 |
111.0 ± 6.3 |
| 1927 |
33 |
19.5 ± 1.1 |
810 ± 38 |
1.38 ± 0.06 |
21.7 ± 0.9 |
94 ± 4.2 |
14.29 ± 0.94 |
46.1 ± 1.1 |
9.4 ± 0.7 |
24.4 ± 1.0 |
1.28 ± 0.1 |
4.9 ± 0.2 |
112 ± 6 |
12.3 ± 0.6 |
290 ± 17 |
13.8 ± 1.0 |
110.1 ± 5.7 |
| 1915 |
39 |
19.7 ± 1.1 |
821 ± 30. |
1.3 ± 0.1 |
21.4 ± 0.8 |
91.6 ± 5.1 |
14.46 ± 0.83 |
42.2 ± 1.3 |
11.0 ± 0.9 |
24.0 ± 1.2 |
1.26 ± 0.1 |
4.4 ± 0.3 |
115 ± 7 |
12.7 ± 0.6 |
350 ± 15 |
11.3 ± 0.9 |
105.0 ± 4.3 |
| 1902 |
45 |
19.9 ± 1.1 |
833 ± 36 |
1.0 ± 0.03 |
20.9 ± 1.0 |
90.6 ± 3.6 |
14.74 ± 0.62 |
41.1 ± 2.7 |
9.5 ± 0.7 |
23.0 ± 1.1 |
1.19 ± 0.1 |
4.8 ± 0.2 |
123 ± 7 |
12.1 ± 0.5 |
496 ± 22 |
13.0 ± 1.1 |
97.4 ± 5.7 |
| 1890 |
51 |
20.4 ± 1.2 |
881 ± 30 |
1.0 ± 0.03 |
20.9 ± 1.0 |
90.6 ± 3.6 |
13.23 ± 1.52 |
41.1 ± 2.4 |
8.96 ± 0.52 |
23.0 ± 1.1 |
1.19 ± 0.1 |
5.4 ± 0.1 |
136 ± 7 |
12.6 ± 0.8 |
500 ± 10 |
12.3 ± 1.0 |
97.4 ± 5.7 |
Table 2 Concentration of CRM SL-3 (mg kg−1 unless indicated) on a dry weight basis (n
= 5)
| Sr |
Element |
This work |
Recommended valuesa
(ref. 18) |
Confidence intervalb(ref. 18) |
|
NR = not reported.
NA = not applicable.
|
| 1 |
As |
3.31 ± 0.23 |
3.2 |
3–3.4 |
| 2 |
Br |
5.82±0.25 |
5.63 |
4.84–6.92 |
| 3 |
Ce |
46.2 ± 1.32 |
45.5 |
43.9–47.2 |
| 4 |
Cr |
46.3 ± 3.32 |
NR |
NA |
| 5 |
Cs |
1.52 ± 0.10 |
1.38 |
1.24–1.51 |
| 6 |
Dy |
2.25 ± 0.13 |
2.22 |
1.65–2.78 |
| 7 |
Eu |
0.70 ± 0.06 |
0.66 |
0.64–0.67 |
| 8 |
Fe/g kg−1 |
13.5 ± 0.7 |
NR |
NA |
| 9 |
Hf |
9.42 ± 0.80 |
9.10 |
8.51–9.69 |
| 10 |
K/g kg−1 |
8.83 ± 0.6 |
8.74 |
7.92–9.57 |
| 11 |
La |
23.9 ± 1.9 |
22.5 |
21.6–23.5 |
| 12 |
Mn |
416 ± 21.0 |
NR |
NA |
| 13 |
Na/g kg−1 |
6.83 ± 0.45 |
6.69 |
6.36–7.02 |
| 14 |
Rb |
38.1 ± 1.16 |
38.8 |
36.9–40.6 |
| 15 |
Sc |
3.86 ± 0.16 |
3.91 |
3.64–4.18 |
| 16 |
Sm |
3.78 ± 0.29 |
3.83 |
3.53–4.13 |
| 17 |
Sr |
480.2 ± 22.3 |
470 |
460–490 |
| 18 |
Ta |
0.72 ± 0.02 |
0.70 |
0.66–0.75 |
| 19 |
Th |
7.27 ± 0.52 |
7.02 |
6.54–7.5 |
| 20 |
Yb |
1.78 ± 0.11 |
1.89 |
1.77–2.01 |
The percentage relative standard deviations (%RSD) of the measured values in SL-3 were found to be 3–9% at the 1σ confidence limit. The elemental flux (µg cm−2 year−1) entering the water body is calculated as the product of the element concentration and the mean sedimentation rate for each section of the core. Calculated flux values for each section of the core are given in Table 3.
Table 3 Flux (µg cm−2 year−1) of different elements in Nainital Lake
| Year |
Depth/cm |
As |
Ba |
Br |
Co |
Cr |
Cs |
Fe |
Ga |
K |
Mn |
Na |
Rb |
Sc |
Sr |
Th |
Zn |
| 1996 |
1 |
2.036 |
83.4 |
0.207 |
3.50 |
12.656 |
1.356 |
5860 |
1.10 |
3610 |
190 |
470 |
11.23 |
1.523 |
59.6 |
1.555 |
16.35 |
| 1981 |
7 |
1.848 |
84.2 |
0.168 |
2.69 |
11.984 |
1.400 |
5720 |
1.14 |
3430 |
190 |
470 |
11.25 |
1.434 |
50.7 |
1.42 |
16.13 |
| 1969 |
13 |
1.942 |
87.4 |
0.168 |
2.67 |
11.648 |
1.553 |
5720 |
1.18 |
3340 |
160 |
470 |
11.28 |
1.359 |
42.0 |
1.286 |
15.23 |
| 1956 |
19 |
1.954 |
88.9 |
0.157 |
2.44 |
11.536 |
1.575 |
5610 |
1.05 |
3070 |
150 |
490 |
11.28 |
1.387 |
37.2 |
1.52 |
14.11 |
| 1940 |
27 |
2.023 |
89.4 |
0.156 |
2.29 |
10.752 |
1.585 |
5600 |
1.18 |
2740 |
150 |
520 |
12.35 |
1.547 |
31.6 |
1.263 |
12.43 |
| 1927 |
33 |
2.184 |
90.7 |
0.155 |
2.43 |
10.528 |
1.601 |
5100 |
1.05 |
2730 |
140 |
550 |
12.54 |
1.380 |
32.5 |
1.547 |
12.32 |
| 1915 |
39 |
2.206 |
91.9 |
0.146 |
2.39 |
10.259 |
1.62 |
4700 |
1.23 |
2690 |
140 |
490 |
12.88 |
1.422 |
39.2 |
1.262 |
11.76 |
| 1902 |
45 |
2.229 |
93.3 |
0.112 |
2.34 |
10.147 |
1.651 |
4600 |
1.07 |
2580 |
130 |
540 |
13.78 |
1.352 |
55.6 |
1.451 |
10.91 |
| 1890 |
51 |
2.285 |
98.7 |
0.112 |
2.34 |
10.147 |
1.482 |
4600 |
1.00 |
2580 |
130 |
610 |
15.23 |
1.411 |
56.0 |
1.379 |
10.91 |
Element concentration profile
One of the ways of examining the trend of the elemental input into sediment is to analyze the normalized data as follows.19 The normalized deviation Δij is expressed as: | |  | (4) |
where xij is the concentration of ith element in a sample retrieved from depth j, ![[x with combining macron]](https://www.rsc.org/images/entities/i_char_0078_0304.gif) i is the mean concentration and σj is the sample standard deviation of the measured concentration. In Figs. 2–4, the normalized deviations (Δij) are plotted as a function of depth (j). These plots represent the variation in concentration of an ith element as a function of depth and are useful in order to understand the pattern of different elements in the core. In addition, to
support the observed trend, a study of the elemental profile with respect to core depth, various elements and depth was carried out and correlation coefficients were determined using a PC-based statistical package called Statistical Package for Social Science (SPSS). The correlation matrix is given in Table 4. As per the correlation coefficient of the elemental concentration and their variation with depth the elements can be divided into four groups. (a) Elements like As, Ba, Rb and Cs have increasing concentration with increasing depth. However As, Ba and Rb correlate well among themselves (r
= 0.8–0.9). (b) Elements like Br, Co, Cr and Zn are also well correlated and their concentration decreases with increasing depth. (c) The group of elements like Mn, Fe and K whose concentration decreases with depth but correlates well. (d) Elements like Ga, Sc and Th whose concentration
values oscillate around the average values do not correlate with each other.
i is the mean concentration and σj is the sample standard deviation of the measured concentration. In Figs. 2–4, the normalized deviations (Δij) are plotted as a function of depth (j). These plots represent the variation in concentration of an ith element as a function of depth and are useful in order to understand the pattern of different elements in the core. In addition, to
support the observed trend, a study of the elemental profile with respect to core depth, various elements and depth was carried out and correlation coefficients were determined using a PC-based statistical package called Statistical Package for Social Science (SPSS). The correlation matrix is given in Table 4. As per the correlation coefficient of the elemental concentration and their variation with depth the elements can be divided into four groups. (a) Elements like As, Ba, Rb and Cs have increasing concentration with increasing depth. However As, Ba and Rb correlate well among themselves (r
= 0.8–0.9). (b) Elements like Br, Co, Cr and Zn are also well correlated and their concentration decreases with increasing depth. (c) The group of elements like Mn, Fe and K whose concentration decreases with depth but correlates well. (d) Elements like Ga, Sc and Th whose concentration
values oscillate around the average values do not correlate with each other.
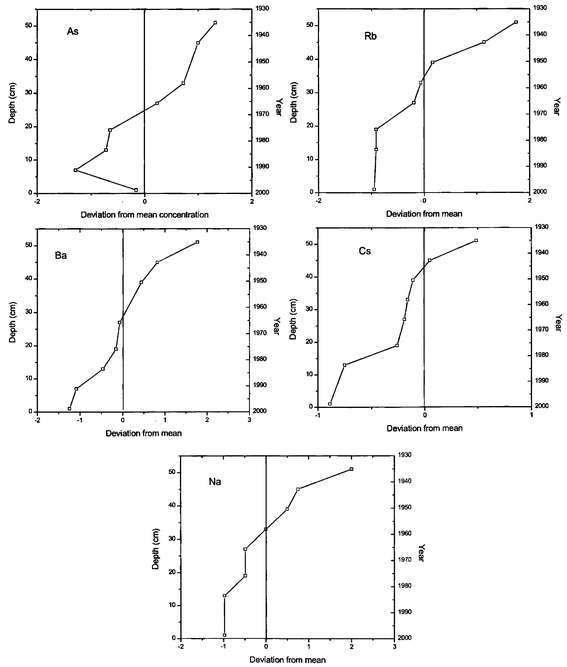 |
| | Fig. 2 Deviation from the mean concentration versus depth for As, Rb, Ba, Cs and Na in a core collected from Nainital Lake. | |
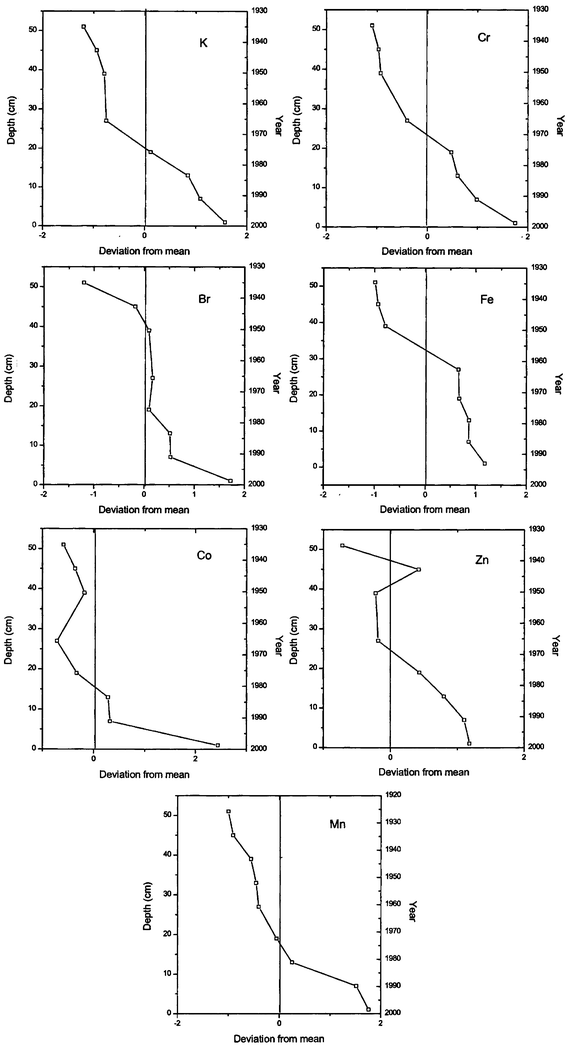 |
| | Fig. 3 Deviation from the mean concentration versus depth for K, Cr, Br, Fe, Co, Zn and Mn in a core collected from Nainital Lake. | |
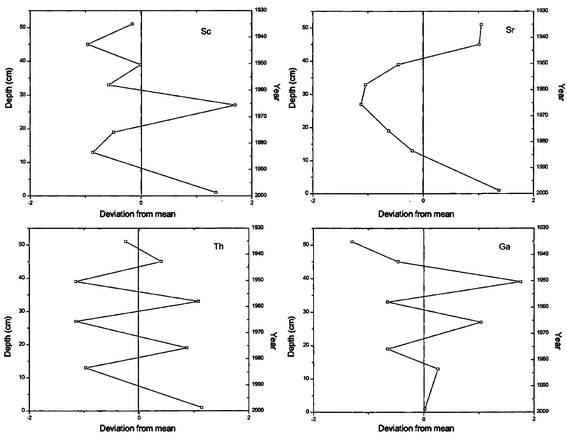 |
| | Fig. 4 Deviation from the mean concentration versus depth for Sc, Sr, Th and Ga in a core collected from Nainital Lake. | |
Table 4 Correlation matrix of variable (depth and elemental concentration)
| |
Depth |
Na |
K |
Mn |
Fe |
Th |
Ga |
Sr |
Sc |
| Depth |
1.0000 |
0.8430 |
−0.9547 |
−0.9306 |
−0.9437 |
−0.2349 |
−0.2974 |
−0.0543 |
−0.3575 |
| Na |
— |
1.0000 |
−0.8048 |
−0.7425 |
−0.7410 |
0.0555 |
−0.6546 |
0.0841 |
−0.2103 |
| K |
— |
— |
1.0000 |
0.9506 |
0.8306 |
0.2613 |
0.2273 |
0.3061 |
0.2297 |
| Mn |
— |
— |
— |
1.0000 |
0.7956 |
0.3127 |
0.2163 |
0.3236 |
0.4036 |
| Fe |
— |
— |
— |
— |
1.0000 |
0.1561 |
0.2606 |
−0.1537 |
0.4232 |
| Th |
— |
— |
— |
— |
— |
1.0000 |
−0.7048 |
0.2914 |
−0.1344 |
| Ga |
— |
— |
— |
— |
— |
— |
1.0000 |
−0.3440 |
0.3030 |
| Sr |
— |
— |
— |
— |
— |
— |
— |
1.0000 |
−0.0043 |
| Sc |
— |
— |
— |
— |
— |
— |
— |
— |
1.0000 |
| |
Depth |
Zn |
Cr |
Co |
Br |
As |
Rb |
Cs |
Ba |
| Depth |
1.0000 |
−0.9732 |
−0.9737 |
−0.7379 |
−0.8637 |
0.8604 |
0.9235 |
0.6469 |
0.9624 |
| Zn |
— |
1.0000 |
0.9729 |
0.7745 |
0.8322 |
−0.8279 |
−0.8746 |
−0.6777 |
−0.9307 |
| Cr |
— |
— |
1.0000 |
0.8296 |
0.8442 |
−0.7926 |
−0.8430 |
−0.7339 |
−0.9058 |
| Co |
— |
— |
— |
1.0000 |
0.9329 |
−0.3464 |
−0.5158 |
−0.7659 |
−0.6868 |
| Br |
— |
— |
— |
— |
1.0000 |
−0.5276 |
−0.8148 |
−0.4817 |
−0.9172 |
| As |
— |
— |
— |
— |
— |
1.0000 |
0.8456 |
0.4875 |
0.7982 |
| Rb |
— |
— |
— |
— |
— |
— |
1.0000 |
0.3269 |
0.9368 |
| Cs |
— |
— |
— |
— |
— |
— |
— |
1.0000 |
0.5250 |
| Ba |
— |
— |
— |
— |
— |
— |
— |
— |
1.0000 |
The elements in the first category As, Ba, Cs, Na and Rb are natural in origin and their concentrations increase with increasing depth, their near surface concentration is the lowest19
(Fig. 2). This indicates that the input of these elements could be at a constant rate and the observed pattern could have been due to a high sedimentation rate during the recent past. In the case of arsenic the positive correlation may be attributed to post-depositional migration20 as the concentration is higher than the background value. On the other hand the observed trend in Fig. 3 for elements like Br, Co, Cr, Fe, K, Mn and Zn is that they have a negative correlation with increasing depth. In this area, wood and coal burning is a common activity in the winter season and this may result in raising the contribution of elements like Br, K and Zn.21–24
There is a possibility that these elements might have reached the lake through run-off in the rainy season and settled at the surface and become part of the sediment. The anthropogenic elements in the second and third category show a negative trend, which could be because of higher pollution in the catchment-areas in recent times as compared with the pre-industrialization era. Thus it might be attributed that increased human activity and modern agricultural practices might have contributed to this anthropogenic load.25 In contrast to these two groups, the concentrations of Ga, Sc, Sr and Th do not show any trend. Their values are scattered on both the sides of the mean.
The average depositional flux in the core for each 6 cm interval from the top section to the bottom section of the core is shown in Table 3. For Br, Cr, Fe, K, Mn and Zn, an increase in the flux value from the bottom to top of the core is observed (Table 3). Assuming that the concentration for the bottom segments is close to the baseline concentration, we can calculate the recent flux for these elements. Table 5 gives the recent fluxes for a few elements. The recent fluxes obtained in the Nainital Lake were compared with reported fluxes19 in the three lakes of New York City. The recent flux values for Cr and Zn in lake Sylvan and lake Champlain were found19 to be 2.4 × 10⁻⁵ and 1.1 × 10⁻⁵
µg cm−2 year−1, respectively, which
are an order of magnitude higher than the value observed for Nainital Lake. This might be due to the higher industrial activity in and around New York as compared with Nainital city.
Table 5 Recent fluxes in Nainital Lake
| Sr |
Element |
Mean concentration/µg g−1 |
Standard deviation/µg g−1 |
Flux/g cm−2 year−1 |
| 1 |
As |
16.72 |
3.2 |
— |
| 2 |
Ba |
801.0 |
41.73 |
— |
| 3 |
Br |
1.37 |
0.26 |
9.5 × 10 −8 |
| 4 |
Co |
22.9 |
3.42 |
11.6 × 10 −7 |
| 5 |
Cr |
98.87 |
8.15 |
2.5 × 10 −6 |
| 6 |
Cs |
14.6 |
1.45 |
— |
| 7 |
Fe |
4.72 × 10 4 |
0.465 × 10 4 |
12.54 × 10 −4 |
| 8 |
Ga |
9.827 |
0.667 |
— |
| 9 |
K |
2.65 × 10 4 |
3.54 × 10 4 |
10.33 × 10 −4 |
| 10 |
Mn |
0.137 × 10 4 |
0.019 × 10 4 |
— |
| 11 |
Na |
0.46 × 10 4 |
0.04 × 10 4 |
— |
| 12 |
Rb |
112.86 |
13.263 |
— |
| 13 |
Sc |
12.7 |
0.662 |
— |
| 14 |
Sr |
394.0 |
100.0 |
— |
| 15 |
Th |
12.59 |
1.07 |
— |
| 16 |
Zn |
119.2 |
19.25 |
5.44 × 10 −6 |
Conclusion
The k0 INAA method was used to obtain the depth profile of trace elements in bottom sediments. The data presented here represent a first effort to determine the fluxes of different elements in the Himalayan region using sediment cores taken from Nainital Lake. The anthropogenic contribution to the total flux of the different elements is an order of magnitude less than the values for sediment core of a lake near an industrialized city like New York. For anthropogenic elements, like Br, Co, Cr, Fe, K, Mn and Zn, the observed increase in the flux can be attributed mainly to a contribution from run-off and from the sewage discharge of Nainital town partly by direct deposition to the lake, and can be regarded as cultural pollution. The data clearly establish a different picture for Zn, K, Mn, Fe, Cr and Br compared with the clastic elements Sc, Sr, Th and Ga. The relative variation of Ga, Sc, Th and Sr within the core reflect the changes in the contribution of clastic material
to the total lake sediment for which the anthropogenic source is not known.
References
- H. Erlenkeuser, E. Suess and H. Willkomm, Geochim. Cosmochim. Acta, 1974, 38, 823 CrossRef CAS.
- J. Kada, M. Heit and K. M. Miller, Water, Air Soil Pollut., 1994, 75, 353 CrossRef CAS.
- J. M. Deely and J. E. Fergusson, Sci. Total Environ., 1994, 153, 97 CrossRef CAS.
- G. Mihelcic, B. Surija, M. Juracic, D. Barisic and M. Branica, Sci. Total Environ., 1996, 182, 105 CrossRef.
- A. Simonits, F. De Corte and J. Hoste, J. Radioanal. Chem., 1975, 24, 31 CAS.
- F. De Corte, A. Simonits, A. De
Wispelare and J. Hoste, J. Radioanal. Nucl. Chem., 1987, 113, 145 CAS.
- F. De Corte, L. Moens, A. Simonits, A. De Wispelare and J. Hoste, J. Radioanal. Nucl. Chem., 1979, 52, 295 CAS.
- R. N. Acharya, P. P. Burte, A. G. C. Nair, A. V. R. Reddy and S. B. Manohar, J. Radioanal. Nucl. Chem., 1997, 220, 223 CAS.
- P. Jauhari and N. H. Hashmi, Proc. Indian Natl. Sci. Acad., 1994, 60A, 675 Search PubMed.
- J. M. Deely and J. E. Fergusson, Sci. Total Environ., 1994, 153, 97 CrossRef CAS.
-
E. Browne and C. E. Firestone, Table of Radioactive Isotopes,
ed. V. S. Shirley, Wiley, New York, 1986 Search PubMed.
- F. De Corte and A. Simonits, J. Radioanal. Nucl. Chem., 1989, 133, 43 CAS.
-
R. N. Acharya, A. G. C. Nair, P. P. Burte, A. V. R. Reddy and S. B. Manohar, BARC report, BARC/1995/E/007, BARC, Trombay, Mumbai, 1995 Search PubMed.
- R. Carpenter, J. T. Bennett and M. L. Peterson, Geochim. Cosmochim. Acta, 1981, 45, 1155 CrossRef CAS.
- R. Carpenter, M. L. Peterson and J. T. Bennett, Mar. Geol., 1982, 48, 135 CrossRef CAS.
- R. Carpenter, M. L. Peterson and J. T. Bennett, Mar. Geol., 1985, 64, 291 CrossRef CAS.
- U. Sravana Kumar, S. V. Navada, S. M. Rao, R. M. P. Nachiappan, B. Kumar, T. M. Krishnamoorthy, S. K. Jha and V. K. Shukla, Appl. Radiat. Isot., 1999, 51, 97 Search PubMed.
- IAEA, AQCS Catalogue for Reference Materials and Intercomparison Exercises, International Atomic Energy Agency, Vienna, 1998/1999 Search PubMed.
- M. Wahlen and R. C. Thompson, Geochim. Cosmochim. Acta, 1980, 44, 333 CrossRef CAS.
- W. G. Bryan and W. J. Langstan, Environ. Pollut., 1992, 76, 39 CrossRef CAS.
- J. O. Nriagu and J. M. Pacyna, Nature, 1988, 333, 134 CrossRef CAS.
-
S. B. Chavan, S. K. Jha, B. S. Negi
and S. Sadasivan, Proc. of 10th National Symposium on Environment, 2001, held at B.A.R.C., Mumbai, India, published by Board of Research in Nuclear Sciences, pp. 54–57.
-
J. P. N. L. R. Van Eysinga, in Environmental Chemistry, The Royal Society of Chemistry, Cambridge, UK, 1980, vol. 2 (Specialist Periodical Report), p. 186 Search PubMed.
- J. G. Farmer and J. D. Cross, Water, Air Soil Pollut., 1978, 9, 193 CrossRef CAS.
- J. Blasco, V. Saenz and A. Gomez-Parra, Sci. Total Environ., 2000, 247, 189 CrossRef CAS.
|
| This journal is © The Royal Society of Chemistry 2002 |
Click here to see how this site uses Cookies. View our privacy policy here.