Lanthanide complexes of 1,3,5-triamino-1,3,5-trideoxy-cis-inositol: evidence for heterotrinuclear species in aqueous solution†
Received 13th June 2001, Accepted 8th October 2001
First published on 28th November 2001
Abstract
1,3,5-Triamino-1,3,5-trideoxy-cis-inositol (L) gives trinuclear complexes of trivalent lanthanide cations, [Ln3L2H−6]3+. In this contribution, we demonstrate the capability of this cyclohexanic ligand to form heterotrinuclear complexes of 4f cations in aqueous solutions containing mixtures of rare-earths. Electrospray ionization mass spectra clearly show the presence of heterometallic complexes together with the corresponding homonuclear species. Moreover, these compounds have very characteristic 1H and 13C NMR parameters; paramagnetic chemical shifts and longitudinal relaxation times are typical of the lanthanide cations inserted in the complexes. Potentiometric analysis of solutions containing two different lanthanide salts affords the stability constants of the heterotrimetallic [Ln2Ln′L2H−6]3+ complexes. Furthermore, 1H
NMR titrations show the appearance of the complexes in order of stability as the pH is increased and confirm the potentiometry results. The order of trinuclear complex stabilities deduced from these experiments is: Nd3 < Nd2Sm < Nd2Eu < NdSm2 < NdSmEu ∼ NdEu2 < Sm3 < Sm2Eu < Eu3 < SmEu2. These constants are compared to the statistical introduction of the three lanthanide cations in [Ln2Ln′L2H−6]3+ complexes and the deviations suggest that the ionic recognition between the metallic sites is quite limited when the lanthanide cations are close in the 4f series.
Introduction
Trivalent lanthanide coordination chemistry has received increasing attention in the few past decades because of the characteristic magnetic and photophysical properties of their compounds.1 Practical applications soon emerged in the field of shift reagents in analytical chemistry2 and in separation science.3,4 More recently, research on the chemistry of rare-earth metal ions has focused on their potential uses in biomedical applications, taking advantage of the electronic and magnetic properties of complexes of these elements. For example, paramagnetic gadolinium(III) complexes find utility as contrast agents for magnetic resonance imaging (MRI),5–7 luminescent probes such as fluoroimmunoassays,8 and catalysts for the cleavage of RNA and DNA.9,10The physico-chemical properties of metallic compounds can be extended by the introduction of several different ions into chemical architectures. Numerous 3d–4f heterometallic systems have been investigated, mainly to rationalize the weak magnetic exchange interactions between d- and f-block ions.11–18 Less research has been devoted to 4f polymetallic systems.19 Homodi- and trinuclear lanthanide(III) complexes have been described with macrocyclic ligands,20–22 calix[8]arene,23 and an iminophenolate cryptand.24,25 Some flexible tripodal26 and tetrapodal27 ligands give M3L2 homotrimetallic compounds. Self-assembled dinuclear lanthanide(III) helicates
have been the subject of extensive studies in the solid state and in solution.28–31 In contrast to 3d–4f heterometallic systems, only a few reports describe heterodimetallic f–f complexes. The preparation of such species requires the recognition of each lanthanide ion in a specific coordination site and represents a real challenge because lanthanide(III) cations are very similar. Statistical mixtures of homo- and heterodimetallic 4f complexes have been spectroscopically analysed20,29,32–34 and the energy-transfer processes between the two lanthanide ions have been studied by luminescence. But, to our knowledge, only one heterodimetallic complex has been characterized in the solid state.35
In the course of our investigations of lanthanide(III) complexation by some cyclohexane-based ligands,36,37 the molecule 1,3,5-triamino-1,3,5-trideoxy-cis-inositol (TACI)38,39 attracted our attention because it gives some trinuclear lanthanoid complexes with an unusual sandwich-type structure I (Scheme 1).40 The [Gd3(TACIH−3)2(H2O)6]3+ complex has been especially studied as a model compound from the point of view of MRI.41 Recently, an extensive study of lanthanide(III) complexation by TACI (L) has shown that the [Ln3L2H−6]3+ complex was the only metallic complex present in solution over the entire 4f series, and that the thermodynamic stability
constants for complex formation (see equilibrium 1) were very dependent on the cation radius,42 as evidenced in Fig. 1.43 Furthermore, the isostructurality of these complexes from praseodymium to ytterbium has been demonstrated by the analysis of the proton paramagnetic NMR chemical shifts.
| | | 3 Ln3+
+ 2 L ⇌ [Ln3L2H−6]3+
+ 6 H+ | (1) |
![[Ln3L2H−6]3+ complex formation constants (logβ32–6) according to equilibrium 1 as a function of lanthanide(iii) ionic radii.](/image/article/2002/DT/b105173n/b105173n-f1.gif) |
| | Fig. 1 [Ln3L2H−6]3+ complex formation constants (logβ32–6) according to equilibrium 1 as a function of lanthanide(III) ionic radii. | |
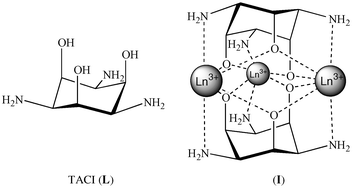 |
| | Scheme 1 | |
In this contribution, the formation of 4f heterotrinuclear complexes of TACI in aqueous solution will be discussed. The characterization of these trinuclear species relies on the combination of electrospray ionization mass spectrometry and paramagnetic solution NMR. Moreover, for the neodymium–samarium–europium triplet, potentiometric titrations have been performed in the presence of two different lanthanide salts in order to get a precise knowledge of heterometallic complex stabilities in aqueous solution. Their thermodynamic formation constants have then been determined and are compared to those of the corresponding homotrinuclear species, as well as to the expected statistical values calculated in a simple model.
Results and discussion
Mass spectrometry studies
Electrospray ionization mass spectrometry (ES-MS) has been shown to be a suitable technique to characterize qualitatively preformed ions in solution44 and, moreover, has been used for the identification of supramolecular coordination complexes.45–47 It is a gentle ionization method that minimizes the fragmentation of the analyte molecules. Many lanthanides possess several isotopes and the MS peak patterns are therefore characteristic of the nature and the number of cations present in the compounds. This allows easy identification of polymetallic species.48 Mass spectrometry has previously been used to demonstrate the exclusive formation of trinuclear complexes of trivalent lanthanide cations with TACI. Whatever the metal to ligand ratio and the pH are, the ES-MS spectra show three major peak envelopes which correspond to the monocharged ions [Ln3L2H−6(OTf)2]+,
[Ln3L2H−6(OTf)(OH)]+, and [Ln3L2H−6(OH)2]+. For polyisotopic lanthanides, each envelope has the isotopic pattern characteristic of a trimetallic complex.ES-MS was used here to investigate the formation of heterotrimetallic complexes of ligand TACI, including different lanthanides in the same structure. Solutions of two lanthanide triflates and ligand TACI (L) in presence of triethylamine at constant pH were analysed for the following stoichiometric conditions: Ln3L2, Ln2Ln′L2, Ln1.5Ln′1.5L2, LnLn′2L2, and Ln′3L2. The ES-MS spectra of samples containing Eu3+ and Tm3+ reveal the presence of heterotrinuclear complexes together with the previously identified homotrinuclear species, as evidenced in Fig. 2. Europium has 2 isotopes (151Eu, 47.80; 153Eu, 52.20%), whereas thulium has only one (169Tm, 100%). [Eu3L2H−6]3+ peak patterns thus
look roughly like quartets, [Eu2TmL2H−6]3+ like triplets, [EuTm2L2H−6]3+ like doublets and [Tm3L2H−6]3+ like singlets. Although ES-MS does not allow any quantitative analysis, it can be seen in Fig. 2 that the peak intensities are dependent on the initial ratio between the 2 metals. When the Eu ∶ Tm ratio is 1 ∶ 2 [Fig. 2(b)], the peak corresponding to the homotrinuclear complex of thulium is much more intense than the other signals, whereas when the Eu ∶ Tm ratio is 2 ∶ 1 [Fig. 2(c)], the signals of species containing europium are more intense. The spectra are much more dense in the case of the Nd–Eu couple. Neodymium has several isotopes (142Nd, 27.13; 143Nd, 12.18; 144Nd,
23.80; 145Nd, 8.30; 146Nd, 17.19; 148Nd, 5.76; 150Nd, 5.64%) and the peak patterns of the homo- and heterotrinuclear complexes containing this metal are therefore much more complicated. Careful analysis of the ES-MS spectrum shows nevertheless the overlapping peak envelopes of the polymetallic species containing Nd and Eu. Relevant data are reported in Table 1 for different lanthanide couples. In every case, the ES-MS spectra indicate the presence of the four expected homo- and heterotrinuclear complexes, [Ln3L2H−6(X)(Y)]+, [Ln2Ln′L2H−6(X)(Y)]+, [LnLn′2L2H−6(X)(Y)]+, and [Ln′3L2H−6(X)(Y)]+, where X and Y are either OTf or OH.
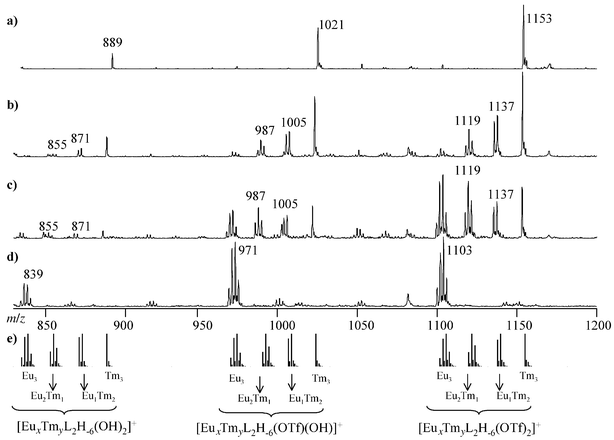 |
| | Fig. 2 Theoretical and experimental ES-MS spectra of samples containing Eu(OTf)3, Tm(OTf)3, and TACI at pH 8 in water for different Eu ∶ Tm ∶ L ratios: (a) 0 ∶ 3 ∶ 2; (b) 1 ∶ 2 ∶ 2; (c) 2 ∶ 1 ∶ 2; (d) 3 ∶ 0 ∶ 2. (e) Theoretical isotope distributions. | |
Table 1 Electrospray mass spectrometric data (m/z) for Ln(OTf)3–Ln′(OTf)3–TACI samples at pH 8 in watera
| Complex | Ln–Ln′ couple |
|---|
| Nd–Eu | Pr–Eu | Eu–Tb | Eu–Ho | Eu–Tm | Eu–Lu | Tm–Lu |
|---|
| Only the m/z peaks corresponding to the most abundant isotopic mass are reported. |
|---|
| [Ln3L2H−6(OTf)2]+ | 1078 | 1069 | 1103 | 1103 | 1103 | 1103 | 1153 |
| [Ln3L2H−6(OTf)(OH)]+ | 946 | 937 | 971 | 971 | 971 | 971 | 1021 |
| [Ln3L2H−6(OH)2]+ | 814 | 805 | 839 | 839 | 839 | 839 | 889 |
| [Ln2Ln′L2H−6(OTf)2]+ | 1085 | 1081 | 1109 | 1115 | 1119 | 1125 | 1159 |
| [Ln2Ln′L2H−6(OTf)(OH)]+ | 953 | 949 | 977 | 983 | 987 | 993 | 1027 |
| [Ln2Ln′L2H−6(OH)2]+ | 821 | 817 | 845 | 851 | 855 | 861 | 895 |
| [LnLn′2L2H−6(OTf)2]+ | 1094 | 1091 | 1117 | 1129 | 1137 | 1149 | 1165 |
| [LnLn′2L2H−6(OTf)(OH)]+ | 962 | 959 | 985 | 997 | 1005 | 1017 | 1033 |
| [LnLn′2L2H−6(OH)2]+ | 830 | 827 | 853 | 865 | 873 | 885 | 901 |
| [Ln′3L2H−6(OTf)2]+ | 1103 | 1103 | 1123 | 1141 | 1153 | 1171 | 1171 |
| [Ln′3L2H−6(OTf)(OH)]+ | 971 | 971 | 991 | 1009 | 1021 | 1039 | 1039 |
| [Ln′3L2H−6(OH)2]+ | 839 | 839 | 859 | 877 | 889 | 907 | 907 |
Heteronuclear complex characterization by solution NMR
ES-MS gives information about species in the mass spectrometer source, and thus in the gas phase. The presence of these compounds in solution has therefore to be confirmed by other characterization techniques, such as solution NMR. A detailed NMR analysis was thus undertaken with three well-chosen lanthanide cations. Neodymium, samarium, and europium are good candidates: although they are paramagnetic, they induce reasonable paramagnetic relaxation times, allowing 2D-NMR experiments to be performed. The proton NMR spectra of samples containing two lanthanide salts together with the ligand TACI at pD 8, displays twelve well-resolved resonances characteristic of a mixture of paramagnetic complexes, as shown in Fig. 3 for the Nd–Eu couple. The homotrinuclear species, having D3h symmetry give rise to two proton NMR signals, one corresponding to the nucleus HN (Nd: 21.8; Sm: 5.5; Eu: −21.5 ppm) and the other to HO
(Nd: 19.1; Sm: 6.4; Eu: −14.4 ppm). The heterometallic complexes incorporating two different lanthanide cations, [Ln2Ln′L2H−6]3+, have a lower symmetry, C2v, and show four proton NMR signals: HNLn(Ln,Ln′) (intensity 2), HNLn′(Ln,Ln) (intensity 1), HOLn,Ln(Ln′) (intensity 1), and HOLn,Ln′(Ln) (intensity 2), according to the nucleus nomenclature described in Scheme 2. These protons possess very characteristic paramagnetic chemical shifts and longitudinal relaxation times, both depending on the metals present in the complex. Proton chemical shifts were assigned by 1H–1H COSY experiments and longitudinal relaxation time measurements, whereas carbon chemical shifts were obtained by performing 1H–13C HMQC (heteronuclear
multiple quantum coherence) experiments. The typical paramagnetic NMR properties of these six heterotrinuclear complexes are given in Table 2. These solution NMR studies show that the two heterotrinuclear complexes are present in aqueous solution together with the two corresponding homotrinuclear species, confirming that the four trimetallic compounds detected in the ES-MS spectra are preformed in aqueous solution.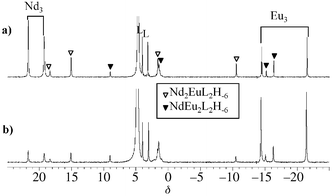 |
| | Fig. 3 400 MHz 1H NMR spectra of Nd–Eu–TACI samples in D2O at pD 8 and 298 K for Nd ∶ Eu ∶ TACI ratios: (a) 2 ∶ 1 ∶ 2; (b) 1 ∶ 2 ∶ 2. | |
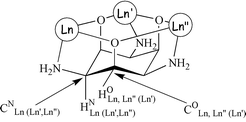 |
| | Scheme 2 1H and 13C labelling scheme in NMR spectra. | |
Table 2 Proton chemical shifts (δH), longitudinal relaxation times (T1H), and carbon chemical shifts (δC) of the heterotrinuclear complexes [Ln2Ln′L2H−6]3+, where Ln and Ln′ are Nd, Sm, or Eu, in D2O at 400 MHz and 298 K
| Ln2Ln′ | XNLn(Ln,Ln′) | XNLn′(Ln,Ln) | XOLn,Ln(Ln′) | XOLn,Ln′(Ln) |
|---|
| | δH/ppm | T1H/ms | δC/ppm | δH/ppm | T1H/ms | δC/ppm | δH/ppm | T1H/ms | δC/ppm | δH/ppm | T1H/ms | δC/ppm |
|---|
| Nd2Sm | 19.0 | 24 | 60 | 10.4 | 4.9 | 86 | 18.2 | 11 | 31 | 13.0 | 18 | 57 |
| Sm2Nd | 7.9 | 87 | 75 | 16.3 | 32 | 49 | 7.1 | 87 | 84 | 12.1 | 20 | 58 |
| Nd2Eu | 14.9 | 21 | 42 | −10.4 | 31 | 103 | 18.2 | 11 | 35 | 1.6 | 14 | 97 |
| Eu2Nd | −16.2 | 37 | 74 | 9.0 | 24 | 13 | −15 | 24 | 162 | 1.5 | 15 | 102 |
| Sm2Eu | 2.0 | 148 | 46 | −14.9 | 79 | 81 | 6.6 | 116 | 89 | −4.4 | 50 | 124 |
| Eu2Sm | −18.3 | 59 | 64 | −1.4 | 94 | 29 | −15.1 | 32 | 163 | −3.9 | 40 | 129 |
The complex simultaneously incorporating the three different cations, [NdSmEuL2H−6]3+, was identified by its six proton and six carbon resonances due to its Cs symmetry in solution. The proton NMR spectra of samples containing the 3 triflate salts and the ligand in the Nd ∶ Sm ∶ Eu ∶ L ratio 1 ∶ 1 ∶ 1 ∶ 2 show signals due to the previously identified complexes, [Ln3L2H−6]3+ and [Ln2Ln′L2H−6]3+, described above. In addition to these resonances, the six proton signals of [NdSmEuL2H−6]3+ were detected and assigned via a 1H–1H COSY experiment. A 1H–13C HMQC experiment gave the assignment of the six carbons (see Table 3 and Scheme
2 for nucleus labelling).
Table 3 Proton (δH) and carbon (δC) chemical shifts of the heterotrinuclear complex [NdSmEuL2H−6]3+ in D2O at 298 K
| | δH/ppm | δC/ppm |
|---|
| XNEu(Nd,Sm) | −12.8 | 92 |
| XNSm(Nd,Eu) | 4.2 | 57 |
| XNNd(Sm,Eu) | 12.7 | 31 |
| XONd,Sm(Eu) | 12.4 | 62 |
| XONd,Eu(Sm) | 1.1 | 98 |
| XOSm,Eu(Nd) | −4.0 | 123 |
Heteronuclear complexes have lower symmetry (C2v or Cs) than the homotrinuclear species (D3h), and intramolecular dynamic processes in solution could therefore be investigated by using two-dimensional exchange spectroscopy (EXSY). At 400 MHz and 298 K, no exchange correlations are detected in the EXSY spectra. The proton paramagnetic relaxation times for the trinuclear complexes containing neodymium, samarium, and europium are quite small (10 < T1 < 150 ms), and therefore the mixing time (τm) used in the EXSY sequence cannot exceed 20 ms. During that short mixing time, no magnetization exchange could be evidenced because the characteristic time constant of exchange (τex
= 1/kex, kex being the pseudo-first-order rate constant for exchange) is too long in comparison to the mixing time τm.
By working at higher temperature, two effects which favour the observation of exchange correlations combine. Firstly, τex becomes shorter because the kinetics of exchange are speeded up. Secondly, the paramagnetic relaxation times are longer, essentially due to the T2 dependence of the Curie contribution49 and the mixing time could thus be lengthened to 70 ms, allowing the detection of exchange correlation at 363 K. The EXSY spectrum registered at 400 MHz and 363 K on a sample containing the three salts and TACI in the ratio 1 ∶ 1 ∶ 1 ∶ 3 is presented in Fig. 4. Some nuclear Overhauser effects (nOe) are detected in the complexes whose protons don't relax too fast, that is complexes that don't contain the neodymium cation. Weak exchange correlations are detected between the free ligand and the complexes, corresponding to complexation decomplexation processes. No exchange
correlations are seen between protons belonging to two different complexes, whereas strong ones are detected between protons belonging to the same complex. They are symbolized by squares and circles in Fig. 4 for HO and HN, respectively in the [NdSmEuL2H−6]3+ complex. These latter correlations are indicative of an intramolecular rotation of the ligand with respect to the lanthanide ions that moves, for instance, a proton HN, which is close to a europium cation, to a position close to a neodymium ion. Similar 2D-EXSY spectra have been obtained with samples containing the ligand and only two salts.
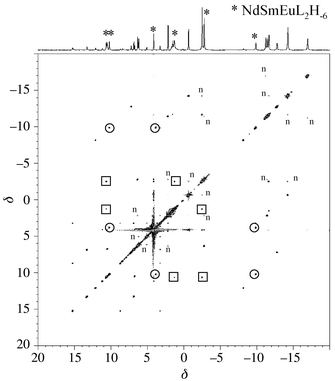 |
| | Fig. 4 400 MHz EXSY spectrum of a Nd–Sm–Eu–TACI (1 ∶ 1 ∶ 1 ∶ 3) sample in D2O at pD 8 and 363 K (τm
= 70 ms). ○: HN exchange correlations in the NdSmEuL2H−6 complex; □: HO exchange correlations in the NdSmEuL2H−6 complex; n: nOe effects. | |
The evolution of the proton NMR spectra as a function of pD allows estimation of the relative stabilities of the trinuclear complexes, since the more stable a complex is, the lower its formation pH. Samples containing Nd, Sm, Eu, and TACI(HCl)3 in the ratio 1 ∶ 1 ∶ 1 ∶ 3 have been titrated with sodium deuteroxide and some of the spectra registered are shown in Fig. 5. The formation of the complexes can be clearly seen when the pD is increased. Initially, when no sodium deuteroxide is added, only 2 signals at 3.68 and 4.41 ppm due to the protonated ligand are detected. Then, when base is added, the signals from the paramagnetic complexes start to grow. The most stable species, containing europium and samarium, are detected at the lowest pD. Eu3L2H−6 and Eu2SmL2H−6 appear first at pD = 6.63 [Fig. 5(a)], then EuSm2L2H−6
and Sm3L2H−6 are detected at pD = 6.86 [Fig. 5(b)]. Signals due to NdEu2L2H−6 and NdSmEuL2H−6 begin to appear at pD = 7.09 closely followed by NdSm2L2H−6 at pD = 7.23 [Fig. 5(c)]. The last complexes to be detected are those containing two or three neodymium cations; Nd2SmL2H−6 and Nd2EuL2H−6 at pD = 7.63 [Fig. 5(d)], and finally the least stable Nd3L2H−6 complex at pD = 8.20. The order of appearance of the homotrinuclear species as the pD increases is consistent with their formation constants, β32–6 (Nd3 < Sm3 < Eu3).43
From these experiments, it is possible to roughly classify the trinuclear complexes according to their thermodynamic stabilities in the orderNd3 < Nd2Sm ∼ Nd2Eu < NdSm2 < NdSmEu ∼ NdEu2 < Sm3
∼ Sm2Eu < Eu3
∼ SmEu2.
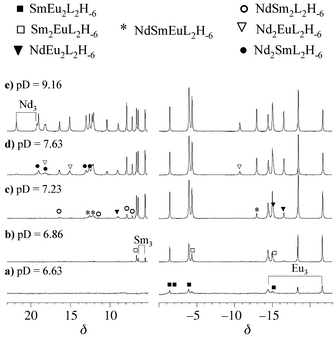 |
| | Fig. 5 500 MHz 1H NMR spectra of a sample containing Nd, Sm, Eu, and TACI(HCl)3 in the ratio 1 ∶ 1 ∶ 1 ∶ 3, in D2O as a function of pD. | |
Thermodynamic constant determination
The formation constants of the homotrinuclear complexes have previously been determined by potentiometric titrations; logβ32–6, according to equilibrium 1, is −24.1, −19.3, and −17.9 for Nd3L2H−6, Sm3L2H−6, and Eu3L2H−6, respectively.43 Similar experiments were run with a mixture of two lanthanide ions in order to calculate the stability constants of the heterotrinuclear species identified by ES-MS and solution NMR. Samples containing the protonated ligand L(HCl)3 and two lanthanide chloride salts in the Ln ∶ Ln′
∶ L ratios, 2 ∶ 1 ∶ 2 and 1 ∶ 2 ∶ 2 were titrated with potassium hydroxide at 298 K and in 0.1 mol L−1 KCl for the three couples Nd–Eu, Nd–Sm, and Sm–Eu. The experimental
curves for the Nd–Eu system are shown in Fig. 6; the formation of the complexes is characterized by the low slope of the curve in the pH range 6 to 8, which is very sensitive to the nature of the trinuclear species formed. The experimental data were analysed using the program Hyperquad 2000.50 The ligand protonation constants and the homotrinuclear complex formation constants (logβ32–6) were fixed to the values previously calculated, and the stability constants of the 2 heterotrinuclear complexes, β212–6 according to equilibrium 2, were refined in the pH range 5 to 8.| | | 2 Ln3+
+ 1 Ln′3+
+ 2 L ⇌ [Ln2Ln′L2H−6]3+
+ 6 H+ | (2) |
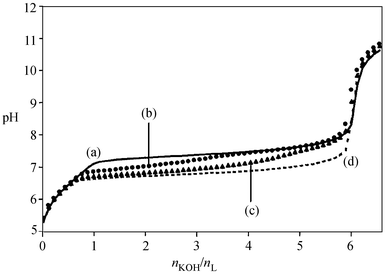 |
| | Fig. 6 Alkalimetric titrations of aqueous solutions containing 10−3 mol L−1 L(HCl)3 and different Nd ∶ Eu ratios at 298 K and 0.1 mol L−1 KCl. Nd ∶ Eu ∶ L ratios: (a) 3 ∶ 0 ∶ 2, (b) 2 ∶ 1 ∶ 2, (c) 1 ∶ 2 ∶ 2, (d) 0 ∶ 3 ∶2. | |
Fig. 7 shows the comparison between experimental points and simulated titrations in the program HYSS50 in the significant pH range for the Sm–Eu system. The simulated curves obtained considering only the homotrinuclear complex formation constants (broken lines) show a large deviation from the experimental points. Even for these two cations, which are very similar (europium is next to samarium in the periodic table) and whose homotrinuclear complex stability constants are very close, it is obvious that the heteronuclear complexes have to be considered to simulate the experimental data. The heterotrinuclear complex stability constants have been determined for the six heterometallic species and are given in Table 4. Except for the SmEu2L2H−6 complex, the heavier the three lanthanide cations inserted in the structure are, the more stable the species
is. These thermodynamic stability constants measured by potentiometry are totally in accordance with the stability scale determined by 1H NMR titration. Since the NdSmEuL2H−6 complex is formed in the same pH range as NdEu2L2H−6, as shown by NMR, the logarithm of its stability constant can therefore be expected to be close to −20.1.
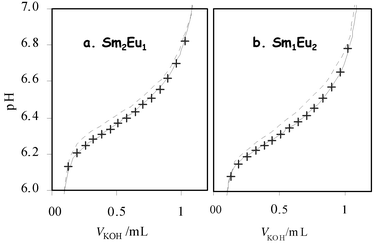 |
| | Fig. 7 Experimental and calculated titration curves for Sm–Eu–L samples: (a) 2 ∶ 1 ∶ 2; (b) 1 ∶ 2 ∶ 2. Crosses are experimental points. Broken lines are calculated data50 considering only homotrinuclear complex stability constants. Full lines are calculated data50 considering homo- and heterotrinuclear complex stability constants. | |
Table 4 Stability constants of trinuclear lanthanide complexes of TACI in water at 298 K and I
= 0.1 mol L−1 (KCl): [Ln3L2H−6]3+, logβ32–6
= [Ln3L2H−63+][H+]6/[Ln3+]3[L]2; [Ln2Ln′L2H−6]3+, logβ212–6
= [Ln2Ln′L2H−63+][H+]6/[Ln3+]2[Ln′3+][L]2; E
=
−RT(lnβ
− lnβstat)
| Complex | logβ212–6 | logβstat | E/kJ mol−1 |
|---|
| Nd3L2H−6 | −24.09 ± 0.01 | | |
| Sm3L2H−6 | −19.29 ± 0.02 | | |
| Eu3L2H−6 | −17.93 ± 0.01 | | |
| Nd2SmL2H−6 | −22.4 ± 0.3 | −22.0 | +2.3 |
| Nd2EuL2H−6 | −21.7 ± 0.2 | −21.5 | — |
| NdSm2L2H−6 | −20.5 ± 0.1 | −20.4 | — |
| NdEu2L2H−6 | −20.1 ± 0.5 | −19.5 | +3.4 |
| Sm2EuL2H−6 | −18.8 ± 0.3 | −18.4 | +2.3 |
| SmEu2L2H−6 | −17.68 ± 0.06 | −17.91 | −1.3 |
| NdSmEuL2H−6 | −20.1 ± 0.5 | −19.7 | — |
The knowledge of every stability constant affords a predictive quantitative model for the formation of heterotrinuclear lanthanide complexes of TACI. Fig. 8 and 9 show the speciation of the different trinuclear complexes present in aqueous solution, deduced from potentiometry measurements, with respect to external conditions such as stoichiometry, concentrations, and pH. As evidenced in Fig. 8, the evolution of the complex distributions as a function of pH is very dependent on the lanthanide couple studied. For the Nd–Eu system, the most stable Eu3 complex is formed at pH 6.1 and is consumed at higher pH to allow the formation of the two heterotrinuclear species, NdEu2 and Nd2Eu. In the second case, for the Sm–Eu couple [Fig. 8(b)], the SmEu2 heterometallic complex, which is slightly more stable than Eu3,
is formed first and remains preponderant during the whole titration. The distributions can also be predicted as a function of the ratio of the two metals, as shown in Fig. 9 for the Sm–Eu couple at pH 8. It appears that SmEu2 complex formation is particularly favoured, it represents more than 60% of the ligand in solution when Sm ∶ Eu = 1 ∶ 2.
![Species distribution in equilibrated aqueous solutions with [L]0
= 0.001 mol L−1, [Eu]0
= 0.001 mol L−1, and [Ln]0
= 0.0005 mol L−1: (a) Ln = Nd, (b) Ln = Sm. The stability constants listed in Table 4 were used for the calculations.](/image/article/2002/DT/b105173n/b105173n-f8.gif) |
| | Fig. 8 Species distribution in equilibrated aqueous solutions with [L]0
= 0.001 mol L−1, [Eu]0
= 0.001 mol L−1, and [Ln]0
= 0.0005 mol L−1: (a) Ln = Nd, (b) Ln = Sm. The stability constants listed in Table 4 were used for the calculations. | |
![Species distribution in an equilibrated aqueous solution at pH = 8 with [L]0
= 0.001 mol L−1 and [Eu]0
+ [Sm]0
= 0.0015 mol L−1.](/image/article/2002/DT/b105173n/b105173n-f9.gif) |
| | Fig. 9 Species distribution in an equilibrated aqueous solution at pH = 8 with [L]0
= 0.001 mol L−1 and [Eu]0
+ [Sm]0
= 0.0015 mol L−1. | |
In order to selectively produce heterotrimetallic complexes, it is essential to detect species whose distributions deviate from the statistics. The thermodynamic stability constants obtained under statistical conditions may be predicted according to a very simple model if the two ligands are considered as a ‘cluster’, see eqn. 3. The term log(s) comes from statistical entropic considerations that take into account the number of different arrangements allowed in heterotrinuclear complexes compared to homotrimetallic species.
| | | log(βLnLn′Ln″L2H−6stat) = 1/3[log(β32–6Ln) + log(β32–6Ln′) + log(β32–6Ln″)] + log(s) | (3) |
| | | s
= 3 if Ln = Ln′
≠ Ln″ |
(4)
|
| | | s
= 6 if Ln ≠ Ln′
≠ Ln″ |
(5)
|
The stability constants calculated according to this simple model are given in Table 4 and the deviations from the expected statistics are expressed in kJ mol−1 when the difference between the calculated and the measured stability constants were significant (see Table 4). These deviations are small, between −1 and +3 kJ mol−1, signifying that the distributions are close to the statistical ones. The formation of heterotrinuclear complexes of TACI incorporating the very similar Nd, Sm, and Eu trivalent cations is globally unfavourable, except for the SmEu2 species, which is stabilized by 1 kJ mol−1 in comparison to the statistics. These results indicate that there is only little ionic recognition between the metallic sites, when the lanthanide cations are close in the 4f series.
Conclusion
The 1,3,5-triamino-1,3,5-trideoxy-cis-inositol gives uncommon trinuclear complexes of trivalent lanthanide cations, [Ln3L2H−6]3+. In this work, the capability of this cyclohexanic ligand to form rare-earth heterotrinuclear complexes in solution has been demonstrated. In aqueous solutions containing different 4f cations, a mixture of homo- and heterotrinuclear complexes is indeed evidenced by electrospray ionization mass spectrometry and paramagnetic solution NMR. The potentiometric analysis of the Nd–Sm–Eu–TACI system has shown that the heteronuclear complex stabilities are in between those of the corresponding homotrinuclear complexes. Globally, the heavier the three metals are, the more stable the trinuclear complex is. The complex simultaneously incorporating three different cations, [NdSmEuL2H−6]3+, is also formed in solution, as evidenced by its typical 1H
and 13C NMR chemical shifts. Its stability is close to that of the [NdEu2L2H−6]3+ species, as evidenced by 1H NMR titrations as a function of pH.The combination of complementary experimental methods, like electrospray ionization mass spectrometry, solution NMR, and potentiometry, affords a predictive quantitative model. It is now possible to anticipate appropriate conditions, for instance initial stoichiometries and pH, that will favour formation of one specific trinuclear complex. Comparison of the stability constants measured by potentiometry with the statistical introduction of different lanthanide cations in the heterotrinuclear complexes allows the detection of species whose distributions deviate from the statistics. For the trio studied in this work, Nd–Sm–Eu, only small significant deviations are observed. The ionic recognition between the metallic sites is thus very limited, probably because these three lanthanide cations are close in the 4f series, and hence very similar. We are presently studying other Ln–Ln′–TACI systems to see if the results obtained with the Nd–Sm–Eu trio
can be generalized. The effects of lanthanide position in the series on heteronuclear complex stabilities and structures are currently under investigation.
Experimental
Materials
Lanthanide chlorides and triflates were commercially available materials of highest possible quality. 1,3,5-Triamino-1,3,5-trideoxy-cis-inositol (TACI) and 1,3,5-triamino-1,3,5-trideoxy-cis-inositol trihydrochloride [TACI(HCl)3] were synthesized according to published procedures.51Mass spectrometry
The mass spectra were acquired on an LCQ-ion trap (Finnigan-Thermoquest, San Jose, CA, USA) equipped with an electrospray source. Electrospray full scan spectra in the range m/z 100–1300 were obtained by infusion through fused silica tubing at 2–10 μL min−1. The solutions were analysed in the positive mode. The LCQ calibration (m/z 50–2000) was achieved according to the standard calibration procedure from the manufacturer (mixture of caffeine, MRFA and Ultramark 1621). The temperature of the heated capillary of the LCQ was set to 170 °C, the ion-spray voltage was in the range of 1–6 kV with an injection time of 5–200 ms. Samples for ES-MS were prepared by dissolving the ligand (10−3 mol L−1) and the lanthanide triflate salts in water. pH was then adjusted with triethylamine (pH = 8).Potentiometry
All titrant solutions were prepared using water purified by passage through a Millipore Milli-Q reverse-osmosis cartridge system (resistivity 18 MΩ cm). Carbonate-free 0.1 mol L−1 KOH and 0.1 M HCl were prepared from Fisher Chemicals concentrates. Potentiometric titrations were performed in 0.1 mol L−1 aqueous KCl under an argon atmosphere, the temperature was controlled to ±0.1 °C with a circulating water bath. The p[H] (p[H] =
−log[H+], concentration in molarity) was measured in each titration with a combined pH glass electrode (Metrohm) filled with 3 M KCl and the titrant addition was automated by use of a 751 GPD titrino (Metrohm). The electrode was calibrated in hydrogen ion concentration by titration of HCl with KOH in 0.1 mol L−1 KCl.52 A plot of meter reading versus p[H] allows the determination of the electrode standard potential (E°)
and the slope factor (f). Continuous potentiometric titrations with KOH 0.1 mol L−1 were conducted on 20 mL of aqueous solutions containing 10−3 mol L−1 TACI(HCl)3, 10−3 mol L−1 LnCl3, 0.5 × 10⁻³ mol L−1 Ln′Cl3 and 0.1 mol L−1 KCl. Ligand concentrations were determined by potentiometric titration, and the metal concentrations by EDTA titrations using xylenol orange indicator. Back titration with 0.1 mol L−1 HCl was performed after each experiment to check whether equilibration had been achieved. 100 points were measured, with a 5 min delay between the measurement of each point.Experimental data were refined using the computer program Hyperquad 2000.50,53 All equilibrium constants are concentration quotients rather than activities. The ionic product of water at 25 °C and 0.1 mol L−1 ionic strength is pKw
= 13.78.54 For the determination of heteronuclear complex stability constants, βwxyz
= [LnwLn′xLyHz]/[Ln]w[Ln′]x[L]y[H]z, fixed values were used for pKw, ligand acidity constants (pKa1
= 6.01, pKa2
= 7.43, pKa3
= 8.84), homotrinuclear complex stability constants,43 and
total concentrations of metal, ligand, and acid. All values and errors (one standard deviation) reported represent the average of at least three independent experiments.
NMR spectroscopy
Samples for NMR spectroscopy were prepared by dissolving the ligand (10−2 to 10−3 mol L−1) and the lanthanide triflate salt in 700 μL of deuterium oxide (Euriso-top, 99.9 atom% D). pD was then adjusted with a sodium deuteroxide solution (pD = pHread
+ 0.41).55 NMR spectra were recorded either on AVANCE 400, 500 Bruker, or MERCURY 400 Varian spectrometers. The methyl protons of DSS [3-(trimethylsilyl)-1-propanesulfonic acid] were used as an external reference for the 1H and 13C spectra recorded in D2O. Longitudinal relaxation rates were measured using a non-selective inversion recovery pulse sequence, and T1 values were obtained from a three-parameter fit of the data to an exponential recovery function. 1H–1H COSY and 1H–13C HMQC spectra were recorded in magnitude
mode using 256 increments and recycle delays optimized for fast-relaxing species. 1H–1H EXSY spectra were registered in phase sensitive mode, using a mixing time of 70 ms at 363 K and 256 increments.Acknowledgements
We thank the Direction du Cycle du Combustible at the Commissariat à l'Energie Atomique for financial support. We gratefully acknowledge J.-M. Latour, P. Maldivi and P. Vottéro for very helpful discussions.References
- J.-C. G. Bünzli and G. R. Choppin, in Lanthanide Probes in Life, Chemical and Earth Sciences, ed. J.-C. G. Bünzli and G. R. Choppin, Elsevier, Amsterdam, 1989 Search PubMed.
- J. H. Forsberg, in Handbook on the Physics and Chemistry of Rare Earths, ed. J. K. A. Gschneidner and L. Eyring, Elsevier, Amsterdam, 1996, vol. 23, pp. 1–68 Search PubMed.
- K. L. Nash, in Handbook on the Physics and Chemistry of
Rare Earths, ed. J. K. A. Gschneidner, L. Eyring, G. R. Choppin and H. H. Lander, Elsevier, Amsterdam, 1994, vol. 18, pp. 197–238 Search PubMed.
- K. L. Nash and M. P. Jensen, in Handbook on the Physics and Chemistry of Rare Earths, ed. J. K. A. Gschneidner and L. Eyring, Elsevier, Amsterdam, 2000, vol. 28, pp. 311–371 Search PubMed.
- P. Caravan, J. J. Ellison, T. J. McMurry and R. B. Lauffer, Chem. Rev., 1999, 99, 2293 CrossRef CAS.
- S. Aime, M. Botta, M. Fasano and E. Terreno, Chem. Soc. Rev., 1998, 27, 19 RSC.
- V. Comblin, D. Gilsoul, M. Hermann, V. Humblet, V. Jacques, M. Mesbahi, C. Sauvage and J. F. Desreux, Coord. Chem. Rev., 1999, 185–186, 451 CrossRef CAS.
- N. Sabbatini, M. Guardigli and J.-M. Lehn, Coord. Chem. Rev., 1993, 123, 201 CrossRef CAS.
- T. C. Bruice, A. Tsubouchi, R. O. Dempcy and L. P. Olson, J. Am. Chem. Soc., 1996, 118, 9867 CrossRef CAS.
- S. J. Oh, Y.-S. Choi, S. Hwangbo, S. C. Bae, J. K. Ku and J. W. Park, Chem. Commun., 1998, 2189 RSC.
- P. Guerriero, S. Tamburini and P. A. Vigato, Coord. Chem. Rev., 1995, 139, 17 CrossRef CAS and references therein.
- O. Kahn, Adv. Inorg. Chem., 1995, 43, 179 Search PubMed and references therein.
- J.-P. Costes, F. Dahan, A. Dupuis and J.-P. Laurent, Chem. Eur. J., 1998, 4, 1616 CrossRef CAS.
- J.-P. Costes, F. Dahan and A. Dupuis, Inorg. Chem., 2000, 39, 165 CrossRef CAS.
- J.-P. Costes, F. Dahan, A. Dupuis and J.-P. Laurent, Inorg. Chem., 2000, 39, 169 CrossRef CAS.
- C. Piguet, C. Edder, S. Rigault, G. Bernardinelli, J.-C. G. Bünzli and G. Hopfgartner, J. Chem. Soc., Dalton Trans., 2000, 3999 RSC.
- C. Edder, C. Piguet, G. Bernardinelli, J. Mareda, C. G. Bochet, J.-C. G. Bünzli and G. Hopfgartner, Inorg. Chem., 2000, 39, 5059 CrossRef CAS.
- Z. Xu, P. W. Read, D. E. Hibbs, M. B. Hursthouse, K. M. A. Malik, B. O. Patrick, S. J. Rettig, M. Seid, D. A. Summers, M. Pink, R. C. Thompson and C. Orvig, Inorg. Chem., 2000, 39, 508 CrossRef CAS.
- C. Piguet and J.-C. G. Bünzli, Chem. Soc. Rev., 1999, 28, 347 RSC.
- K. D. Matthews, I. A. Kahwa and D. J. Williams, Inorg. Chem., 1994, 33, 1382 CrossRef CAS.
- H. C. Aspinall, J. Black, I. Dodd, M. M. Harding and S. J. Winkley, J. Chem. Soc., Dalton Trans., 1993, 709 RSC.
- H. Schumann, U. A. Böttger, H. Weisshoff, B. Ziemer and A. Zschunke, Eur. J. Inorg. Chem., 1999, 1735 CrossRef CAS.
- B. M. Furphy, J. M. Harrowfield, D. L. Kepert, B. W. Skelton, A. H. White and F. R. Wilner, Inorg. Chem., 1987, 26, 4231 CrossRef CAS.
- F. Avecilla, A. de Blas, R. Bastida, D. E. Fenton, J. Mahia, A. Macias, C. Platas, A. Rodriguez and T. Rodriguez-Blas, Chem. Commun., 1999, 125 RSC.
- C. Platas, F. Avecilla, A. de Blas, T. Rodriguez-Blas, C. F. G. C. Geraldes, E. Toth, A. E. Merbach and J.-C. G. Bünzli, J. Chem. Soc., Dalton Trans., 2000, 611 RSC.
- Y. Bretonnière, M. Mazzanti, R. Wietzke and J. Pécaut, Chem. Commun., 2000, 1543 RSC.
- I. A. Setyawati, S. Liu, S. J. Rettig and C. Orvig, Inorg. Chem., 2000, 39, 496 CrossRef CAS.
- S. Rigault, C. Piguet and J.-C. G. Bünzli, J. Chem. Soc., Dalton Trans., 2000, 2045 RSC.
- C. Piguet, J.-C. G. Bünzli, G. Bernardinelli, G. Hopfgardner and A. F. Williams, J. Am. Chem. Soc., 1993, 115, 8197 CrossRef CAS.
- N. Martin, J.-C. G. Bünzli, V. McKee, C. Piguet and G. Hopfgartner, Inorg. Chem., 1998, 37, 577 CrossRef CAS.
- M. Elhabiri, R. Scopelliti, J.-C. G. Bünzli and C. Piguet, J. Am. Chem. Soc., 1999, 121, 10747 CrossRef CAS.
- J.-C. G. Bünzli, P. Froidevaux and J. M. Harrowfield, Inorg. Chem., 1993, 32, 3306 CrossRef CAS.
- P. Froidevaux and J.-C. G. Bünzli, J. Phys. Chem., 1994, 98, 532 CrossRef CAS.
- J.-C. G. Bünzli, P. Froidevaux and C. Piguet, New J. Chem., 1995, 19, 661 Search PubMed.
- J.-P. Costes, F. Dahan, A. Dupuis, S. Lagrave and J.-P. Laurent, Inorg. Chem., 1998, 37, 153 CrossRef CAS.
- C. Husson, P. Delangle, J. Pécaut and P. J. A. Vottéro, Inorg. Chem., 1999, 38, 2012 CrossRef CAS.
- P. Delangle, C. Husson, C. Lebrun, J. Pécaut and P. J. A. Vottéro, Inorg. Chem., 2001, 40, 2953 CrossRef CAS.
- K. Hegetschweiler, Bol. Soc. Chil. Quim., 1997, 42, 257 Search PubMed.
- K. Hegetschweiler, Chem. Soc. Rev., 1999, 28, 239 RSC.
- R. Hedinger, M. Ghisletta, K. Hegetschweiler, E. Toth, A. E. Merbach, R. Sessoli, D. Gatteschi and V. Gramlich, Inorg. Chem., 1998, 37, 6698 CrossRef CAS.
- E. Toth, L. Helm, A. E. Merbach, R. Hedinger, K. Hegetschweiler and A. Janossy, Inorg. Chem., 1998, 37, 4104 CrossRef CAS.
- R. D. Shannon, Acta Crystallogr., Sect. A, 1976, 32, 751.
- D. Chapon, C. Husson, P. Delangle, C. Lebrun and P. J. A. Vottéro, J. Alloys Compd., 2001, 323–324, 128 CrossRef CAS.
- R. D. Smith, J. A. Loo, C. G. Edmonds, C. J. Barinaga and H. R. Udseth, Anal. Chem., 1990, 62, 882 CrossRef CAS.
- E. Leize, A. Van Dorsselaer, R. Krämer and J.-M. Lehn, J. Chem. Soc., Chem. Commun., 1993, 990 RSC.
- G. Hopfgartner, C. Piguet and J. D. Henion, J. Am. Soc. Mass Spectrom., 1994, 5, 748 CrossRef CAS.
- G. Hopfgartner, F. Vilbois and C. Piguet, Rapid Commun. Mass Spectrom., 1999, 13, 302 CrossRef CAS.
- W. J. Evans, M. A. Johnston, C. H. Fujimoto and J. Greaves, Organometallics, 2000, 19, 4258 CrossRef CAS.
- M. D. Kemple, B. D. Ray, K. B. Lipkowitz, F. G. Prendergast and B. D. N. Rao, J. Am. Chem. Soc., 1988, 110, 8275 CrossRef CAS.
- P. Gans, A. Sabatini and A. Vacca, Talanta, 1996, 43, 1739 CrossRef CAS.
- K. Hegetschweiler, I. Erni, W. Schneider and H. Schmalle, Helv. Chim. Acta, 1990, 73, 97 CrossRef CAS.
- A. E. Martell and R. J. Motekaitis, Determination and Use of Stability Constants, VCH, New York, 1992 Search PubMed.
- L. Alderighi, P. Gans, A. Ienco, D. Peters, A. Sabatini and A. Vacca, Coord. Chem. Rev., 1999, 184, 311 CrossRef CAS.
- A. E. Martell and R. M. Smith, Critical Stability Constants, Plenum Press, New York, 1982 Search PubMed.
- P. K. Glasoe and F. A. Long, J. Phys. Chem., 1960, 64, 188 CrossRef CAS.
|
| This journal is © The Royal Society of Chemistry 2002 |
Click here to see how this site uses Cookies. View our privacy policy here. ![[Ln3L2H−6]3+ complex formation constants (logβ32–6) according to equilibrium 1 as a function of lanthanide(iii) ionic radii.](/image/article/2002/DT/b105173n/b105173n-f1.gif)


![Species distribution in equilibrated aqueous solutions with [L]0
= 0.001 mol L−1, [Eu]0
= 0.001 mol L−1, and [Ln]0
= 0.0005 mol L−1: (a) Ln = Nd, (b) Ln = Sm. The stability constants listed in Table 4 were used for the calculations.](/image/article/2002/DT/b105173n/b105173n-f8.gif)
![Species distribution in an equilibrated aqueous solution at pH = 8 with [L]0
= 0.001 mol L−1 and [Eu]0
+ [Sm]0
= 0.0015 mol L−1.](/image/article/2002/DT/b105173n/b105173n-f9.gif)
