Photorefractive properties of new polymer composites incorporating poly[ethynediyl-arylene-ethynediyl-silylene]s
William E. Douglas*a, Alexandar S. Kuzhelev†b, Irena V. Yurasovab, Oleg L. Antipovb, Larisa G. Klapshinac, Vladimir V. Semenovc, George A. Domrachevc, Tatiana I. Lopatinac and Daniel M. H. Guya
aCNRS UMR 5637, Université Montpellier II, 34095 Montpellier cedex 5, France. E-mail: douglas@univ-montp2.fr
bInstitute of Applied Physics, Russian Academy of Sciences, Uljanov Street 46, Nizhny Novgorod, 603600, Russia
cG. A. Razuvaev Institute of Metallo-organic Chemistry, Russian Academy of Sciences, Tropinin Street 49, GSP-445, Nizhny Novgorod, 603600, Russia
First published on 18th December 2001
Abstract
The photorefractive properties of low glass transition temperature, Tg, composites based on oligomeric poly[ethynediyl-arylene-ethynediyl-silylene]s as optical chromophores, poly(9-vinylcarbazole) as photoconductor, N-ethylcarbazole and phenyltrimethoxysilane as plasticizer, and fullerenes as charge generators have been investigated. The nonlinear optical effects, including four-wave mixing and two-beam coupling were studied at 633 nm. The photorefractive origin of the refractive index changes was confirmed by the achievement of a two-beam gain as high as 67 cm−1 under an externally applied electric field (E0![[thin space (1/6-em)]](https://www.rsc.org/images/entities/char_2009.gif) =
=![[thin space (1/6-em)]](https://www.rsc.org/images/entities/char_2009.gif) 16 V µm−1). Refractive index gratings affording two-beam gains up to 51 cm−1 can also be written under zero-field conditions. A possible explanation for this unique property of the materials is that chromophore orientation
asymmetry can be induced by the longitudinal intensity gradient.
16 V µm−1). Refractive index gratings affording two-beam gains up to 51 cm−1 can also be written under zero-field conditions. A possible explanation for this unique property of the materials is that chromophore orientation
asymmetry can be induced by the longitudinal intensity gradient.
Introduction
The photorefractive (PR) effect in composite materials based on organic polymers was first reported about 10 years ago. Such photorefractive polymeric materials are being intensively investigated because of the possibility of using them in a variety of applications, including optical data storage, processing techniques, phase conjugation, and wave division multiplexing technology.1 They have considerable technological potential because of their high efficiency, structural flexibility, light weight and their ability to be easily processed at low cost into large-area films. Since the first report on organic PR polymers, much research has been done to improve the materials in order to meet the necessary requirements for photorefractive applications, a variety of types of polymeric materials having been investigated.2–4 We report here that novel compositions incorporating poly[ethynediyl-arylene-ethynediyl-silylene] (PEAES) chromophores show PR effects even in the absence of an applied electric field and without any preliminary electric poling. We also describe the preparation and characterization of two new PEAES containing penta- and hexacoordinate silicon resulting from the presence of the 8-(dimethylamino)naphthyl ligand.5 Few such polymers are known although the chemical and electronic behaviour of silicon is highly dependent on coordination number.6Experimental
Reactions were carried out under dinitrogen using Schlenk tube techniques. Triethylamine was distilled over powdered KOH, and toluene was distilled from CaH2. NMR spectra were run on a Bruker AVANCE DPX 200 spectrometer operating at 200 MHz (1H), 50.327 MHz (13C) or 39.763 MHz (29Si). IR spectra were recorded on a Perkin Elmer 1600 FTIR instrument in CCl4 solution or as Nujol mulls. Mass spectra were obtained by use of a Jeol JMS-DX300 instrument. Elemental analyses were done at the CNRS Service Central d'Analyse. Size exclusion chromatography (SEC) was carried out in THF at a flow rate of 0.9 ml min−1 by use of a Waters 510 system equipped with 100, 500, 1000 and 10![[thin space (1/6-em)]](https://www.rsc.org/images/entities/char_2009.gif) 000 Å columns and a UV detector operating at 254 nm. The PEAES (Scheme 1)
I7 and IV8
were prepared as previously described.
000 Å columns and a UV detector operating at 254 nm. The PEAES (Scheme 1)
I7 and IV8
were prepared as previously described.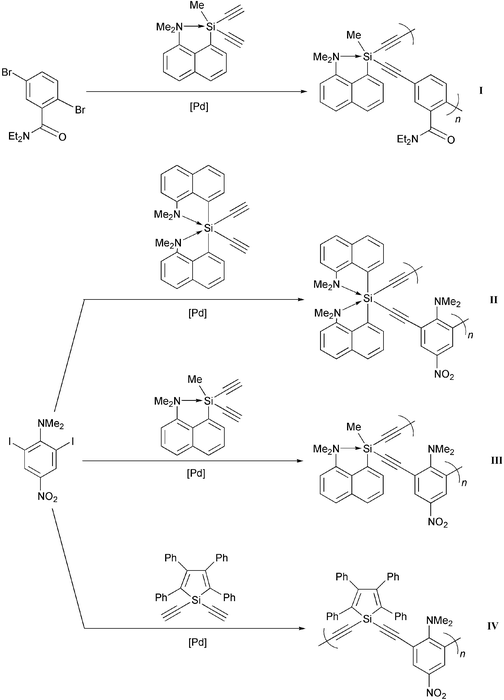 | ||
| Scheme 1 | ||
Preparation of II
A mixture of bis[8-(dimethylamino-κN)-1-naphthalenyl-κC]diethynylsilicon9 (0.23 g, 0.55 mmol), 2,6-diiodo-4-nitro-N,N-dimethylaniline10 (0.21 g, 0.50 mmol), bis(triphenylphosphine)palladium(II) dichloride (7.3 mg, 0.010 mmol), and copper(I) iodide (3 mg, 0.016 mmol) in toluene (5 ml) and triethylamine (1 ml) was stirred at 89![[thin space (1/6-em)]](https://www.rsc.org/images/entities/char_2009.gif) °C for 24 h and then pumped to dryness. The residue was taken up in THF and filtered through diatomaceous earth. Addition of n-pentane to the filtrate precipitated II as a yellow powder isolated by centrifugation (0.28 g, 96% yield). IR [KBr, ν/cm−1]: 2139 [ν(C
°C for 24 h and then pumped to dryness. The residue was taken up in THF and filtered through diatomaceous earth. Addition of n-pentane to the filtrate precipitated II as a yellow powder isolated by centrifugation (0.28 g, 96% yield). IR [KBr, ν/cm−1]: 2139 [ν(C![[triple bond, length half m-dash]](https://www.rsc.org/images/entities/char_e007.gif) C)]. 1H
NMR (CDCl3): δ 8.7–7.3 (m, 14 H, aromatic), 2.54 (s, 6 H, NCH3), 1.35 (s, 6 H, NCH3). 29Si NMR (CDCl3): δ
−64.5. 13C NMR (CDCl3): δ 155–118 (aromatic), 107.3 (SiC
C)]. 1H
NMR (CDCl3): δ 8.7–7.3 (m, 14 H, aromatic), 2.54 (s, 6 H, NCH3), 1.35 (s, 6 H, NCH3). 29Si NMR (CDCl3): δ
−64.5. 13C NMR (CDCl3): δ 155–118 (aromatic), 107.3 (SiC![[triple bond, length half m-dash]](https://www.rsc.org/images/entities/char_e007.gif) C), 101.0 (SiC
C), 101.0 (SiC![[triple bond, length half m-dash]](https://www.rsc.org/images/entities/char_e007.gif) C), 48.5 (NCH3), 47.2 (NCH3). UV/vis. (CH2Cl2): λmax 298 nm, ε 12638 l mol−1 cm−1. SEC (THF): Mw 5020, Mn 3530, Mw/Mn 1.4.
C), 48.5 (NCH3), 47.2 (NCH3). UV/vis. (CH2Cl2): λmax 298 nm, ε 12638 l mol−1 cm−1. SEC (THF): Mw 5020, Mn 3530, Mw/Mn 1.4.Preparation of III
A mixture of [8-(dimethylamino-κN)-1-naphthalenyl-κC]diethynylmethylsilicon11 (0.40 g, 1.52 mmol), 2,6-diiodo-4-nitro-N,N-dimethylaniline10 (0.63 g, 1.51 mmol), bis(triphenylphosphine)palladium(II) dichloride (0.8 mg, 0.001 mmol), copper(I) iodide (7.6 mg, 0.040 mmol), and triphenylphosphine (19.6 mg, 0.075 mmol) in toluene (10 ml) and triethylamine (10 ml) was stirred at 89![[thin space (1/6-em)]](https://www.rsc.org/images/entities/char_2009.gif) °C for 17 h and then filtered. The filtrate was pumped to dryness and the residue taken up in THF. The resulting solution was filtered and addition of n-pentane precipitated the oligomer as a yellow solid which was washed with methanol (acidified with a few drops of conc. HCl) and dried under vacuum (0.45 g, 70% yield).
IR [Nujol, ν/cm−1]: 3281 w, 2147 m [ν(C
°C for 17 h and then filtered. The filtrate was pumped to dryness and the residue taken up in THF. The resulting solution was filtered and addition of n-pentane precipitated the oligomer as a yellow solid which was washed with methanol (acidified with a few drops of conc. HCl) and dried under vacuum (0.45 g, 70% yield).
IR [Nujol, ν/cm−1]: 3281 w, 2147 m [ν(C![[triple bond, length half m-dash]](https://www.rsc.org/images/entities/char_e007.gif) C)], 1568 s, 1506 s, 1411 s, 1377 m, 1365 w, 1321 vs, 1252 w, 1233 w, 1206 w, 1158 m, 1094 w, 1075 s, 1022 w, 1001 s, 954 m, 904 w, 881 w, 827 w, 780 s, 757 m, 744 m, 722 w, 695 w, 664 w. 1H NMR (CDCl3): δ 8.5–7.5 (m, 8 H, aromatic), 3.19 (s, 3 H, NCH3), 2.75 (s, 3 H, NCH3), 0.77 (s, 3 H, SiCH3). 29Si NMR (CDCl3): δ
−55.7. 13C NMR (CDCl3): δ 161–117 (aromatic), 102.3 (SiC
C)], 1568 s, 1506 s, 1411 s, 1377 m, 1365 w, 1321 vs, 1252 w, 1233 w, 1206 w, 1158 m, 1094 w, 1075 s, 1022 w, 1001 s, 954 m, 904 w, 881 w, 827 w, 780 s, 757 m, 744 m, 722 w, 695 w, 664 w. 1H NMR (CDCl3): δ 8.5–7.5 (m, 8 H, aromatic), 3.19 (s, 3 H, NCH3), 2.75 (s, 3 H, NCH3), 0.77 (s, 3 H, SiCH3). 29Si NMR (CDCl3): δ
−55.7. 13C NMR (CDCl3): δ 161–117 (aromatic), 102.3 (SiC![[triple bond, length half m-dash]](https://www.rsc.org/images/entities/char_e007.gif) C), 93.5 (SiC
C), 93.5 (SiC![[triple bond, length half m-dash]](https://www.rsc.org/images/entities/char_e007.gif) C), 48.5 (NCH3), 44.9 (NCH3), 2.4 (SiCH3). SEC (THF): Mw 3100, Mn 2100, Mw/Mn
1.5.
C), 48.5 (NCH3), 44.9 (NCH3), 2.4 (SiCH3). SEC (THF): Mw 3100, Mn 2100, Mw/Mn
1.5.Results and discussion
Preparation and properties of oligomeric chromophores
The PEAES I–IV (Scheme 1) were prepared by Pd catalyzed coupling between the appropriate diethynylsilane and dihaloarene as previously described for I7 and IV.8 The oligomers (average length ca. 7 units) contain Si with coordination numbers ranging from 4 to 6 [I(5), II(6), III(5), IV(4)]. The room temperature 1H and 13C NMR spectra for the new oligomers II and III containing hexa- and pentacoordinate silicon, respectively, show two signals for the diastereotopic NCH3 groups (Experimental). The acetylene 13C NMR resonances were assigned by analogy with the results of 13C–1H coupling experiments on R2Si(C![[triple bond, length half m-dash]](https://www.rsc.org/images/entities/char_e007.gif) CPh)2
model monomers. Decrease in Si coordination number from 6 to 5 on going from II to III results in the 29Si NMR resonance being displaced downfield and the acetylene 13C NMR signals upfield, the ν(C
CPh)2
model monomers. Decrease in Si coordination number from 6 to 5 on going from II to III results in the 29Si NMR resonance being displaced downfield and the acetylene 13C NMR signals upfield, the ν(C![[triple bond, length half m-dash]](https://www.rsc.org/images/entities/char_e007.gif) C) IR absorbance being shifted to higher energy (Table 1). On going further from III to the corresponding oligomer containing tetracoordinate Ph2Si groups,10 the 29Si and acetylene 13C NMR resonances are all displaced downfield, and the ν(C
C) IR absorbance being shifted to higher energy (Table 1). On going further from III to the corresponding oligomer containing tetracoordinate Ph2Si groups,10 the 29Si and acetylene 13C NMR resonances are all displaced downfield, and the ν(C![[triple bond, length half m-dash]](https://www.rsc.org/images/entities/char_e007.gif) C) IR absorbance is shifted to slightly higher energy. Thus, the electronic nature of the conjugated backbones of the oligomers is markedly dependent on the Si coordination state.
C) IR absorbance is shifted to slightly higher energy. Thus, the electronic nature of the conjugated backbones of the oligomers is markedly dependent on the Si coordination state.
Photorefractive investigations
For a material to be PR-active it is necessary to have (i) a photoionizable charge generator, (ii) a transporting medium, (iii) trapping sites, and (iv) a dependence of the refractive index on the space-charge field. In order to provide the dependence of refractive index on the electric field nonlinear chromophores with large hyperpolarizabilities are used, such as DEANST,4 DMNPAA,12 or PDCST.13 However, despite the high efficiencies of existing PR polymers, in order to make devices suitable for technological applications much effort is still needed to (a) make faster materials, (b) reduce the values of the applied electric fields, and (c) eliminate phase separation in the composites.We studied novel PR polymer nanocomposites containing as optical chromophores the Si-containing conjugated PEAES oligomers I–IV. C60 or the more readily soluble C70 fullerenes were used as charge generators, fullerenes being frequently employed for this purpose.2–4 We used the well known charge transport agent poly(9-vinylcarbazole) (PVK),4,12–16 and the plasticizer component was a mixture of N-ethylcarbazole (EK) and phenyltrimethoxysilane (PTMS). EK is a commonly-used efficient plasticizer in PR compositions giving rise to a large increase in the gain coefficient and the diffraction efficiency.17,18 PTMS is a reactive plasticizer that undergoes hydrolysis in the presence of moisture affording a polyorganosiloxane matrix for the photorefractive composition.
As required for acitivity as optical chromophores, the oligomers contain both donor (dimethylamino) and acceptor groups (I amide; II–IV nitro). We have previously reported a high hyperpolarizability χ(3) (giving rise to the electro-optic effect in isotropic materials) for I, both in solution as determined by the degenerate four-wave mixing technique,7 and in thin organic–inorganic hybrid films as measured by the Z-scan technique.19,20
Samples for the present studies were prepared by sandwiching a layer of composite material 50–250 µm in thickness between glass slides coated with transparent indium tin oxide electrodes. The glass transition temperature of the compositions was low (ca. 8![[thin space (1/6-em)]](https://www.rsc.org/images/entities/char_2009.gif) °C as determined by differential scanning calorimetry) thus facilitating molecular reorientation. The electrical conductivity of the films decreased with drying time (Fig. 1) as the toluene solvent evaporated at ambient temperature in air and the sol–gel crosslinking reaction involving phenyltrimethoxysilane took place (for compositions see captions to Fig. 3–5 below). It should be noted that the samples exhibited low-voltage breakdown (at fields less than 10 V µm−1) after short drying times (less than 30 min). Therefore, the experiments were carried
out on samples of low conductivity (less than 7 pS m−1 at E0
°C as determined by differential scanning calorimetry) thus facilitating molecular reorientation. The electrical conductivity of the films decreased with drying time (Fig. 1) as the toluene solvent evaporated at ambient temperature in air and the sol–gel crosslinking reaction involving phenyltrimethoxysilane took place (for compositions see captions to Fig. 3–5 below). It should be noted that the samples exhibited low-voltage breakdown (at fields less than 10 V µm−1) after short drying times (less than 30 min). Therefore, the experiments were carried
out on samples of low conductivity (less than 7 pS m−1 at E0![[thin space (1/6-em)]](https://www.rsc.org/images/entities/char_2009.gif) =
=![[thin space (1/6-em)]](https://www.rsc.org/images/entities/char_2009.gif) 16 V µm−1). Oligomer I contains amide groups known to give rise to hybrid films of good optical quality.21 Films made from II–IV were also of satisfactory optical quality.
16 V µm−1). Oligomer I contains amide groups known to give rise to hybrid films of good optical quality.21 Films made from II–IV were also of satisfactory optical quality.
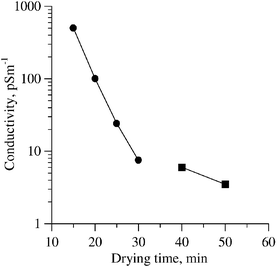 | ||
| Fig. 1 The dependence of sample conductivity on the drying time, (•) measured at bias dc voltage 40 V; (■) measured at bias dc voltage 1.6 kV. Composite : PEAES(II) 5%, PVK 45%, C70 1%, EK 25%, PTMS 24%, sample thickness 100 µm. | ||
The refractive index grating formation was investigated in the PR composites using the four-wave mixing (FWM) technique (Fig. 2). The original Gaussian beam of a He–Ne laser (λ![[thin space (1/6-em)]](https://www.rsc.org/images/entities/char_2009.gif) =
=![[thin space (1/6-em)]](https://www.rsc.org/images/entities/char_2009.gif) 633 nm) was split into two beams of equal intensities (Iw1
633 nm) was split into two beams of equal intensities (Iw1![[thin space (1/6-em)]](https://www.rsc.org/images/entities/char_2009.gif) =
=![[thin space (1/6-em)]](https://www.rsc.org/images/entities/char_2009.gif) Iw2
Iw2![[thin space (1/6-em)]](https://www.rsc.org/images/entities/char_2009.gif) =
=![[thin space (1/6-em)]](https://www.rsc.org/images/entities/char_2009.gif) 0.5 W cm−2). These s-polarized beams wrote the holographic grating in the sample. The angle of incidence was 60° and the angle of intersection was 0.03 rad. The third wave with intensity Ir, obtained by reflecting the first writing wave backward from the mirror, read the grating. The wave diffracted on the grating Id was recorded. The diffraction efficiency of the grating was determined as:
0.5 W cm−2). These s-polarized beams wrote the holographic grating in the sample. The angle of incidence was 60° and the angle of intersection was 0.03 rad. The third wave with intensity Ir, obtained by reflecting the first writing wave backward from the mirror, read the grating. The wave diffracted on the grating Id was recorded. The diffraction efficiency of the grating was determined as:
 | (1) |
![[thin space (1/6-em)]](https://www.rsc.org/images/entities/char_2009.gif) =
=![[thin space (1/6-em)]](https://www.rsc.org/images/entities/char_2009.gif) 0)
0)![[thin space (1/6-em)]](https://www.rsc.org/images/entities/char_2009.gif) =
=![[thin space (1/6-em)]](https://www.rsc.org/images/entities/char_2009.gif) Iw1 exp(
Iw1 exp(![[thin space (1/6-em)]](https://www.rsc.org/images/entities/char_2009.gif) −
−![[thin space (1/6-em)]](https://www.rsc.org/images/entities/char_2009.gif) 2αl)
and α is the absorption.
2αl)
and α is the absorption. | ||
| Fig. 2 The set-up for the FWM measurements. | ||
Measurements were made both under zero-field conditions and with a high bias voltage applied to the cell. In the first case, the diffraction efficiency achieved was 0.12%
(Fig. 3(a)). The lifetime of the grating depended on the illumination. When only one writing beam (Iw2) was blocked, the grating lifetime was found to be ca. 20 min (Fig. 3(a)), whereas when all the beams were blocked, the grating lifetime became greater than 1 h [Fig. 3(b)]
(D was registered by use of short pulses of Iw1 and Ir with time intervals of 2 min). Such behaviour of the grating lifetime can be explained by a resonant or PR origin of the grating. It should be noted that any possible contribution of the small scale grating written by reading beam Ir
and writing beams Iw1,![[thin space (1/6-em)]](https://www.rsc.org/images/entities/char_2009.gif) 2 to the diffracted beam was negligible. This was verified by blocking the reading beam Ir and the writing beam Iw1. Under these conditions, no diffraction of the beam Iw2 to the beam Id was observed. Thus, the measured diffraction efficiency is related to the large scale grating.
2 to the diffracted beam was negligible. This was verified by blocking the reading beam Ir and the writing beam Iw1. Under these conditions, no diffraction of the beam Iw2 to the beam Id was observed. Thus, the measured diffraction efficiency is related to the large scale grating.
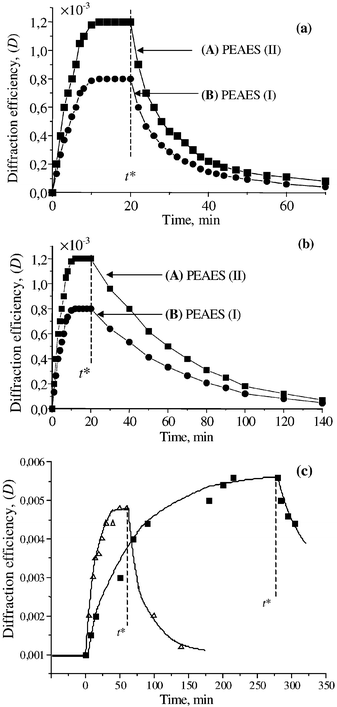 | ||
Fig. 3 Diffraction efficiency of the grating (D![[thin space (1/6-em)]](https://www.rsc.org/images/entities/char_2009.gif) = =![[thin space (1/6-em)]](https://www.rsc.org/images/entities/char_2009.gif) Id/Ir) as a function of time for two compositions consisting of PVK 45%, C70 1%, EK 25%, PTMS 24% and (A) PEAES(II) 5% or (B) PEAES(I) 5%. (a)
t Id/Ir) as a function of time for two compositions consisting of PVK 45%, C70 1%, EK 25%, PTMS 24% and (A) PEAES(II) 5% or (B) PEAES(I) 5%. (a)
t![[thin space (1/6-em)]](https://www.rsc.org/images/entities/char_2009.gif) = =![[thin space (1/6-em)]](https://www.rsc.org/images/entities/char_2009.gif) t* corresponds to switching off the writing beam Iw2, E0 t* corresponds to switching off the writing beam Iw2, E0![[thin space (1/6-em)]](https://www.rsc.org/images/entities/char_2009.gif) = =![[thin space (1/6-em)]](https://www.rsc.org/images/entities/char_2009.gif) 0, L 0, L![[thin space (1/6-em)]](https://www.rsc.org/images/entities/char_2009.gif) = =![[thin space (1/6-em)]](https://www.rsc.org/images/entities/char_2009.gif) 60 µm; (b) at time t 60 µm; (b) at time t![[thin space (1/6-em)]](https://www.rsc.org/images/entities/char_2009.gif) = =![[thin space (1/6-em)]](https://www.rsc.org/images/entities/char_2009.gif) t*Iw1, Iw2 and Ir were switched off, D was registered by short pulses of Iw1 and Ir with time intervals of 2 min, E0 t*Iw1, Iw2 and Ir were switched off, D was registered by short pulses of Iw1 and Ir with time intervals of 2 min, E0![[thin space (1/6-em)]](https://www.rsc.org/images/entities/char_2009.gif) = =![[thin space (1/6-em)]](https://www.rsc.org/images/entities/char_2009.gif) 0, L 0, L![[thin space (1/6-em)]](https://www.rsc.org/images/entities/char_2009.gif) = =![[thin space (1/6-em)]](https://www.rsc.org/images/entities/char_2009.gif) 60 µm; (c)
samples of composition (A) with higher conductivity 6 pS m−1
(△) and lower conductivity 3.5 pS m−1
(■); at time t 60 µm; (c)
samples of composition (A) with higher conductivity 6 pS m−1
(△) and lower conductivity 3.5 pS m−1
(■); at time t![[thin space (1/6-em)]](https://www.rsc.org/images/entities/char_2009.gif) = =![[thin space (1/6-em)]](https://www.rsc.org/images/entities/char_2009.gif) 0 the electric field was switched on, at time t 0 the electric field was switched on, at time t![[thin space (1/6-em)]](https://www.rsc.org/images/entities/char_2009.gif) = =![[thin space (1/6-em)]](https://www.rsc.org/images/entities/char_2009.gif) t* the field was switched off, E0 t* the field was switched off, E0![[thin space (1/6-em)]](https://www.rsc.org/images/entities/char_2009.gif) = =![[thin space (1/6-em)]](https://www.rsc.org/images/entities/char_2009.gif) 15 V µm−1, L 15 V µm−1, L![[thin space (1/6-em)]](https://www.rsc.org/images/entities/char_2009.gif) = =![[thin space (1/6-em)]](https://www.rsc.org/images/entities/char_2009.gif) 60 µm, α 60 µm, α![[thin space (1/6-em)]](https://www.rsc.org/images/entities/char_2009.gif) = =![[thin space (1/6-em)]](https://www.rsc.org/images/entities/char_2009.gif) 164 cm−1. 164 cm−1. | ||
The transmittance of the sample did not vary substantially during 2 h observation under illumination with beam intensity 1 W cm−2, so that
 | (2) |
 | (3) |
![[thin space (1/6-em)]](https://www.rsc.org/images/entities/char_2009.gif) ×
×![[thin space (1/6-em)]](https://www.rsc.org/images/entities/char_2009.gif) 10−5, i.e.
much less than the observed level (∼10−3).
10−5, i.e.
much less than the observed level (∼10−3).Next, in order to investigate whether the observed diffraction was of PR origin or the result of resonant refractive index changes (or possibly of some photochemical reaction), further study of its origin was made by using the two-beam coupling (TBC) technique. On application of a high bias voltage, providing an external electric field E0![[thin space (1/6-em)]](https://www.rsc.org/images/entities/char_2009.gif) =
=![[thin space (1/6-em)]](https://www.rsc.org/images/entities/char_2009.gif) 16 V µm−1, a fivefold increase in the diffraction efficiency was observed (Fig. 3(c)). When the applied voltage was switched off, the diffraction efficiency relaxed to the initial level thus demonstrating the PR response of the composites under an applied external field.
16 V µm−1, a fivefold increase in the diffraction efficiency was observed (Fig. 3(c)). When the applied voltage was switched off, the diffraction efficiency relaxed to the initial level thus demonstrating the PR response of the composites under an applied external field.
The behaviour of samples of the same composition (made from II) but with different conductivities owing to different drying times were compared (Fig. 3(c)). The more conductive sample with a dark conductivity at E0![[thin space (1/6-em)]](https://www.rsc.org/images/entities/char_2009.gif) =
=![[thin space (1/6-em)]](https://www.rsc.org/images/entities/char_2009.gif) 16 V µm−1 of ca. 6 pS m−1 showed a grating formation time of 20 min. The grating formation time increased to 100 min for the sample with lower conductivity (3.5 pS m−1 at E0
16 V µm−1 of ca. 6 pS m−1 showed a grating formation time of 20 min. The grating formation time increased to 100 min for the sample with lower conductivity (3.5 pS m−1 at E0![[thin space (1/6-em)]](https://www.rsc.org/images/entities/char_2009.gif) =
=![[thin space (1/6-em)]](https://www.rsc.org/images/entities/char_2009.gif) 16 V µm−1) resulting from increased drying time. The dependence of the lifetime on the conductivity can be explained by the PR origin of the grating.23 The maximum value of D achieved was 5.5
16 V µm−1) resulting from increased drying time. The dependence of the lifetime on the conductivity can be explained by the PR origin of the grating.23 The maximum value of D achieved was 5.5![[thin space (1/6-em)]](https://www.rsc.org/images/entities/char_2009.gif) ×
×![[thin space (1/6-em)]](https://www.rsc.org/images/entities/char_2009.gif) 10−3, which, from eqn. (3), corresponds to
a magnitude for the PR refractive index grating of Δn
10−3, which, from eqn. (3), corresponds to
a magnitude for the PR refractive index grating of Δn![[thin space (1/6-em)]](https://www.rsc.org/images/entities/char_2009.gif) =
=![[thin space (1/6-em)]](https://www.rsc.org/images/entities/char_2009.gif) 1.5
1.5![[thin space (1/6-em)]](https://www.rsc.org/images/entities/char_2009.gif) ×
×![[thin space (1/6-em)]](https://www.rsc.org/images/entities/char_2009.gif) 10−4.
10−4.
It should be noted that when long term exposure (grating writing) was applied, formation of an amplitude transmittance grating was observed. The character time for the written grating was ca. 7 h, a steady state grating magnitude being achieved after 14 h exposure. The maximum diffraction efficiency measured for the amplitude grating was 2![[thin space (1/6-em)]](https://www.rsc.org/images/entities/char_2009.gif) ×
×![[thin space (1/6-em)]](https://www.rsc.org/images/entities/char_2009.gif) 10−2. There was no substantial decrease in the diffraction efficiency over 1 month under dark conditions. The formation of the amplitude grating may be the result of some intermolecular reaction such as the slow photoinduced radical crosslinking of the PEAES chromophore.
10−2. There was no substantial decrease in the diffraction efficiency over 1 month under dark conditions. The formation of the amplitude grating may be the result of some intermolecular reaction such as the slow photoinduced radical crosslinking of the PEAES chromophore.
The PR nonlocal origin of the optical nonlinearities of the samples was verified by using a standard two-beam coupling (TBC) setup. The p-polarized pump and probe beams intersected in the sample at a variable angle in the range ca. 0.03–0.41 rad. The pump–to–probe ratio was β![[thin space (1/6-em)]](https://www.rsc.org/images/entities/char_2009.gif) =
=![[thin space (1/6-em)]](https://www.rsc.org/images/entities/char_2009.gif) Ipump/Iprobe
Ipump/Iprobe![[thin space (1/6-em)]](https://www.rsc.org/images/entities/char_2009.gif) =
=![[thin space (1/6-em)]](https://www.rsc.org/images/entities/char_2009.gif) 625. The two-beam coupling gain coefficient was determined from the expression:2
625. The two-beam coupling gain coefficient was determined from the expression:2
 | (4) |
![[thin space (1/6-em)]](https://www.rsc.org/images/entities/char_2009.gif) =
=![[thin space (1/6-em)]](https://www.rsc.org/images/entities/char_2009.gif) Iprobe, with pump/Iprobe, without pump, and leff
Iprobe, with pump/Iprobe, without pump, and leff![[thin space (1/6-em)]](https://www.rsc.org/images/entities/char_2009.gif) =
=![[thin space (1/6-em)]](https://www.rsc.org/images/entities/char_2009.gif) L cos−1θ is the effective length.
L cos−1θ is the effective length.A TBC gain was observed at zero bias field (Fig. 4). The magnitude of the TBC gain in the absence of an applied field depended on the grating spacing (Fig. 5). The TBC gain under zero-field conditions was found to be 90.5 cm−1 at a large angle of intersection. It can be seen that the optimal grating period is 2.75 µm. Such dependence is evidence for the PR origin of the grating.2
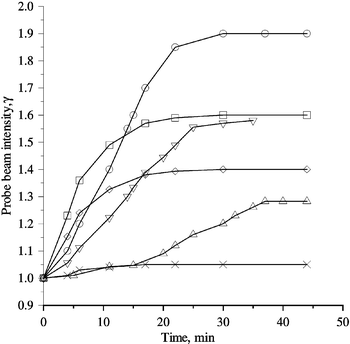 | ||
Fig. 4 Oscillograms of the probe beam for compositions containing PEAES 5%, fullerene 1%, PVK 45%, EK 25%, PTMS 24%. At time t![[thin space (1/6-em)]](https://www.rsc.org/images/entities/char_2009.gif) = =![[thin space (1/6-em)]](https://www.rsc.org/images/entities/char_2009.gif) 0 the pump beam (Ipump 0 the pump beam (Ipump![[thin space (1/6-em)]](https://www.rsc.org/images/entities/char_2009.gif) = =![[thin space (1/6-em)]](https://www.rsc.org/images/entities/char_2009.gif) 0.2 W cm−2) and bias field (if applied) were switched on, the angle of beam intersection for all plots being 0.03 rad. (×) PEAES(I)/C60; Γ 0.2 W cm−2) and bias field (if applied) were switched on, the angle of beam intersection for all plots being 0.03 rad. (×) PEAES(I)/C60; Γ![[thin space (1/6-em)]](https://www.rsc.org/images/entities/char_2009.gif) = =![[thin space (1/6-em)]](https://www.rsc.org/images/entities/char_2009.gif) 7 cm−1, α 7 cm−1, α![[thin space (1/6-em)]](https://www.rsc.org/images/entities/char_2009.gif) = =![[thin space (1/6-em)]](https://www.rsc.org/images/entities/char_2009.gif) 87 cm−1, E0 87 cm−1, E0![[thin space (1/6-em)]](https://www.rsc.org/images/entities/char_2009.gif) = =![[thin space (1/6-em)]](https://www.rsc.org/images/entities/char_2009.gif) 0, leff 0, leff![[thin space (1/6-em)]](https://www.rsc.org/images/entities/char_2009.gif) = =![[thin space (1/6-em)]](https://www.rsc.org/images/entities/char_2009.gif) 70 µm. (△) PEAES(II)/C70; Γ 70 µm. (△) PEAES(II)/C70; Γ![[thin space (1/6-em)]](https://www.rsc.org/images/entities/char_2009.gif) = =![[thin space (1/6-em)]](https://www.rsc.org/images/entities/char_2009.gif) 25 cm−1, α 25 cm−1, α![[thin space (1/6-em)]](https://www.rsc.org/images/entities/char_2009.gif) = =![[thin space (1/6-em)]](https://www.rsc.org/images/entities/char_2009.gif) 194 cm−1, E0 194 cm−1, E0![[thin space (1/6-em)]](https://www.rsc.org/images/entities/char_2009.gif) = =![[thin space (1/6-em)]](https://www.rsc.org/images/entities/char_2009.gif) 0, leff 0, leff![[thin space (1/6-em)]](https://www.rsc.org/images/entities/char_2009.gif) = =![[thin space (1/6-em)]](https://www.rsc.org/images/entities/char_2009.gif) 100 µm. (▽)
PEAES(IV)/C70; Γ 100 µm. (▽)
PEAES(IV)/C70; Γ![[thin space (1/6-em)]](https://www.rsc.org/images/entities/char_2009.gif) = =![[thin space (1/6-em)]](https://www.rsc.org/images/entities/char_2009.gif) 51 cm−1, α 51 cm−1, α![[thin space (1/6-em)]](https://www.rsc.org/images/entities/char_2009.gif) = =![[thin space (1/6-em)]](https://www.rsc.org/images/entities/char_2009.gif) 190 cm−1, E0 190 cm−1, E0![[thin space (1/6-em)]](https://www.rsc.org/images/entities/char_2009.gif) = =![[thin space (1/6-em)]](https://www.rsc.org/images/entities/char_2009.gif) 0, leff 0, leff![[thin space (1/6-em)]](https://www.rsc.org/images/entities/char_2009.gif) = =![[thin space (1/6-em)]](https://www.rsc.org/images/entities/char_2009.gif) 90 µm. (⋄) PEAES(III)/C70; Γ 90 µm. (⋄) PEAES(III)/C70; Γ![[thin space (1/6-em)]](https://www.rsc.org/images/entities/char_2009.gif) = =![[thin space (1/6-em)]](https://www.rsc.org/images/entities/char_2009.gif) 52 cm−1, α 52 cm−1, α![[thin space (1/6-em)]](https://www.rsc.org/images/entities/char_2009.gif) = =![[thin space (1/6-em)]](https://www.rsc.org/images/entities/char_2009.gif) 194 cm−1, E0 194 cm−1, E0![[thin space (1/6-em)]](https://www.rsc.org/images/entities/char_2009.gif) = =![[thin space (1/6-em)]](https://www.rsc.org/images/entities/char_2009.gif) 16 V µm−1, leff 16 V µm−1, leff![[thin space (1/6-em)]](https://www.rsc.org/images/entities/char_2009.gif) = =![[thin space (1/6-em)]](https://www.rsc.org/images/entities/char_2009.gif) 70 µm. (□) PEAES(I)/C60; Γ 70 µm. (□) PEAES(I)/C60; Γ![[thin space (1/6-em)]](https://www.rsc.org/images/entities/char_2009.gif) = =![[thin space (1/6-em)]](https://www.rsc.org/images/entities/char_2009.gif) 67 cm−1, α 67 cm−1, α![[thin space (1/6-em)]](https://www.rsc.org/images/entities/char_2009.gif) = =![[thin space (1/6-em)]](https://www.rsc.org/images/entities/char_2009.gif) 87 cm−1, E0 87 cm−1, E0![[thin space (1/6-em)]](https://www.rsc.org/images/entities/char_2009.gif) = =![[thin space (1/6-em)]](https://www.rsc.org/images/entities/char_2009.gif) 16 V µm−1, leff 16 V µm−1, leff![[thin space (1/6-em)]](https://www.rsc.org/images/entities/char_2009.gif) = =![[thin space (1/6-em)]](https://www.rsc.org/images/entities/char_2009.gif) 70 µm. (○) PEAES(II)/C70; Γ 70 µm. (○) PEAES(II)/C70; Γ![[thin space (1/6-em)]](https://www.rsc.org/images/entities/char_2009.gif) = =![[thin space (1/6-em)]](https://www.rsc.org/images/entities/char_2009.gif) 64
cm−1, α 64
cm−1, α![[thin space (1/6-em)]](https://www.rsc.org/images/entities/char_2009.gif) = =![[thin space (1/6-em)]](https://www.rsc.org/images/entities/char_2009.gif) 194 cm−1, E0 194 cm−1, E0![[thin space (1/6-em)]](https://www.rsc.org/images/entities/char_2009.gif) = =![[thin space (1/6-em)]](https://www.rsc.org/images/entities/char_2009.gif) 16 V µm−1, leff 16 V µm−1, leff![[thin space (1/6-em)]](https://www.rsc.org/images/entities/char_2009.gif) = =![[thin space (1/6-em)]](https://www.rsc.org/images/entities/char_2009.gif) 100 µm. 100 µm. | ||
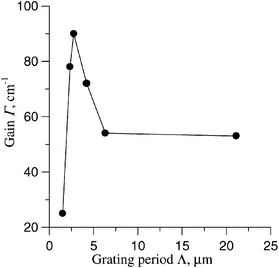 | ||
Fig. 5 The magnitude of the TBC gain as a function of the grating period Λ. PEAES(IV) 5%, PVK 45%, C70 1%, EK 25%, PTMS 24%, α![[thin space (1/6-em)]](https://www.rsc.org/images/entities/char_2009.gif) = =![[thin space (1/6-em)]](https://www.rsc.org/images/entities/char_2009.gif) 190 cm−1, E0 190 cm−1, E0![[thin space (1/6-em)]](https://www.rsc.org/images/entities/char_2009.gif) = =![[thin space (1/6-em)]](https://www.rsc.org/images/entities/char_2009.gif) 0, L 0, L![[thin space (1/6-em)]](https://www.rsc.org/images/entities/char_2009.gif) = =![[thin space (1/6-em)]](https://www.rsc.org/images/entities/char_2009.gif) 60 µm. 60 µm. | ||
However, it is well known that according to PR theory an external electric field to remove inversion symmetry is necessary for PR effects in organic materials. TBC gain has been reported in some PR polymeric materials without an external field or mention of preliminary poling, but no explanation was given.24 More recently, a high TBC gain was observed for a polymeric material in the absence of poling or an external field and it was suggested that the effect was due to some kind of coupling between the space charge field grating and the orientational grating caused by trans–cis isomerization processes.25 However, the mechanism for such coupling between the two kinds of gratings is not yet clear and in our case no such trans–cis isomerization is possible.
A possible explanation follows from the fact that the presence of the internal polarization field due to a longitudinal intensity gradient can produce local poling. The longitudinal intensity gradient produces a charge displacement and hence a space-charge field in the same direction. This internal field could give rise to local poling of the oligomer, thus removing the inversion symmetry. Such an effect of breaking the symmetry by longitudinal field formation has been observed experimentally26 and explained theoretically27 in photorefractive liquid crystal composites. Indeed, the possibility of observing such an effect in PR polymeric materials was suggested.27
When an external voltage was applied, the probe beam was observed to increase in the presence of a pump beam and a bias field with definite direction (application of the opposite external voltage resulted in the absence of the weak increase in the probe beam) (Fig. 4).
The greatest TBC gain achieved at E0![[thin space (1/6-em)]](https://www.rsc.org/images/entities/char_2009.gif) =
=![[thin space (1/6-em)]](https://www.rsc.org/images/entities/char_2009.gif) 16 V µm−1 was Γ
16 V µm−1 was Γ![[thin space (1/6-em)]](https://www.rsc.org/images/entities/char_2009.gif) =
=![[thin space (1/6-em)]](https://www.rsc.org/images/entities/char_2009.gif) 67 cm−1 for I, without any net gain due to the relatively high absorption coefficient, α
67 cm−1 for I, without any net gain due to the relatively high absorption coefficient, α![[thin space (1/6-em)]](https://www.rsc.org/images/entities/char_2009.gif) =
=![[thin space (1/6-em)]](https://www.rsc.org/images/entities/char_2009.gif) 87 cm−1. Thus the PR nonlinearity is demonstrated by the presence of TBC with an external field. The achievement of a high net gain may be possible by applying a higher bias field, up to 100 V µm−1. Indeed, high values of net gain observed in PR organic materials normally require electric fields greater than 60 V µm−1.2
87 cm−1. Thus the PR nonlinearity is demonstrated by the presence of TBC with an external field. The achievement of a high net gain may be possible by applying a higher bias field, up to 100 V µm−1. Indeed, high values of net gain observed in PR organic materials normally require electric fields greater than 60 V µm−1.2
Direct measurements of the phase shift of the refractive index grating Φ from the light intensity pattern were carried out. As the grating was written, the sample was moved along the grating wave-vector (x-axis). The dependence of the probe beam power on the x-shift was studied (Fig. 6). A maximum in the TBC gain was observed at x![[thin space (1/6-em)]](https://www.rsc.org/images/entities/char_2009.gif) =
=![[thin space (1/6-em)]](https://www.rsc.org/images/entities/char_2009.gif) 0 thus showing there to be a π/2 phase shift between the grating and the interference field. The relation between the probe beam gain Γ and the phase shift of the refractive index grating Φ is well known (Γ
0 thus showing there to be a π/2 phase shift between the grating and the interference field. The relation between the probe beam gain Γ and the phase shift of the refractive index grating Φ is well known (Γ![[thin space (1/6-em)]](https://www.rsc.org/images/entities/char_2009.gif) ∼
∼![[thin space (1/6-em)]](https://www.rsc.org/images/entities/char_2009.gif) sin Φ). Thus the theoretical prediction of measured dependence γ(x) can be written as:
sin Φ). Thus the theoretical prediction of measured dependence γ(x) can be written as:
 | (6) |
![[thin space (1/6-em)]](https://www.rsc.org/images/entities/char_2009.gif) =
=![[thin space (1/6-em)]](https://www.rsc.org/images/entities/char_2009.gif) 22 µm.
22 µm.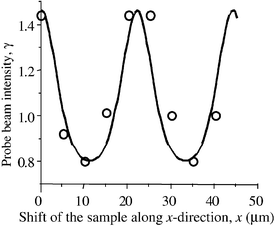 | ||
| Fig. 6 The dependence of the probe beam power on the x-shift of the sample PEAES(III) 5%, PVK 45%, C70 1%, EK 25%, PTMS 24%. (○) Experimental data and theoretical curve. | ||
The theoretical curve γ(x)
eqn. (6), assuming Φ![[thin space (1/6-em)]](https://www.rsc.org/images/entities/char_2009.gif) =
=![[thin space (1/6-em)]](https://www.rsc.org/images/entities/char_2009.gif) π/2 is shown in Fig. 6. It can be seen that there is good agreement between theory and experiment thus proving the PR origin of the TBC gain.2
π/2 is shown in Fig. 6. It can be seen that there is good agreement between theory and experiment thus proving the PR origin of the TBC gain.2
In the presence of an applied electric field, the TBC gain observed for II was greater than that for III (Fig. 4) suggesting that silicon hexacoordination rather than pentacoordination is more favourable to photorefraction. Finally, it should be noted that improved properties for compositions containing longer chain homologues of the oligomeric chromophores can be expected.28
In conclusion, the photorefractive properties of composites based on oligomeric PEAES as optical chromophores, poly(9-vinylcarbazole) as photoconductor, N-ethylcarbazole and phenyltrimethoxysilane as plasticizer, and fullerenes as charge generators have been investigated. The nonlinear optical effects, including four-wave mixing and two-beam coupling were studied at 633 nm. The photorefractive origin of the refractive index changes was confirmed by the achievement of a high two-beam gain under an externally applied electric field. Refractive index gratings affording two-beam gain can also be written under zero-field conditions. We suggest as a possible explanation for this unique property of the materials that chromophore orientation asymmetry can be induced by the longitudinal intensity gradient.
Acknowledgements
Financial support from INTAS (Brussels) [Open Call 97-1785], the National Russian Foundation (grants 99-03-32911, 00-15-97439 and 00-02-81206) and EOARD (London) is gratefully acknowledged. We thank Prof. P. M. Johansen and Mr. K. G. Jespersen for their investigation of the thermal transition temperatures of our samples.References
- G. J. Steckman, R. Bittner, K. Meerholz and D. Psaltis, Opt. Commun., 2000, 185, 13 CrossRef CAS.
- W. E. Moerner and S. M. Silence, Chem. Rev., 1994, 94, 127 CrossRef CAS.
- S. R. Marder, B. Kippelen, A. K. Y. Jen and N. Peyghambarian, Nature, 1997, 388, 845 CrossRef CAS.
- Y. D. Zhang, T. Wada and H. Sasabe, J. Mater. Chem., 1998, 8, 809 RSC.
- J. T. B. H. Jastrzebski, C. T. Knaap and G. van Koten, J. Organomet. Chem., 1983, 255, 287 CrossRef CAS.
- C. Chuit, R. J. P. Corriu, C. Reyé and J. C. Young, Chem. Rev., 1993, 93, 1371 CrossRef CAS.
- W. E. Douglas, R. E. Benfield, O. L. Antipov, L. G. Klapshina, A. S. Kuzhelev, D. M. H. Guy, R. G. Jones, A. Mustafa and G. A. Domrachev, Phys. Chem. Chem. Phys., 2000, 2, 3195 RSC.
- R. J. P. Corriu, W. E. Douglas and Z.-X. Yang, J. Organomet. Chem., 1993, 456, 35 CrossRef CAS.
- K. Boyer-Elma, F. H. Carré, R. J.-P. Corriu and W. E. Douglas, J. Chem. Soc., Chem. Commun., 1995, 725 RSC.
- R. J. P. Corriu, W. E. Douglas, Z.-X. Yang, Y. Karakus, G. H. Cross and D. Bloor, J. Organomet. Chem., 1993, 455, 69 CrossRef CAS.
- W. E. Douglas, D. M. H. Guy, A. K. Kar and C. H. Wang, Chem. Commun., 1998, 2125 RSC.
- B. Kippelen, F. Meyers, N. Peyghambarian and S. R. Marder, J. Am. Chem. Soc., 1997, 119, 4559 CrossRef CAS.
- A. Grunnet-Jepsen, D. Wright, B. Smith, M. S. Bratcher, M. S. DeClue, J. S. Siegel and W. E. Moerner, Chem. Phys. Lett., 1998, 291, 553 CrossRef CAS.
- D. Wright, M. A. Diaz-Garcia, J. D. Casperson, M. DeClue, W. E. Moerner and R. J. Twieg, Appl. Phys. Lett., 1998, 73, 1490 CrossRef CAS.
- J. A. Herlocker, C. Fuentes-Hernandez, K. B. Ferrio, E. Hendrickx, P. A. Blanche, N. Peyghambarian, B. Kippelen, Y. Zhang, J. F. Wang and S. R. Marder, Appl. Phys. Lett., 2000, 77, 2292 CrossRef CAS.
- B. L. Volodin, B. Kippelen, K. Meerholz, B. Javidi and N. Peyghambarian, Nature, 1996, 383, 58 CrossRef CAS.
- H. J. Bolink, V. V. Krasnikov, G. G. Malliaras and G. Hadziioannou, J. Phys. Chem., 1996, 100, 16
![[thin space (1/6-em)]](https://www.rsc.org/images/entities/char_2009.gif) 356 CrossRef CAS.
356 CrossRef CAS. - D. Van Steenwinckel, E. Hendrickx, C. Samyn, C. Engels and A. Persoons, J. Mater. Chem., 2000, 10, 2692 RSC.
- W. E. Douglas, L. G. Klapshina, A. N. Rubinov, G. A. Domrachev, B. A. Bushuk, O. L. Antipov, V. V. Semenov, A. S. Kuzhelev, S. B. Bushuk and J. A. Kalvinkovskaya, Proc. 45th Meeting SPIE, San Diego, 2000, Linear, Nonlinear, and Power-limiting Organics, ed. M. Eich, M. G. Kuzyk, C. M. Lawson and R. A. Norwood, SPIE, Bellingham, WA, 2000, p. 360. Search PubMed.
- A. V. Afanas'ev, A. P. Zinoviev, O. L. Antipov, B. A. Bushuk, S. B. Bushuk, A. N. Rubinov, J. Y. Fominih, L. G. Klapshina, G. A. Domrachev and W. E. Douglas, Opt. Commun. Search PubMed.in press.
- T. Saegusa and Y. Chujo, Makromol. Chem. Macromol. Symp., 1992, 64, 1 Search PubMed.
- D. D. Nolte, in Photorefractive Effects and Materials, ed. D. D. Nolte, Kluwer, Dordrecht, 1995, p. 57. Search PubMed.
- G. Bauml, S. Schloter, U. Hofmann and D. Haarer, Opt. Commun., 1998, 154, 75 CrossRef.
- C. J. Chang, H. C. Wang, G. Y. Liao, W. T. Whang, J. M. Liu and K. Y. Hsu, Polymer, 1997, 38, 5063 CrossRef CAS.
- P. Cheben, F. del Monte, D. J. Worsfold, D. J. Carlsson, C. P. Grover and J. D. Mackenzie, Nature, 2000, 408, 64 CrossRef CAS.
- H. Sirringhaus, P. J. Brown, R. H. Friend, M. M. Nielsen, K. Bechgaard, B. M. W. Langeveld-Voss, A. J. H. Spiering, R. A. J. Janssen, E. W. Meijer, P. Herwig and D. M. de Leeuw, Nature, 1999, 401, 685 CrossRef CAS.
- G. Cipparrone, A. Mazzulla and P. Pagliusi, Opt. Commun., 2000, 185, 171 CrossRef CAS.
- I. D. W. Samuel, I. Ledoux, C. Delporte, D. L. Pearson and J. M. Tour, Chem. Mater., 1996, 8, 819 CrossRef CAS.
Footnote |
| † Present address: Canadian Space Agency, Space Technologies, 6767 route de l'Aéroport, St-Hubert, Québec, Canada J3Y 8Y9. |
| This journal is © the Owner Societies 2002 |

