Determination of phase transfer parameters for the uptake of HNO3, N2O5 and O3 on single aqueous drops
Received
9th July 2001
, Accepted 16th October 2001
First published on 17th December 2001
Abstract
A new method for the investigation of phase transfer on gas–liquid interfaces is introduced. It allows the in situ analysis of single drops that are produced inside a flow tube gas phase reactor. Using this technique, the uptakes of HNO3 and N2O5 on pure water as well as the uptake of O3 on NaI solutions were examined. For HNO3, uptake coefficients γ in the range from 3.1![[thin space (1/6-em)]](https://www.rsc.org/images/entities/char_2009.gif) ×10−3 to 11.8×10⁻³ were measured dependent on the total pressure at 298 K. For N2O5, γ=3.7–9.1×10⁻³ at 293 K was obtained. For iodide concentrations ranging from 2×10⁻² M to 4 M, the uptake coefficient of O3 was in the range of 2.0×10⁻⁴ to 1.5×10⁻².
After correction for the effect of the gas phase diffusion by means of a computer model, the mass accommodation coefficients α were derived from these γ-values, resulting in αHNO3>3×10⁻², αN2O5=(1.1−0.6+1.2)×10−2, and αO3>2×10⁻². Additionally, the ratio of the rate constants for the reactions of NO2+ with iodide and water, respectively, was determined to be 40±12.
×10−3 to 11.8×10⁻³ were measured dependent on the total pressure at 298 K. For N2O5, γ=3.7–9.1×10⁻³ at 293 K was obtained. For iodide concentrations ranging from 2×10⁻² M to 4 M, the uptake coefficient of O3 was in the range of 2.0×10⁻⁴ to 1.5×10⁻².
After correction for the effect of the gas phase diffusion by means of a computer model, the mass accommodation coefficients α were derived from these γ-values, resulting in αHNO3>3×10⁻², αN2O5=(1.1−0.6+1.2)×10−2, and αO3>2×10⁻². Additionally, the ratio of the rate constants for the reactions of NO2+ with iodide and water, respectively, was determined to be 40±12.
I Introduction
It is evident at present that it is not possible to explain a large variety of experimental findings from atmospheric science field studies if the atmosphere is considered solely as a gas phase reactor.1,2 It is necessary to treat it in terms of a multiphase system.3,4 The processes that transfer chemical species from one phase to another represent sinks and sources, respectively, for these substances in either phase. To balance the concentrations in the different atmospheric compartments it is necessary to describe these processes quantitatively. Transfer from the gas phase may occur onto solid particles which is of special interest for understanding the chemical effects of both tropospheric and stratospheric aerosols. Apart from these systems, phase transfer may also occur into atmospheric aqueous particles, i.e. the droplets of clouds, fog and rain as well as the aqueous aerosol.
In the present study, a new method is introduced which allows the investigation of the transfer of atmospheric trace gases from the gas phase into aqueous drops. For N2O5 a number of previous determinations of its uptake coefficient on water surfaces exist.5–8 All these authors employed droplet train or liquid jet techniques and report γ-values in the range from 1×10⁻² to 6×10⁻². Because of the low level of disagreement between the available results, this system seems to be a good test for a new technique.
A few measurements are published concerning the uptake of HNO3 on water. Kirchner et al.6 obtained a lower limit for the mass accommodation coefficient α of 10−2 by means of a liquid jet technique. Agreeing with this, van Doren et al.5 measured α=7×10⁻²−1.93×10⁻¹ for T=293–268 K using a droplet train apparatus. Extrapolation of these values to T=298 K gives α≈6×10⁻². Using the same method, Ponche et al.9 found double this value, α=1.1×10⁻¹, at this temperature.
A wide range of data is covered by the mass accommodation coefficients for O3 on water that have been reported in the past. The first measurement on a bulk surface from Tang et al. in 1987 yielded a very low value of α=5.3×10−4.10 By means of a liquid jet technique, Wunderlich et al.11 obtained a mass accommodation coefficient of 4.2×10⁻³, which is an order of magnitude larger. Using a wetted wall flow tube reactor, Utter et al.12 determined a lower limit for the mass accommodation coefficient of 2×10⁻³. The highest value was given by Hu et al.13 These authors estimated α≈10−1 from droplet train experiments.
II Methods
(1) Experimental set-up
The absorption of trace gases into an aqueous drop was observed using a flow tube reactor. This reactor includes a section for generation and analysis of single stable drops. A glass pipette P1 with a tip diameter between 1.5 and 1.9 mm is inserted in the upper port shown in Fig. 1. It is connected by narrow Teflon tubes T (i.d.=0.8 mm) to two storage vessels V1 and V2 that are mounted slightly higher than the pipette. By means of the three-way-cock C the liquid flow can be either supplied by the content of one of the vessels or totally stopped. One of the vessels usually contains a liquid with the desired composition of the drop for measurements. The second one is filled with pure water (MilliQ) for purging the system when necessary. Both liquids are carefully degassed by stirring and continuously pumping the vapors above them until no bubble formation is observed in the vessels. This is necessary to prevent the
formation of bubbles inside the tubes or the pipette during an experiment that is carried out under reduced pressure conditions. This set-up allows the generation of liquid drops with a definite size by simply opening the cock towards one of the vessels for a certain time. The actual drop size ranges from 2 to 3 mm in diameter and is checked and measured by means of a video image that is produced by a microscope and a camera. For scaling of the image, the diameter of the pipette's tip, which can easily be determined, is used.
 |
| | Fig. 1 Cross-section of the flow tube reactor showing the alignment for generation and analysis of single liquid drops (see text for details). | |
A second pipette P2 is introduced through the port on the left-hand side which allows neat removal of the drop. After the measurements for a particular drop are finished, the cock C is opened to enlarge the drop. When it touches the tip of pipette P2, it is aspirated by capillary forces and drained to the waste reservoir W. To prevent a pressure gradient that would interfere with this process, the other end of the pipette is connected to the flow tube via the port on the right-hand side. This ensures that the pressures on both ends of the pipette are equal. The tips of both pipettes are covered with some layers of Teflon tape to prevent the wetting of their outsides which would result in an indefinite shape of the drop or in draining of used drops on the outside of pipette P2.
A combined light source consisting of a halogen lamp (Osram, 64600, 6 V, 35 W, with reflector) and a deuterium lamp (Hamamatsu, L 6999) is used for optical analysis of the drops. The emitted light is focused on one end of an optical fiber (3M, FP-600-UHT) which leads to the drop. The fiber (depicted as F1 in Fig. 1) is inserted into the pipette P1 deep enough so that it ends exactly at its tip and by this at the top of the drop. It is glued tightly in the upper end of the pipette. After leaving the fiber, the light crossing the drop is partly absorbed depending on the current composition of the liquid. The lower surface of the drop then acts as a lens and focuses the light to the end of a second optical fiber F2 which feeds the light to a grating spectrometer (Spectroscopy & Imaging, SP-140) connected to a diode array (Spectroscopy & Imaging, RY-1024) for detection. This system allows in
situ analysis of the drop's absorption spectrum in the range of 240 to 800 nm. The smallest change in the optical absorbance that is detectable under the present experimental conditions is 5×10⁻³.
The reactor is shown schematically in Fig. 2. It consists of a cylindrical quartz glass tube of 30 cm length with 2.2 cm inner diameter. In addition to the ports for the drop handling, there are ports for the main gas flow inlet, for a pressure gauge (Leybold, CM1000), and for connection to a vacuum system.
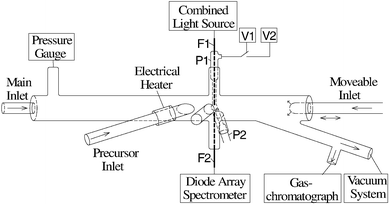 |
| | Fig. 2 Schematic diagram of the flow tube reactor (see text for details). | |
HNO3 vapor was produced by flowing a small amount of He over a liquid mixture of 2 parts concentrated sulfuric acid and 1 part 65% HNO3. The composition of the resulting gas flow was checked by taking a FTIR spectrum offline. The concentration of possible contaminants, e.g. NO2, was below the detection limit (i.e.cNO2<2×10¹¹ molecules cm−3). After premixing, this flow being almost saturated with HNO3, the actual concentration of the trace gas was determined by measuring the absorbance in a 40 cm long cell with quartz windows at λ=200 nm. An absorption cross-section σ of 5.88×10⁻¹⁸ cm214 was used for the calculations. O3 was produced by photolysing a flow of oxygen (>99.999%,
Linde). The concentration produced was determined by measuring the absorbance at 253 nm (σ=1.15×10⁻¹⁷ cm215) without premixing. N2O5 was produced by the method of Davidson et al.16 and stored in a vessel at −50°C to prevent thermal decomposition. By flowing dried He over the solid, the gas phase was enriched with the trace gas. The determination of the concentration was performed using σ=4.7×10⁻¹⁸ cm2 at λ=210 nm.17
After passing the absorption cell, the gas flow containing either HNO3 or O3 was mixed with the humidified main gas flow (>99.999% He, Linde) and injected in the flow tube through the main inlet. There was a pressure gradient between the absorption cell and the main reactor resulting in a change of the gas phase concentrations of HNO3 and O3, respectively. This gradient was determined and the concentrations were corrected accordingly. The flow containing N2O5 was inserted through the precursor inlet while the humidified main gas flow entered through the main inlet. The N2O5 flow entered the main tube approximately 3 cm before the drop.
Immediately before the precursor gas flow enters the main tube it is possible to initiate thermal decomposition of the precursor species with an electrical heater to produce unstable species like radicals. Another inlet which is moveable along the flow tube's axis is mounted on the downstream end of the main tube to allow the initiation of chemical reactions at every desired position of the flow tube. The two latter features were not used in the present study, i.e. the heater was always turned off and no gas was passed through the moveable inlet.
(2) Uptake model
The primary result of each measurement with the single drop apparatus is the change of absorbance of the incoming light with time, dA/dt, at a certain wavelength λi caused by passing through the absorption pathway, i.e. the drop's diameter, of length d. The absorbance A is defined as the (decadic) logarithm of the quotient between the light intensities without and with the presence of the absorbing species, respectively. The absorption coefficient of this species X in the liquid having the concentration cx is εx(λi)
(=d−1cx−1A(λi)). If the number F of molecules of X that are formed when one molecule of the trace gas Y has entered the drop is known the number of molecules of Y that have
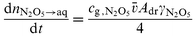
been taken per time unit is given by| |  | (1) |
where Vdr is the volume of the drop which is assumed to be a spherical segment (i.e. a sphere without a cap) with the radius of the pipette P1. The number of molecules of a gas phase species Y with a concentration cg that hit the surface of the drop is given by the kinetic theory of gases: | | 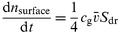 | (2) |
where Sdr is the size of the drop's surface that is exposed to the gas phase; ![[v with combining macron]](https://www.rsc.org/images/entities/i_char_0076_0304.gif) is the average thermal velocity of the trace gas molecules. The quotient of eqns. (1) and (2) gives the uptake coefficient γmeas:
is the average thermal velocity of the trace gas molecules. The quotient of eqns. (1) and (2) gives the uptake coefficient γmeas: | |  | (3) |
This is the net probability for the permanent uptake of a molecule
that hits the surface of the drop. It is the result of the subsequent individual processes (i) gas phase diffusion, (ii) transfer across the surface, (iii) solubility and/or (iv) reactive loss in the liquid phase. The overall process is usually treated in terms of the so-called resistance model.18
Within the present study, a computer simulation was employed to correct the measured uptake coefficients for the effect of the gas phase diffusion, i.e. to calculate the value for the uptake coefficient that would be observed if the gas phase diffusion was infinitely fast. The basis for this simulation is a model which is depicted schematically in Fig. 3. The continuous gas flow around the drop of radius r00 is approximated by the passage of slices of thickness h that are perpendicular to the tube's axis in t discrete time steps (i=1, 2, ... , t−1, t) of duration r00/ut. The term u is the average velocity of the gas flow. The flow velocity near the tube's axis where the drop is situated is assumed to be 2u, corresponding to ideal laminar flow conditions. At the beginning of a simulation
run the regarded slice with a uniform radial concentration profile c(r)=cg is placed at position i=1. The radial diffusion equation
| |  | (4) |
is solved numerically for
r![[greater than or equal, slant]](https://www.rsc.org/images/entities/char_2a7e.gif) r0
r0 with time steps Δ
t and radial steps Δ
r.
Dg is the gas phase diffusion coefficient which is calculated from the binary diffusion coefficients
DA–He and
DA–H2O of the trace gas A in a partial pressure
pHe of helium and a partial pressure
pH2O of
water vapor, respectively, according to
19| |  | (5) |
The radial step Δ
r is set to be equal to
Δ
t.
This allows the transfer across the surface represented by the uptake coefficient
γcorr
(the limiting value for infinitely fast gas phase diffusion) to be introduced in terms of a loss for the innermost Δ
r-layer of the slice at
r=
r0 in the time interval Δ
t:
| | 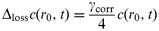 | (6) |
For this the thermal velocities of all molecules are assumed to be equal to
. The slice is shifted to the (
i+
1)th position with a corresponding surface radius
r0(
i+
1) after the time
r00/
ut. The initial concentration profile is the last one of the
ith position. In this way, the entire passage is simulated. The quotient between the numbers of molecules that get lost to the drop during the passage
and the number of molecules that get lost if no change of the initial radial concentration profile occurs is equal to
γmeas/
γcorr.
 |
| | Fig. 3 Schematic diagram of the computer model for simulation of and correction for the effect of the gas phase diffusion. | |
Two major simplifications are included in this model. To limit the CPU time, diffusion between the different slices in the z-direction is neglected. Additionally the corrected uptake coefficient γcorr is assumed to be constant with time. This implies that no saturation of the liquid phase occurs.
III Results and discussion
(1) Uptake of N2O5 on pure water
A typical time course of the absorbance of a drop exposed to a gas phase mixture containing 2.3–4.6×10¹³ molecules cm−3 of N2O5 is shown in Fig. 4. The two typical nitrate anion absorption bands with their maximum absorbances at 300 and 200 nm,20 respectively, are forming. The second band's maximum cannot be fully observed because the optical fiber transmits no light at wavelengths below 240 nm. Behnke et al.21 proposed ionic decomposition of N2O5 into the nitrate anion and the nitronium cation according to | |  | (R-1) |
The latter may react with water: | |  | (R-2) |
or with solutes. Behnke et al. concluded that the direct dissociation via| |  | (R-3) |
accounts for less than 20% of the total nitrate production. For the determination of the uptake coefficient of N2O5, it is only necessary to know how many nitrate ions are formed from one molecule of N2O5. From both pathways F=2 in eqn. (3) can be obtained.
 |
| | Fig. 4 Example of the wavelength dependent time course of the absorbance of a water drop that is exposed to a gas phase containing N2O5 or HNO3. | |
To correct for small base-line shifts caused by small temporal changes in the size and shape of the drop, the difference in the absorbances at two different wavelengths (arrows in Fig. 4) are used as the signal. Fig. 5 shows the time courses of the absorbances at 302 and at 345 nm, respectively, together with the difference between them. The latter has a very good linear time dependence, indicating that no saturation effects are occurring. The slopes of the best linear fits are used for the calculation of the uptake coefficients according to eqn. (3).
 |
| | Fig. 5 Correction for base-line shift: the difference between the absorbances at 345 nm and 302 nm, are used for the calculations. | |
All experiments were performed at 293±1 K. The most measurements (24 series including 99 single drops) were made at 10 kPa total pressure. To check the quality of the computer simulation, three series (including 8 single drops) were investigated at 5 kPa total pressure. With the water vapor pressures pH2O=1.05 kPa and pH2O=0.85 kPa eqn. (5) leads to diffusion constants of Dg=334×10−6 m2 s−1 and Dg=582×10−6 m2 s−1, respectively. DN2O5–He=4.46 Pa m2 s−1
(=0.44 atm cm−2
s−1) and DN2O5–H2O=0.97 Pa m2 s−1
(=0.096 atm cm−2 s−1)22 were used for the binary diffusion coefficients. For these two diffusion constants the dependence of the experimentally observable uptake coefficient γmeas on the uptake coefficient without gas phase limitations was calculated. The results are shown in Fig. 6. Using eqn. (3), γmeas=(5.1±1.7)×10−3 was calculated from the slopes of the averaged absorbance vs. time plots for each of the 24 individual series at 10 kPa. The error is double the standard deviation of the calculated values. From Fig. 6 a corrected uptake coefficient of γcorr=(1.1−0.6+1.2)×10−2 can be obtained. The values of the uptake coefficients for the three series at 5 kPa (crosses in Fig. 6) agree with this result. Because of the very rapid reaction of N2O5 with water this value of the corrected uptake coefficient can be identified with the mass accommodation coefficient of N2O5, i.e.
This agrees very well with the values given in the literature,
cf. Introduction and
refs. 5–8.
 |
| | Fig. 6 Calculated dependency of γmeas on γcorr for two different values of the gas phase diffusion constant Dg corresponding to ptotal=10 kPa (- - - -) and ptotal=5 kPa (-·-·-), respectively, mean experimental value (→) and error limits (.....) for ptotal=10 kPa, measurements at ptotal=5 kPa (×) for N2O5. | |
| |  | (R-4) |
From the stochiometry of (R-4)F in eqn. (1) is unity.
As in the N2O5 experiments, the difference of the absorbances at 302 and 345 nm has a linear time dependence, indicating that no saturation occurs, which is due to the very high solubility of HNO3
(Henry's law constant HHNO3=2.1×10⁵ M atm−123) and its dissociation products.
Using DHNO3–He=5.41 Pa m2 s−1
(=0.534 atm cm−2 s−1) and DHNO3–H2O=1.26 Pa m2 s−1
(=0.124 atm cm−2 s−1),5 the dependencies of γmeas on the values of pHe and pH2O
(yielding a certain value of Dg according to eqn. (5)) for different given γcorr were calculated. The results are shown in Fig. 7 together with the experimental values calculated according to eqn. (3). All measurements were carried out at 298±1 K. The
total pressure pHe+pH2O ranged from 7.6 to 82.1 kPa. The water vapor partial pressure was in the range between 1.3 and 2.2 kPa. ε(302 nm)=7.3 mol−1 l cm−1 was used for the molar absorption coefficient of the nitrate ion, which was determined with a commercial spectrometer (Hewlett Packard, HP 8453).
 |
| | Fig. 7 Calculated dependencies of γmeas on γcorr for different values of the gas phase diffusion constant Dg
(lines) and the experimental values (×) for HNO3. | |
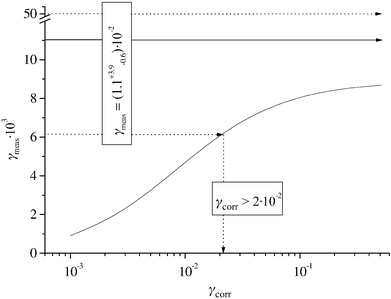
The mean of the experimental data in Fig. 7 lies slightly above the prediction of the model for the highest corrected uptake coefficients possible. Taking into account the scattering of the experimental data as well as the simplifications included in the model, only a lower limit for the corrected uptake coefficient γcorr of 3×10⁻² can be given with certainty. No liquid phase limitation of the uptake coefficient is expected because the acid dissolves very readily. Therefore, γcorr can be identified with the mass accommodation coefficient α for this trace gas, i.e.αHNO3>3×10⁻². This value is in good agreement with literature data (see Table 1).
Table 1 Comparison of available data for the mass accommodation coefficient of HNO3
| Value at T=298 K |
Method |
Author |
| |
|
No temperature was given in the reference.
|
|
Value extrapolated to T=298 K from the temperature dependent data in the reference.
|
|
α
HNO3>10−2a |
Liquid jet |
Kirchner et al.6 |
|
α
HNO3≈5.8±1.5×10⁻²b |
Droplet train |
van Doren et al.5 |
|
α
HNO3=1.1±0.1×10⁻¹ |
Droplet train |
Ponche et al.9 |
|
α
HNO3>3×10⁻² |
Single drop |
This work |
(3) Uptake of O3 on NaI solutions
The uptake of O3 could not be observed directly because of the low solubility and the low light absorption coefficient of O3 in water. Therefore, NaI was used as a liquid phase scavenger for the trace gas taken up, which oxidizes iodide according to:24| |  | (R-5) |
| |  | (R-6) |
| |  | (R-7) |
| |  | (R-8) |
The assignment of the reaction velocities is taken from the cited reference. Because in this previous study comparable concentration conditions (pH, [I−]) existed, these statements are regarded as relevant for our experiment. Additionally, the equilibria | |  | (R-9) |
and | |  | (R-10) |
have to be considered.25 Under the experimental conditions [H+]≈10−7 M, [I−]≥5×10⁻² M and [I2]+[I3−]+[IO3−]<10−5 M, more than 95% of the oxidation products of the iodide are expected to be present as I3−. Hence, the overall reaction of (R-5)–(R-10) is | |  | (R-11) |
A typical time course of the wavelength dependent absorbance of the drop is shown in Fig. 8.
The spectral positions of the two maxima of the I3− absorption pattern are given as λ1=288 nm and λ2=353 nm in the literature.25 The experimental values in this work differ significantly from these values. This is due to the I3− absorption spectrum being strongly dependent on the ionic strength of the solution. Therefore, the absorption spectra of solutions initially containing 10−5 M I2 were determined for different concentrations of NaI (see Fig. 9) by means of the commercial spectrometer. For all iodide concentrations used, more than 95% of the initial I2 concentration is present as I3− according to the equilibrium (R-10).
 |
| | Fig. 8 Example of the wavelength dependent time course of the absorbance of a drop of NaI solution exposed to a gas phase containing O3. | |
 |
| | Fig. 9 Absorption spectra of solutions containing, initially, 10−5 M I2 with different on the iodide concentrations. | |
Fig. 10 shows the time course of the absorbances at three wavelengths before base-line correction (filled symbols). Using these absorbances and the proper absorption spectrum for the individual iodide concentration, a correction for the base-line change (see N2O5 experiments) was performed, assuming the base-line to be straight, underlying the actual spectrum. The corrected values are also given in Fig. 10
(open symbols). The absorbances no longer show a simple linear time dependence. In the first second there is almost no change. This could be due to the fact that the uptake processes primarily change the concentration at the drop's surface. This cannot be observed with the method employed because it is mainly sensitive to the changes in the bulk of the drop. After 1 s, mixing of the drop leads to concentration changes in the drop zone that are accessible to the analyzing
technique. This mixing is probably caused by the gas phase flowing around the drop. In experiments with tiny particles inside the liquid phase the stirring could be visualized. The particles circled through the drop with a frequency of some Hz. After 4 s the stirring reaches an equilibrium which is characterized by a constant slope of the graphs. This dynamic behavior is in general agreement with the behavior found in a recent modeling study.26
 |
| | Fig. 10 Time course of the absorbances at three different wavelengths before (filled symbols) and after (open symbols) base-line correction. The same data as in Fig. 8 were used. | |
The constant slope at 288 nm following the first 4 s in Fig. 10 is the input for dA/dt in eqn. (3), yielding an uptake coefficient γmeas
(using T=293±1 K and cg=6.6–9.0×10¹¹ molecules cm−3) which is dependent on the iodide concentration used.
For an uptake coefficient that is limited by liquid phase reactions the resistance model gives the following expression:18
| |  | (7) |
Here
H is the Henry constant of the trace gas,
R the universal gas constant,
T the temperature,
Dl the liquid phase diffusion constant, and
kI is the pseudo–first order loss rate constant for O
3 in solution. The first term on the right-hand side represents an uptake process which is not limited by the liquid phase because the reaction removes the trace gas taken up infinitely fast. Magi
et al.27 and Hu
et al.13 assumed the reaction between O
3 and iodide to be of first order with respect to the iodide activity
a(I
−) which leads to
kI=
kIIa(I
−)
where
kII is the second order rate constant for the reaction. If this assumption is correct, a plot of 1/
γmeasvs. 1/
a(I
−)
0.5 should yield a straight line with a positive intercept. In
Fig. 11(a) the experimental
γ values are plotted in this way (the activities were calculated from the concentrations using the activity coefficients from
ref. 28). The intercept of the fitted line (1/
γmeas=
(320
±
60)/(
a[M])
0.5−
(150
±
120)) is significantly negative.
 |
| | Fig. 11 Plots of 1/γmeasvs. 1/a(I−)0.5
(a) and 1/a(I−), (b) according to eqn. (7) and assuming the loss reaction for O3 to be first order or second order in I− activity, respectively. | |
Regarding the oxidation mechanism (R-4)–(R-10) other reaction orders with respect to the iodide activity are possible depending on which step is the rate limiting one. If, for instance, reaction (R-7) is the rate limiting step, kI=k(7)a(I−)2 has to be introduced in eqn. (7). The corresponding plot of 1/γmeasvs. 1/a(I−) is given in Fig. 11(b). The linear fit in this plot (1/γmeas=(80±20)/(a[M])+(90±70))
is much more accurate and has a significantly positive intercept. Therefore, it is concluded that the experimental data are represented best by assuming a rate limiting step of second order in iodide activity. According to the previously proposed mechanism (R-5)–(R-10), this step is reaction (R-7).
Two kinds of information can be obtained from the fit in Fig. 11(b). The first one is the uptake coefficient which is corrected for the effect of the liquid phase reactions and equals the reciprocal of the intercept:
| |  | (8) |
Using
Dg=
572
×
10
−6 m
2 s
−1
(with
DO3–He=
6.04 Pa m
2 s
−1 (=0.596 atm cm
−2 s
−1),
DO3–H2O=
1.69 Pa m
2 s
−1
(=0.167 atm cm
−2 s
−1),
12ptotal=
7.6 kPa, and
pH2O=
1.15
kPa from eqn. (5)) the dependence of the experimentally observable uptake coefficient
γmeas on the uptake coefficient without gas phase limitations was calculated. The results are shown in
Fig. 12. The mean value for
γkI→∞ is slightly above the highest predictions of the model calculation, indicating a very high value for the corrected uptake coefficient. Taking into account the error limits of
γkI→∞, a lower limit for
γcorr of 2
×
10
−2 can be given. Because corrections for the liquid phase reactions and the gas phase diffusion were made, this value can be identified with the mass accommodation coefficient of O
3 on
water. This rules out the very low value of Tang
et al.10 This is probably due
to the fact that these authors did not consider the liquid phase saturation that must have a strong influence in their system.
 |
| | Fig. 12 Calculated dependency of γmeas on γcorr for a gas phase diffusion constant Dg=572×10−6 m2 s−1 corresponding to the experimental condition (——). Mean experimental value (→) and error limits (.....) for O3. | |
In view of the present result, the value obtained by Wunderlich et al.11 is also very unlikely. It seems to be possible that a loss of the reaction products (iodide oxidation products) occurred which were analyzed offline because of the volatility of these compounds.
The result of the present work is a confinement of the lower limit given by Utter et al.12 and is consistent with the estimate of Hu et al.13
The second kind of information is the rate constant k7 of reaction (R-7), which can be calculated from the slope of the linear fit in Fig. 11(b), which equals /(4HRTD10.5k70.5). Use of H=1.14×10⁻² M atm−123, Dl=1.85×10⁻⁵ cm2 s−127, T=293 K, and =360 m s−1 gives
| |  | (9) |
Comparable literature data are not available.
(4) Uptake of N2O5 on NaI solutions
Measurements were also performed with drops of aqueous NaI solutions. The nitronium ion formed from N2O5 according to reaction (R-1) can react via another pathway oxidizing the iodide. The following mechanism could lead to the formation of I3−: | |  | (R-12) |
| |  | (R-13) |
| |  | (R-14) |
| |  | (R-15) |
and | |  | (R-16) |
A typical time course of the wavelength dependent absorbance of a drop made of NaI solution is shown in Fig. 13. Similar to the experiments concerning the O3 uptake, the occurrence of two bands at about 290 nm
and 350 nm is observed. Fig. 14 shows the time courses of the absorbance at 288 nm for the four different iodide concentrations used after a correction for the base-line shift. 20, 26, 23, and 19 single drops were used for averaging for iodide concentrations of 10−2 M, 2×10⁻² M, 4×10⁻² M, and 8×10⁻² M, respectively.
 |
| | Fig. 13 Example of the wavelength dependent time course of the absorbance of a drop of NaI solution that is exposed to a gas phase containing N2O5. | |
In the first 5 s the slopes of the graphs vary due to the mixing of the drop (see above). Subsequently, the absorbances show essentially linear time dependencies. The slopes of the best linear fits in this region (solid lines in Fig. 14) are taken for calculating the change in I3− concentration according to eqn. (1). The change in the total concentration of the oxidized I species I2 and I3− is a factor G larger than this. According to the equilibrium (R-16), G is given by
| |  | (10) |
Neglecting the direct hydrolysis
(R-3), the fraction of the N
2O
5 molecules taken up that enter pathway (R-12) and initiate the oxidation of iodide is
| |  | (11) |
The numerator of the left-side of
eqn. (11) is given using
eqns. (1) and (10) while the denominator is given by
| |  | (12) |
Merging
eqns. (1), (10), (11), and (12) and subsequent rearrangement yields
| |  | (13) |
Fig. 15 shows a plot of
Φvs. the iodide concentration (
γN2O5=
5.1
×
10
−3 was used). The best linear fit is a line through the origin indicating that the model describes our experiment sufficiently. The slope gives the ratio of the rate constants
for the two possible loss reactions
(R-2) and
(R-12) for the nitronium ion. One possible error in this determination is the negligence of the direct hydrolysis of the N
2O
5, which accounts for up to 20% of the total N
2O
5 loss according to Behnke
et al.21 We estimate an overall error of 30% for the ratio.
| |  | (14) |
Using the estimate
k10=
3
×
10
7 M
−1 s
−1 given by Frenzel
et al.29 yields
k12=
1.2
±
0.4
×
10
9 M
−1 s
−1. To our knowledge, this is the first determination of this rate
constant.
 |
| | Fig. 14 Base-line corrected time courses of the absorbances at 288 nm of a drop that is exposed to a gas phase containing N2O5 for the four different NaI concentrations used (broken lines); best linear fits for the regions with constant slopes are also shown (solid lines). | |
 |
| | Fig. 15 Plot of Φvs. the initial iodide concentration according to eqn. (13). | |
IV Summary and outlook
A novel technique for the investigation of trace gas uptake on liquid surfaces is introduced. It allows the in situ analysis of single liquid drops by absorption spectroscopy. Using this apparatus, the uptake coefficients for HNO3 and N2O5, respectively, on pure water were measured. Additionally, the uptake coefficients of O3 and N2O5, respectively, on NaI solutions were determined. Using a model for the description of the gas phase diffusion the zero pressure limits were calculated from the measured values. For HNO3 and N2O5, these limits were identified with the mass accommodation coefficients for these species, yielding αHNO3>3×10⁻² and αN2O5=(1.1+0.6+1.2)×10−2.
The agreement of the latter result with the very well-known literature value can be considered as a validation for the capabilities of the new technique. From the measurements on NaI solutions a lower limit for the mass accommodation coefficient of O3
(αO3>2×10⁻²) was extracted as well as the rate constant for the O3–iodide reaction, k=(9.6+2.1+2.8)×109 M−2 s−1. In contrast to preceding investigations of this reaction by other authors, the reaction was found to be second order in iodide concentration under our experimental conditions. The investigation of the uptake of N2O5 on NaI solutions yielded a ratio for the rate constants of the reactions of the nitronium ion with iodide and water, respectively,
of 40±12.
In the future, measurements for other stable trace gases as well as radicals are planned. Presently, studies of the uptake of the NO3 radical are being performed. The new apparatus may also be used for investigations of organically coated liquid surfaces.
Note added in proof
The given value for the ratio of the rate constants for the reactions of NO2+ with iodide and water, respectively, refers to a yield factor F equal to 2. Due to the uncertain reaction mechanism F=1 could be also possible. This would result in a ratio k12/k2 of 86±26.
Acknowledgements
The present study was supported by the BMBF within the AFS under contract 07AF211. H.H. acknowledges support by the ‘Fonds der Chemischen Industrie’.
References
- T. W. Choularton, R. N. Colvile, K. N. Bower, M. W. Gallagher, M. Wells, K. M. Beswick, B. G. Arends, J. J. Möls, G. P. A. Kos, S. Fuzzi, J. A. Lind, G. Orsi, M. C. Facchini, P. Laj, R. Gieray, P. Wieser, T. Engelhardt, A. Berner, C. Kruisz, D. Möller, K. Acker, W. Wieprecht, J. Lüttke, K. Levsen, M. Bizjak, H.-C. Hansson, S.-I. Cederfelt, G. Frank, B. Mentes, B. Martinsson, D. Orsini, B. Svenningsson, E. Swietlicki, A. Wiedensohler, K. J. Noone, S. Pahl, P. Winkler, E. Seyffer, G. Helas, W. Jaeschke, H. W. Georgii, W. Wobrock, M. Preiss, R. Maser, D. Schell, G. Dollard, B. Jones, T. Davies, D. L. Sedlak, M. M. David, M. Wendisch, J. N. Cape, K. J. Hargreaves, M. A. Sutton, R. L. Storeton-West, D. Fowler, A. Hallberg, R. M. Harrison and J. D. Peak, Atmos. Environ., 1997, 31, 2393 CrossRef CAS.
- R. L. Mauldin III, S. Madronich, S. J. Flocke, F. L. Eisele, G. J. Frost and A. S. H. Prevot, Geophys. Res. Lett., 1997, 24, 3033 CrossRef.
- J. E. Jonson and I. S. A. Isaksen, J. Atmos. Chem., 1993, 16, 99 CrossRef CAS.
- J. Lilieveld and P. J. Crutzen, Nature, 1990, 343, 227 CrossRef.
- J. M. van Doren, L. R. Watson and C. E. Kolb, J. Phys. Chem., 1990, 94, 3265 CrossRef CAS.
- W. Kirchner, F. Welter, A. Bongartz, J. Kames, S. Schweighoefer and U. Schurath, J. Atmos. Chem., 1990, 10, 427 CrossRef CAS.
- C. George, J. L. Ponche, P. Mirabel, W. Behnke, V. Scheer and C. Zetzsch, J. Phys. Chem., 1994, 98, 8780 CrossRef CAS.
- F. Schweitzer, P. Mirabel and C. George, J. Phys. Chem. A, 1998, 102, 3942 CrossRef CAS.
- J. L. Ponche, C. George and P. Mirabel, J. Atmos. Chem., 1993, 16, 1 CrossRef CAS.
-
I. N. Tang and J. H. Lee, The Chemistry of Acid Rains; Sources and Atmospheric Processes, ed. R. W. Johnson and G. E. Gordon, ACS Symposium Series 349, American Chemical Society, Washington, DC, 1987, pp. 109––117. Search PubMed.
-
C. Wunderlich, A. Schlemm, K. Hesse, D. Hupperich and U. Schurath, in Tropospheric Oxidation Mechanisms, Air Pollution Research
Report 54, ed. K. H. Becker, Comm. of the European Communities, Brussels, 1994, Report EUR 16171 EN, pp. 45–50. Search PubMed.
- R. G. Utter, J. B. Burkholder, C. J. Howard and A. R. Ravishankara, J. Phys. Chem., 1992, 96, 4973 CrossRef CAS.
- J. H. Hu, Q. Shi, P. Davidovits, D. R. Worsnop, M. S. Zahniser and C. E. Kolb, J. Phys. Chem., 1995, 99, 8768 CrossRef CAS.
-
W. B. DeMore, S. P. Sander, C. J. Howard, A. R. Ravishankara, D. M. Golden, C. E. Kolb, R. F. Hampson, M. J. Kurylo and M. J. Molina, Chemical Kinetics and Photochemical Data for Use in Stratospheric Modeling, Evaluation Number 12, JPL Publication 97-4, JPL, Pasadena, CA, 1997. Search PubMed.
-
W. B. DeMore, S. P. Sander, C. J. Howard, A. R. Ravishankara, D. M. Golden, C. E. Kolb, R. F. Hampson, M. J. Kurylo and M. J. Molina, Chemical Kinetics and Photochemical Data for Use in Stratospheric Modeling, Evaluation Number 10, JPL Publication 92-20, JPL, Pasadena, CA, 1992. Search PubMed.
- J. A. Davidson, A.
A. Viggiano, C. J. Howard, I. Dotan, F. C. Fehsenfeld, D. L. Albritton and E. E. Ferguson, J. Chem. Phys., 1978, 68, 2085 CrossRef CAS.
- H. S. Johnston and R. Graham, Can. J. Chem., 1974, 52, 1415 CAS.
-
B. J. Finlayson-Pitts and J. N. Pitts, Jr., Chemistry of the Upper
and Lower Atmosphere, Academic Press, San Diego, 2000. Search PubMed.
- D. F. Fairbanks and C. R. Wilke, Ind. Eng. Chem., 1950, 42, 471 Search PubMed.
- I. Wagner, H. Strehlow and G. Busse, Z. Phys. Chem. Neue Folge, 1980, 123, 1 Search PubMed.
- W. Behnke, C. George, V. Scheer and C. Zetzsch, J. Geophys. Res., 1997, 102, 3795 CrossRef CAS.
- G. N. Robinson, D. R. Worsnop, J. T. Jayne and C. E. Kolb, J. Geophys. Res., 1997, 102, 3583 CrossRef CAS.
- H. Herrmann, B. Ervens, H.-W. Jacobi, R. Wolke, P. Nowacki and R. Zellner, J. Atmos. Chem., 2000, 36, 231 CrossRef CAS.
-
Kirk-Othmer, Encyclopedia of Chemical Technology, John Wiley & Sons, 2nd edn. 1967, vol. 14. Search PubMed.
- A. D. Awtrey and R. E. Connick, J. Am. Chem. Soc., 1951, 73, 1842 CrossRef CAS.
- W.-H. Chen, Atmos. Environ., 2001, 35, 2375 CrossRef CAS.
- L. Magi, F. Schweitzer, C. Pallares, S. Cherif, P. Mirabel and C. George, J. Phys. Chem. A, 1997, 101, 4943 CrossRef CAS.
- W. J. Hamer and Y.-C. Wu, J. Phys. Chem. Ref. Data, 1972, 1, 1047 CAS.
- A. Frenzel, V. Scheer, R. Sikorski, C. George, W. Behnke and C. Zetzsch, J. Phys. Chem. A, 1998, 102, 1329 CrossRef CAS.
|
| This journal is © the Owner Societies 2002 |
Click here to see how this site uses Cookies. View our privacy policy here. 