Optical properties of a self-assembled Cu/Cu2O multilayered structure studied in situ during deposition
Elena
Mishina
*ab,
Kazunori
Nagai
a,
Dmitry
Barsky
b and
Seiichiro
Nakabayashi
a
aDepartment of Chemistry, Faculty of Science, Saitama University, Saitama, Saitama 338-8570, Japan. E-mail: elena@chem.saitama-u.ac.jp; Fax: +81 48 858 3814
bMoscow Institute of Radioengineering, Electronics and Automation, prosp. Vernadskogo 78, 117454, Moscow, Russia
First published on 18th December 2001
Abstract
The process of nonlinear electrochemical deposition of Cu/Cu2O multilayers is studied in situ by optical techniques. It is shown that the reflectivity, being sensitive to the composition and structure of the multilayers, hides the presence of periodically repetitive layers. In contrast, second-harmonic generation (SHG) intensity reveals oscillations which follow the potential oscillations occurring during deposition. Both reflectivity and SHG intensity are described self-consistently by a generalized Maxwell–Garnett approximation.
1. Introduction
The presence of quantum-confinement, the most unique property of nanoscale materials, depends strongly on the size of the nano-unit (nanoparticle or nanolayer) and on its composition. Structure-sensitive techniques, such as XRD, electron and scanning microscopies, etc. are mostly used either ex situ for completely prepared structures or in situ in UHV. At the same time, in situ monitoring of nanostructure fabrication is very often not only technologically essential, but also allows understanding and prediction of their important properties. When electrochemical deposition is used for nanostructure fabrication, commonly used techniques become useless for in situ characterization, opening the way for optics as the most suitable probe for the water/solid interface.Very recently, quantum-confined effects were found in electrochemically deposited Cu/Cu2O nanoscale multilayers.1 Electrodeposition of these two materials separately can also give nanoscale materials and is well studied (see for recent examples refs. 2 and 3). However only by nonlinear electrochemical deposition, in which spontaneous potential oscillations occur, can a sophisticated granulated multilayered structure be deposited. In this structure reduction of dimension takes place in two ways: nanometer-size layers (2-D structure) themselves consist of nanoparticles (1-D structure).
The Cu/Cu2O structures consist of two kinds of periodically repetitive layers. The first, usually denoted as Cu, is in reality a copper composite layer and consists of nanoparticles. The second is a copper oxide layer. The structure of the copper composite is not yet clear. Changing the electrodeposition parameters results in a change in the thickness of the layers as well as the layer composition, that leads to a change in the physical properties of the whole structure.4
The presence of metal particles changes drastically the properties of the medium. Due to local plasmon excitation, absorption, scattering and luminescence are highly enhanced in such materials. The higher the order of the optical process, the greater the enhancement caused by local plasmon excitation. For surface enhanced Raman scattering and SHG, enhancement up to 107 has been reported.5,6 For luminescence, enhancement up to 105 was obtained.7 Enhancement of a nonlinear optical process (combined with other advantages, such as symmetry sensitivity) makes SHG-based techniques very useful for diagnostic purposes. For photonic applications enhancement of linear optical processes looks more promising and has started to be used. The surface-plasmon-induced enhancement gives rise to a strong luminescence in Ag/Ag2O nanoparticles that has been suggested for use as a new type of memory device.8 Very recently a local plasmon photonic transistor based on the enhanced scattering by silver particles was invented.9 In any case, correlation between structure, plasmon excitation efficiency and optical properties has to be determined for a better understanding of the fundamental physics as well as the maintenance of a device.
In Cu/Cu2O structures a strong dependence of quantum tunnelling on copper oxide layer thickness was found.1 Reflection and transmission of multilayered structures fabricated with different currents were studied in ref. 4. It was shown that the reflectivity of the multilayers decreases and the transmission through the structure increases with an increase in the current density due to the higher copper concentration in the composite layers. However, no studies of the dependence of optical properties on particle size, that could elucidate the role of local plasmon excitation, have been made.
In this paper we report the results of in situ measurements of linear and nonlinear optical properties of Cu/Cu2O multilayers. Reflectivity and SHG were studied. We show a correlation between the structure (thickness of the layer, particle shape, number of layers, layer composition) and optical properties that were modelled in the frame of the generalized Maxwell–Garnett approximation.
2. Experimental
The deposition solution contained 3 M lactic acid and 0.6 M copper (II) sulfate pentahydrate. All chemicals were from MercWako. The pH of the solution was varied in the range 8.5–10. The deposition current was controlled with an HA-151 Model potentiostat/galvanostat. The oscillation current was recorded either by XY recorder or through a National Instrument analogue/digital converter directly by PC (LabView environment). The working electrode was polycrystalline copper (99.9%, Nilaco) embedded in epoxy frame. The reference electrode was a saturated calomel electrode (Toa-HC-205C) and the counter electrode was a platinum wire. A deposition process can be interrupted at different stages: at the bottom or at the top of potential oscillations, then the upper layer is composite or cuprous oxide respectively.The topography of the multilayers was studied by atomic force microscope (AFM) (using a Nanoscope III, Digital Instruments).
Ex situ and in situ optical measurements were performed. Ex situ reflectance spectra of the multilayers were measured in the range 1.5–3 eV with the use of a Xenon lamp. The reflectance spectrum of the copper substrate (polished and kept in air) was also measured. Polarization of incident and reflected light was controlled by Glan prisms and remained in the plane of incidence. The angle of incidence was 45°.
For the SHG studies radiation from a Q-switched Nd:YAG laser (The Coherent InfinityTM 40–100) was used at a wavelength of λω![[thin space (1/6-em)]](https://www.rsc.org/images/entities/char_2009.gif) =
=![[thin space (1/6-em)]](https://www.rsc.org/images/entities/char_2009.gif) 1064 nm, with a pulse width 3.5 ns, repetition rate 50 Hz, energy 0.2 mJ pulse−1 focused onto a spot of 2.5 mm. The polarization of the fundamental and SHG waves was in the plane of incidence. For ex situ measurements the structures on a substrate were oriented vertically, and the angle of incidence was 45°. The SHG signal was discriminated spectroscopically by appropriate coloured and interference filters and directed into a PMT (Hamamatsu, R7400U-02). The signal from the PMT was processed by a boxcar average-integrator (Stanford Research SR245).
1064 nm, with a pulse width 3.5 ns, repetition rate 50 Hz, energy 0.2 mJ pulse−1 focused onto a spot of 2.5 mm. The polarization of the fundamental and SHG waves was in the plane of incidence. For ex situ measurements the structures on a substrate were oriented vertically, and the angle of incidence was 45°. The SHG signal was discriminated spectroscopically by appropriate coloured and interference filters and directed into a PMT (Hamamatsu, R7400U-02). The signal from the PMT was processed by a boxcar average-integrator (Stanford Research SR245).
For in situ measurements the working electrode was oriented horizontally. A schematic representation of the optical arrangement for in situ measurements is shown in Fig. 1(a). For both SHG and reflectivity measurements the output of a YAG laser was used at 1064 and 532 nm respectively and the signal was processed by a boxcar. Variation of the angle of incidence was restricted by the electrochemical cell size and was about 30°. As the absorption coefficient of cuprous solution is rather high (see Fig.1(b)), the distance between the optical window and the substrate was chosen to keep the same power density on the sample surface as for the ex situ measurements (3–4 mm).
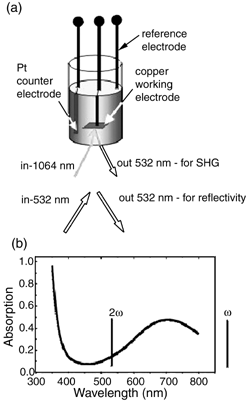 | ||
| Fig. 1 (a) Experimental scheme for in situ measurements of reflectivity and SHG intensity; (b) absorption spectra of cuprous solution used for deposition. | ||
3. Experimental results
The thickness of the layers was estimated using the Faraday law with the copper concentration taken from ref. 12 for the same experimental conditions. These data are presented in Table 1 (dcomp and dox is the thickness the composite and oxide layer respectively, pcu is the copper concentration in the composite layer).The structure of the deposited multilayers was studied by AFM. Fig. 2 shows the AFM images of the Cu/Cu2O structures with the composite (a) and cuprous oxide (b) on top. The images confirm that the individual layer consists of particles with in-plane size 20–30 nm in diameter. Nanoparticles form aggregates of average size about 200–300 nm. On average, there is no pronounced difference between the images of the structures with copper composite and cuprous oxide on top. We did not find any changes in lateral particle size when the current density was changed. On the contrary, changing the number of layers leads to an increase in the particle size. Fig. 3 shows the AFM images of the structure, obtained when the deposition process was stopped at the initial stage of deposition (pre-oscillation conditions, N![[thin space (1/6-em)]](https://www.rsc.org/images/entities/char_2009.gif) =
=![[thin space (1/6-em)]](https://www.rsc.org/images/entities/char_2009.gif) 0), and for N
0), and for N![[thin space (1/6-em)]](https://www.rsc.org/images/entities/char_2009.gif) =
=![[thin space (1/6-em)]](https://www.rsc.org/images/entities/char_2009.gif) 2
and N
2
and N![[thin space (1/6-em)]](https://www.rsc.org/images/entities/char_2009.gif) =
=![[thin space (1/6-em)]](https://www.rsc.org/images/entities/char_2009.gif) 5 oscillations (an integer number of oscillations corresponds to a completed process of copper composite deposition). For all three structures the top layer is the copper composite. From the AFM power spectrum analysis the average size of the particles is 12, 20 and 30 nm for N
5 oscillations (an integer number of oscillations corresponds to a completed process of copper composite deposition). For all three structures the top layer is the copper composite. From the AFM power spectrum analysis the average size of the particles is 12, 20 and 30 nm for N![[thin space (1/6-em)]](https://www.rsc.org/images/entities/char_2009.gif) =
=![[thin space (1/6-em)]](https://www.rsc.org/images/entities/char_2009.gif) 0, N
0, N![[thin space (1/6-em)]](https://www.rsc.org/images/entities/char_2009.gif) =
=![[thin space (1/6-em)]](https://www.rsc.org/images/entities/char_2009.gif) 2 and N
2 and N![[thin space (1/6-em)]](https://www.rsc.org/images/entities/char_2009.gif) =
=![[thin space (1/6-em)]](https://www.rsc.org/images/entities/char_2009.gif) 20 respectively. The corresponding area difference for these images is 13, 18 and 47% respectively.
20 respectively. The corresponding area difference for these images is 13, 18 and 47% respectively.
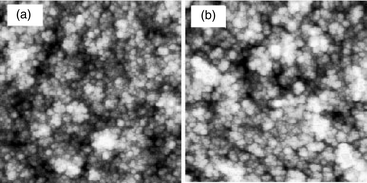 | ||
Fig. 2 AFM images for the structures with copper composite (a) and cuprous oxide (b) on top. Number of completed layers is N![[thin space (1/6-em)]](https://www.rsc.org/images/entities/char_2009.gif) = =![[thin space (1/6-em)]](https://www.rsc.org/images/entities/char_2009.gif) 20, deposition current is 1 mA cm−2. The size of the image is 1 µm 20, deposition current is 1 mA cm−2. The size of the image is 1 µm![[thin space (1/6-em)]](https://www.rsc.org/images/entities/char_2009.gif) × ×![[thin space (1/6-em)]](https://www.rsc.org/images/entities/char_2009.gif) 1 µm. 1 µm. | ||
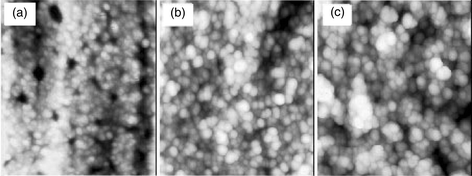 | ||
Fig. 3 AFM images for the structures with (a)
N![[thin space (1/6-em)]](https://www.rsc.org/images/entities/char_2009.gif) = =![[thin space (1/6-em)]](https://www.rsc.org/images/entities/char_2009.gif) 0 (pre-oscillation conditions), (b)
N 0 (pre-oscillation conditions), (b)
N![[thin space (1/6-em)]](https://www.rsc.org/images/entities/char_2009.gif) = =![[thin space (1/6-em)]](https://www.rsc.org/images/entities/char_2009.gif) 2, (c)
N 2, (c)
N![[thin space (1/6-em)]](https://www.rsc.org/images/entities/char_2009.gif) = =![[thin space (1/6-em)]](https://www.rsc.org/images/entities/char_2009.gif) 20. Deposition current is 1 mA cm−2. The size of the image is 0.5 µm 20. Deposition current is 1 mA cm−2. The size of the image is 0.5 µm![[thin space (1/6-em)]](https://www.rsc.org/images/entities/char_2009.gif) × ×![[thin space (1/6-em)]](https://www.rsc.org/images/entities/char_2009.gif) 0.5 µm. 0.5 µm. | ||
Fig. 4(a) shows the spectral dependence of the reflectivity measured ex situ for the structures deposited with different current density. The reflectance spectrum of the copper substrate is also presented. It corresponds to the spectral dependence of the optical constants of bulk copper.10 In comparison with the reflectivity of the copper substrate, the reflectivity of the Cu/Cu2O structures is lower and reveals current-dependent minima around 2.1–2.4 eV. The change in reflectivity spectra of the nanostructures in comparison to the bulk copper arises due to several reasons. If the absorption in the layer is not very high, the main change is due to an interference effect in a thin layer. This effect is dominant, for instance, in thin films of oxidised copper particles.11 If the absorption is high, then the thickness of the layer does not play a significant role, as electromagnetic waves do not penetrate deeply into the film. In this case the optical properties are determined by the outer layers of the structure that are, in turn, determined by the properties of a single particle. The change in deposition current leads to a change in the total thickness of the structure and also the refractive index (due to copper concentration change). Both reasons can cause a shift in the minimum in the reflectivity spectra. To specify the dominant one, modelling of the structure/optical properties is required.
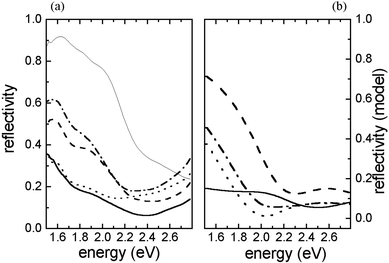 | ||
Fig. 4 (a) Reflectance spectra of Cu/Cu2O multilayers deposited with different current density: (- - -) 2, (-•-•-) 1, (•••) 0.5 and (——) 0.25 mA cm−2, (——) copper substrate. The number of layers N![[thin space (1/6-em)]](https://www.rsc.org/images/entities/char_2009.gif) = =![[thin space (1/6-em)]](https://www.rsc.org/images/entities/char_2009.gif) 20. (b) Reflectivity calculated in the frame of GMG approximation with the thickness of the layers, copper concentration and ellipticity presented in Table 1. 20. (b) Reflectivity calculated in the frame of GMG approximation with the thickness of the layers, copper concentration and ellipticity presented in Table 1. | ||
Reflectivity spectra for the structures with copper composite and cuprous oxide on top are shown in Fig. 5(a). A small reduction in reflectivity is observed for the samples with cuprous oxide on top, while the shape of the spectrum remains almost unchanged.
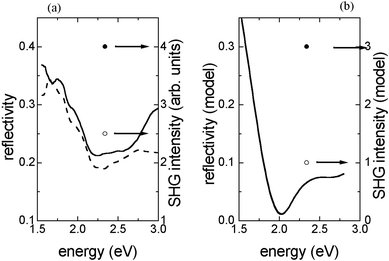 | ||
Fig. 5 (a) Left axis: Reflectance spectra of structures with copper composite (solid line) and cuprous oxide (dashed line) on top. Right axis: SHG intensity for the same samples at SHG photon energy 2.34 eV (solid circle, copper composite on top; open circle, cuprous oxide on top). Number of completed layers is N![[thin space (1/6-em)]](https://www.rsc.org/images/entities/char_2009.gif) = =![[thin space (1/6-em)]](https://www.rsc.org/images/entities/char_2009.gif) 20, deposition current is 1 mA cm−2. (b) Model calculations for reflectivity (left scale) and SHG intensity (right scale) with top composite layer (solid line, filled circle) and top cuprous oxide layer (dashed line, coincident with the solid one, open circle) for the structure with f 20, deposition current is 1 mA cm−2. (b) Model calculations for reflectivity (left scale) and SHG intensity (right scale) with top composite layer (solid line, filled circle) and top cuprous oxide layer (dashed line, coincident with the solid one, open circle) for the structure with f![[thin space (1/6-em)]](https://www.rsc.org/images/entities/char_2009.gif) = =![[thin space (1/6-em)]](https://www.rsc.org/images/entities/char_2009.gif) 0.55, a/c 0.55, a/c![[thin space (1/6-em)]](https://www.rsc.org/images/entities/char_2009.gif) = =![[thin space (1/6-em)]](https://www.rsc.org/images/entities/char_2009.gif) 0.55, dox 0.55, dox![[thin space (1/6-em)]](https://www.rsc.org/images/entities/char_2009.gif) = =![[thin space (1/6-em)]](https://www.rsc.org/images/entities/char_2009.gif) 1 nm, dcomp 1 nm, dcomp![[thin space (1/6-em)]](https://www.rsc.org/images/entities/char_2009.gif) = =![[thin space (1/6-em)]](https://www.rsc.org/images/entities/char_2009.gif) 10
nm. 10
nm. | ||
Fig. 6(a) shows the temporal dependence of in situ reflectivity and corresponding potential oscillations for deposition current 1 mA cm−2. With an increase in the number of deposited layers, the reflectivity first decreases, and then reveals interference-like behaviour with a characteristic period of about 13 layers. For the second period (not shown in Fig. 6) the average reflectivity decreases about 50 times. Fig. 5, 7 and 8 show the results of SHG measurements on the same set of samples. For ex situ measurements an increase in the deposition current leads to a significant increase in the SHG intensity (Fig. 7(a)). In contrast to reflectivity, a large difference was found for the SHG intensity measured for the samples with copper composite and cuprous oxide on top. If the top layer is a composite, the SHG intensity is twice as high as when the cuprous oxide layer is on top (see Fig. 5(a), points, right-hand scale).
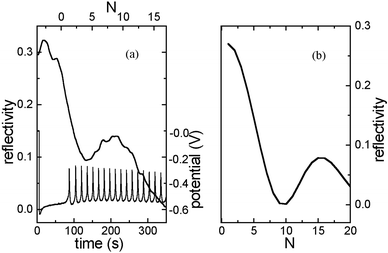 | ||
Fig. 6 (a) Time dependence of reflectivity measured in situ
(thick line) and corresponding potential oscillations (thin line). Deposition current is 1.3 mA cm−2. (b) Model calculations for the structures with a/c![[thin space (1/6-em)]](https://www.rsc.org/images/entities/char_2009.gif) = =![[thin space (1/6-em)]](https://www.rsc.org/images/entities/char_2009.gif) 0.25, f 0.25, f![[thin space (1/6-em)]](https://www.rsc.org/images/entities/char_2009.gif) = =![[thin space (1/6-em)]](https://www.rsc.org/images/entities/char_2009.gif) 0.55, dcomp 0.55, dcomp![[thin space (1/6-em)]](https://www.rsc.org/images/entities/char_2009.gif) = =![[thin space (1/6-em)]](https://www.rsc.org/images/entities/char_2009.gif) 15 nm, dox 15 nm, dox![[thin space (1/6-em)]](https://www.rsc.org/images/entities/char_2009.gif) = =![[thin space (1/6-em)]](https://www.rsc.org/images/entities/char_2009.gif) 1.5 nm. 1.5 nm. | ||
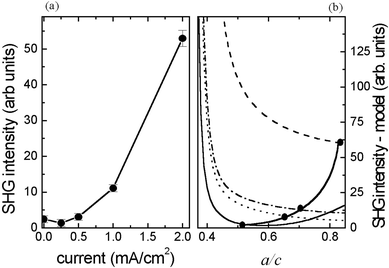 | ||
Fig. 7 (a) SHG intensity dependence on the deposition current density for the structures with N![[thin space (1/6-em)]](https://www.rsc.org/images/entities/char_2009.gif) = =![[thin space (1/6-em)]](https://www.rsc.org/images/entities/char_2009.gif) 20. (b) Model calculation of SHG intensity dependence on ellipticity of spheroids; parameters f, dcomp and dox correspond to the experimental data for appropriate deposition current: (- - -) 2, (-•-•-) 1, (•••) 0.5, and (——) 0.25 mA cm−2. Points and solid line correspond to experimental dependence of the SHG intensity on deposition current. 20. (b) Model calculation of SHG intensity dependence on ellipticity of spheroids; parameters f, dcomp and dox correspond to the experimental data for appropriate deposition current: (- - -) 2, (-•-•-) 1, (•••) 0.5, and (——) 0.25 mA cm−2. Points and solid line correspond to experimental dependence of the SHG intensity on deposition current. | ||
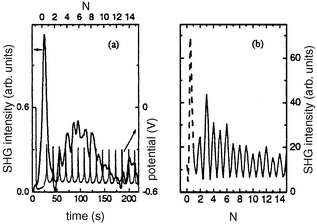 | ||
Fig. 8 (a) Time dependence of the SHG intensity measured in situ
(thick line) and corresponding potential oscillations (thin line). Deposition current is 1.3 mA cm−2. (b) Model calculation of SHG intensity dependence on the number of layers (solid line) with f![[thin space (1/6-em)]](https://www.rsc.org/images/entities/char_2009.gif) = =![[thin space (1/6-em)]](https://www.rsc.org/images/entities/char_2009.gif) 0.56, a/c 0.56, a/c![[thin space (1/6-em)]](https://www.rsc.org/images/entities/char_2009.gif) = =![[thin space (1/6-em)]](https://www.rsc.org/images/entities/char_2009.gif) 0.5, dcomp 0.5, dcomp![[thin space (1/6-em)]](https://www.rsc.org/images/entities/char_2009.gif) = =![[thin space (1/6-em)]](https://www.rsc.org/images/entities/char_2009.gif) 10 nm, dox 10 nm, dox![[thin space (1/6-em)]](https://www.rsc.org/images/entities/char_2009.gif) = =![[thin space (1/6-em)]](https://www.rsc.org/images/entities/char_2009.gif) 1 nm; integer and semi-integer layer number correspond to copper composite and cuprous oxide top layer respectively; dashed line corresponds to a modified model, in which pure copper particles grow on water. 1 nm; integer and semi-integer layer number correspond to copper composite and cuprous oxide top layer respectively; dashed line corresponds to a modified model, in which pure copper particles grow on water. | ||
Fig. 8 shows the temporal dependence of in situ measured SHG intensity and the corresponding potential oscillations. There are three characteristic features in this dependence. First, pronounced oscillations with the same period as the potential oscillations are observed in the SHG signal. Second, a sharp peak of SHG intensity is observed at an initial stage in the structure deposition. The SHG intensity increases while the potential remains constant (we call this condition pre-oscillating). A potential oscillation itself has two stages. In the first stage a small shoulder-like increase in the potential is observed and in the second stage the potential drops strongly. Exactly at the beginning of this shoulder the SHG intensity decreases sharply. During the first potential oscillation the SHG signal continues to decrease, but starting from the second oscillation the SHG intensity follows the potential oscillations. Third, an envelope of
the SHG oscillations shows interference-like behaviour with a period of about N![[thin space (1/6-em)]](https://www.rsc.org/images/entities/char_2009.gif) =
=![[thin space (1/6-em)]](https://www.rsc.org/images/entities/char_2009.gif) 10. Increasing the number of layers to 20 decreases the SHG signal down to the noise level. Changing the deposition current changes the in situ SHG time dependence (see Fig. 9). We measured the in situ temporal dependences of SHG intensity for different deposition currents. Increasing the deposition current leads to an increase in the total SHG intensity, in agreement with ex situ measurements. Interference-like patterns are observed in the SHG envelope with a period being dependent on deposition current. All the structures reveal oscillations corresponding to the potential oscillations only during the first period of interference patterns.
10. Increasing the number of layers to 20 decreases the SHG signal down to the noise level. Changing the deposition current changes the in situ SHG time dependence (see Fig. 9). We measured the in situ temporal dependences of SHG intensity for different deposition currents. Increasing the deposition current leads to an increase in the total SHG intensity, in agreement with ex situ measurements. Interference-like patterns are observed in the SHG envelope with a period being dependent on deposition current. All the structures reveal oscillations corresponding to the potential oscillations only during the first period of interference patterns.
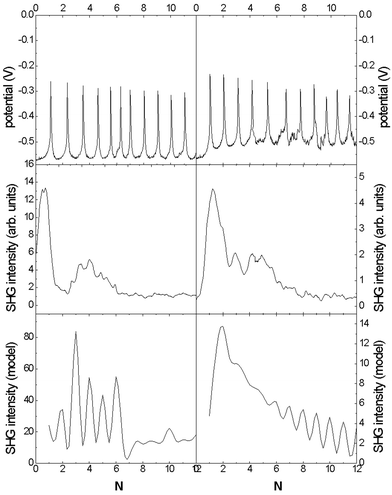 | ||
Fig. 9 The same as Fig. 8(a), but for deposition current 0.8 mA cm−2
(left panels) and 2 mA cm−2
(right panels). For model calculations the following parameters were chosen: for 2 mA cm−2: f![[thin space (1/6-em)]](https://www.rsc.org/images/entities/char_2009.gif) = =![[thin space (1/6-em)]](https://www.rsc.org/images/entities/char_2009.gif) 0.77, a/c 0.77, a/c![[thin space (1/6-em)]](https://www.rsc.org/images/entities/char_2009.gif) = =![[thin space (1/6-em)]](https://www.rsc.org/images/entities/char_2009.gif) 0.5, dcomp 0.5, dcomp![[thin space (1/6-em)]](https://www.rsc.org/images/entities/char_2009.gif) = =![[thin space (1/6-em)]](https://www.rsc.org/images/entities/char_2009.gif) 20 nm, dox 20 nm, dox![[thin space (1/6-em)]](https://www.rsc.org/images/entities/char_2009.gif) = =![[thin space (1/6-em)]](https://www.rsc.org/images/entities/char_2009.gif) 2 nm; for 0.8 mA cm−2: f 2 nm; for 0.8 mA cm−2: f![[thin space (1/6-em)]](https://www.rsc.org/images/entities/char_2009.gif) = =![[thin space (1/6-em)]](https://www.rsc.org/images/entities/char_2009.gif) 0.2, a/c 0.2, a/c![[thin space (1/6-em)]](https://www.rsc.org/images/entities/char_2009.gif) = =![[thin space (1/6-em)]](https://www.rsc.org/images/entities/char_2009.gif) 0.2, dcomp 0.2, dcomp![[thin space (1/6-em)]](https://www.rsc.org/images/entities/char_2009.gif) = =![[thin space (1/6-em)]](https://www.rsc.org/images/entities/char_2009.gif) 8 nm, dox 8 nm, dox![[thin space (1/6-em)]](https://www.rsc.org/images/entities/char_2009.gif) = =![[thin space (1/6-em)]](https://www.rsc.org/images/entities/char_2009.gif) 0.8 nm; pre-oscillation part of deposition process is not shown. 0.8 nm; pre-oscillation part of deposition process is not shown. | ||
4. Model
To describe the linear and nonlinear responses of Cu/Cu2O we consider the following issues: (i) a composite layer is considered to consist of copper oblate spheroids embedded in a cuprous oxide matrix; (ii) both fundamental and SHG fields reflected from the granulated multilayers are calculated using a matrix technique; (iii) the permittivity of the composite layer is calculated in the frame of the generalized Maxwell–Garnett approximation (with local field factors inside/outside spheroids being taken into account), the permittivity of the cuprous oxide layer is taken as the bulk value; (iv) the effective nonlinear susceptibility of the composite layer is introduced, which takes into account local field factors inside/outside spheroids, the nonlinear susceptibility of cuprous oxide layer is taken as for a parallel slab of homogeneous material.In the following we consider issues (i)–(iv) in more detail.
(i) Structural model
The Cu/Cu2O structures consist of two periodic layers. This is confirmed in our experiments by nonlinear optical measurements. Previously, periodicity of the same type of structures was confirmed by TEM12 and Auger spectroscopy.13 One of the two periodic layers is a cuprous oxide layer, the other a composite layer. AFM measurements give the lateral size of the particles as being in the range 20–30 nm. The thickness of the layers estimated using the Faraday law is smaller than the lateral particle diameter. Such particles can fit into the layer if they are oblate spheroids. The model structure of Cu/Cu2O multilayers is shown in Fig. 10.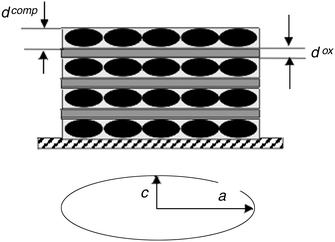 | ||
| Fig. 10 Model structure of Cu/Cu2O multilayers. | ||
(ii) Matrix technique
A matrix technique is a commonly used technique to calculate reflectivity and transmittance of multilayered structures.10 For SHG calculations a matrix approach is not common. It was first suggested in ref. 14 but there the source of nonlinear polarization was located at the boundaries. In our calculations we develop the matrix technique for SHG calculations with nonlinear polarization being located in the bulk of the layer. This consideration requires special analysis. Both copper and cuprous oxide is centrosymmetric in infinite bulk, and dipole-type nonlinear polarization is forbidden for this material. In the Cu/Cu2O structures both layers consist of nanoparticles. Nanoparticles, even in a centrosymmetric medium, generate a strong second harmonic. There are at least two reasons for violation of common symmetry rules valid for the bulk in a particulate medium. First, the surface of the nanoparticles is, as any surface, noncentrosymmetric by definition. Second, the particle shape deviates from centrosymmetric.15 In metal nanoparticles strong enhancement of the SH field is observed due to local field effects (local plasmon excitation). Here consideration we do not discuss the nature of nonlinearity and introduce an effective non-linear susceptibility of the layer. This allows us to calculate the SHG field in a dipole approximation for each thin layer (d![[thin space (1/6-em)]](https://www.rsc.org/images/entities/char_2009.gif) =
=![[thin space (1/6-em)]](https://www.rsc.org/images/entities/char_2009.gif) dox, dcomp
dox, dcomp![[thin space (1/6-em)]](https://www.rsc.org/images/entities/char_2009.gif) ≪
≪![[thin space (1/6-em)]](https://www.rsc.org/images/entities/char_2009.gif) λ, λ is the wavelength of the fundamental wave),16
λ, λ is the wavelength of the fundamental wave),16 | (1) |
![[thin space (1/6-em)]](https://www.rsc.org/images/entities/char_2009.gif) ω and kz,
ω and kz,![[thin space (1/6-em)]](https://www.rsc.org/images/entities/char_2009.gif) 2ω are normal to the layer surface wave vector components: for a
fundamental wave kz,
2ω are normal to the layer surface wave vector components: for a
fundamental wave kz,![[thin space (1/6-em)]](https://www.rsc.org/images/entities/char_2009.gif) ω(ω/c)n(ω)cos
ω(ω/c)n(ω)cos![[thin space (1/6-em)]](https://www.rsc.org/images/entities/char_2009.gif) θ, c is the speed of light in vacuum, n(ω) is the refractive index, θ(ω) is the angle of refraction (for an SH wave ω should be substituted by 2ω); fω and f2ω are the Fresnel factors for the fundamental and SH waves respectively. The effective nonlinear susceptibility χeff, Fresnel factors, refractive indices and angles of refraction should be calculated for each layer (composite and oxide), which is considered as a parallel slab (see (i)). Refractive indices are calculated from the permittivity (see (iii)) by the following equations: n
θ, c is the speed of light in vacuum, n(ω) is the refractive index, θ(ω) is the angle of refraction (for an SH wave ω should be substituted by 2ω); fω and f2ω are the Fresnel factors for the fundamental and SH waves respectively. The effective nonlinear susceptibility χeff, Fresnel factors, refractive indices and angles of refraction should be calculated for each layer (composite and oxide), which is considered as a parallel slab (see (i)). Refractive indices are calculated from the permittivity (see (iii)) by the following equations: n![[thin space (1/6-em)]](https://www.rsc.org/images/entities/char_2009.gif) =
=![[thin space (1/6-em)]](https://www.rsc.org/images/entities/char_2009.gif) n1
n1![[thin space (1/6-em)]](https://www.rsc.org/images/entities/char_2009.gif) −
−![[thin space (1/6-em)]](https://www.rsc.org/images/entities/char_2009.gif) in2, ε
in2, ε![[thin space (1/6-em)]](https://www.rsc.org/images/entities/char_2009.gif) =
=![[thin space (1/6-em)]](https://www.rsc.org/images/entities/char_2009.gif) ε1
ε1![[thin space (1/6-em)]](https://www.rsc.org/images/entities/char_2009.gif) −
−![[thin space (1/6-em)]](https://www.rsc.org/images/entities/char_2009.gif) iε2, ε1
iε2, ε1![[thin space (1/6-em)]](https://www.rsc.org/images/entities/char_2009.gif) =
=![[thin space (1/6-em)]](https://www.rsc.org/images/entities/char_2009.gif) n12
n12![[thin space (1/6-em)]](https://www.rsc.org/images/entities/char_2009.gif) −
−![[thin space (1/6-em)]](https://www.rsc.org/images/entities/char_2009.gif) n22
n22![[thin space (1/6-em)]](https://www.rsc.org/images/entities/char_2009.gif) , ε2
, ε2![[thin space (1/6-em)]](https://www.rsc.org/images/entities/char_2009.gif) =
=![[thin space (1/6-em)]](https://www.rsc.org/images/entities/char_2009.gif) −2n1n2.
The spheroid inclusions are taken into account in the calculations of the permittivity (see (iii) and nonlinear susceptibilities (see (iv)). A matrix technique is applied for electric fields E(ω) and E(2ω) with reflectivity and transmittance calculated for parallel slabs forming the multilayer structure.
−2n1n2.
The spheroid inclusions are taken into account in the calculations of the permittivity (see (iii) and nonlinear susceptibilities (see (iv)). A matrix technique is applied for electric fields E(ω) and E(2ω) with reflectivity and transmittance calculated for parallel slabs forming the multilayer structure.
(iii) Permittivity calculations
The electric field inside/outside a spheroid (Ein/Eout) is changed significantly with respect to the incident field (E0) due to local plasmon excitation. The local field inside a spheroid (Ein(ω)) can be found by solving Laplace's equation, that gives17 | (2) |
![[thin space (1/6-em)]](https://www.rsc.org/images/entities/char_2009.gif) ≪
≪![[thin space (1/6-em)]](https://www.rsc.org/images/entities/char_2009.gif) λ) the shape factor A
λ) the shape factor A![[thin space (1/6-em)]](https://www.rsc.org/images/entities/char_2009.gif) =
=![[thin space (1/6-em)]](https://www.rsc.org/images/entities/char_2009.gif) Aest for elliptical particles is a solution of elliptic integrals of the second kind,6
Aest for elliptical particles is a solution of elliptic integrals of the second kind,6 | (3) |
![[thin space (1/6-em)]](https://www.rsc.org/images/entities/char_2009.gif) =
=![[thin space (1/6-em)]](https://www.rsc.org/images/entities/char_2009.gif) ξ, Q1(ξ)
ξ, Q1(ξ)![[thin space (1/6-em)]](https://www.rsc.org/images/entities/char_2009.gif) =
=![[thin space (1/6-em)]](https://www.rsc.org/images/entities/char_2009.gif) (ξ/2)ln[(ξ
(ξ/2)ln[(ξ![[thin space (1/6-em)]](https://www.rsc.org/images/entities/char_2009.gif) +
+![[thin space (1/6-em)]](https://www.rsc.org/images/entities/char_2009.gif) 1)/(ξ
1)/(ξ![[thin space (1/6-em)]](https://www.rsc.org/images/entities/char_2009.gif) −
−![[thin space (1/6-em)]](https://www.rsc.org/images/entities/char_2009.gif) 1)]
1)]![[thin space (1/6-em)]](https://www.rsc.org/images/entities/char_2009.gif) −
−![[thin space (1/6-em)]](https://www.rsc.org/images/entities/char_2009.gif) 1.
1.
For an oblate spheroid,
![[thin space (1/6-em)]](https://www.rsc.org/images/entities/char_2009.gif) ≤
≤![[thin space (1/6-em)]](https://www.rsc.org/images/entities/char_2009.gif) λ), radiation damping should be taken into account. The first-order correction to the electrostatic solution can be written as a modification of the shape factor by adding a size-dependent term,18
λ), radiation damping should be taken into account. The first-order correction to the electrostatic solution can be written as a modification of the shape factor by adding a size-dependent term,18 | (4) |
![[thin space (1/6-em)]](https://www.rsc.org/images/entities/char_2009.gif) =
=![[thin space (1/6-em)]](https://www.rsc.org/images/entities/char_2009.gif) (4/3)πa2c is the spheroid volume.
(4/3)πa2c is the spheroid volume.
To calculate the permittivity of a composite layer we use the generalized Maxwell–Garnett (GMG) approximation. In the GMG approximation the average permittivity of a medium consisting of randomly oriented spheroids is given by,17
 | (5) |
(iv) Nonlinear optical susceptibility
In the dipole approximation the SHG field of a spheroid nanoparticle can be written as | (6) |
![[thin space (1/6-em)]](https://www.rsc.org/images/entities/char_2009.gif) =
=![[thin space (1/6-em)]](https://www.rsc.org/images/entities/char_2009.gif) Lin2(ω)Lin(2ω)χ. Following the procedure of ref. 17 for calculating the linear susceptibility of a composite layer consisting of randomly oriented spheroids one can obtain for the average nonlinear susceptibility,
Lin2(ω)Lin(2ω)χ. Following the procedure of ref. 17 for calculating the linear susceptibility of a composite layer consisting of randomly oriented spheroids one can obtain for the average nonlinear susceptibility, | (7) |
![[thin space (1/6-em)]](https://www.rsc.org/images/entities/char_2009.gif) =
=![[thin space (1/6-em)]](https://www.rsc.org/images/entities/char_2009.gif) εox/εCuLin(ω) is the local field factor outside the particle. Here we would like to note that an explicit expression for third-order nonlinearity of the medium consisting of spheres embedded in a host material is given in ref. 20. For elliptical particles it was calculated in ref. 21. However, the number of parameters being used in these works is much larger than can be obtained from our sample characterization. Therefore we restrict ourselves to the simplest model, which however takes into account the main feature of our system, i.e. the local fields arising due to the local plasmon excitation in elliptical particles.
εox/εCuLin(ω) is the local field factor outside the particle. Here we would like to note that an explicit expression for third-order nonlinearity of the medium consisting of spheres embedded in a host material is given in ref. 20. For elliptical particles it was calculated in ref. 21. However, the number of parameters being used in these works is much larger than can be obtained from our sample characterization. Therefore we restrict ourselves to the simplest model, which however takes into account the main feature of our system, i.e. the local fields arising due to the local plasmon excitation in elliptical particles.
5. Discussion
In this section we compare experimental and calculated results. Comparison is made for the whole set of experimental data: reflectance spectra and SHG for the samples fabricated with different current, and for the samples with cuprous oxide and copper composite on top, the in situ thickness dependence.Reflectivity spectra calculated in the frame of our model are shown in Fig. 4(b). They have minima that shift from 2.3 to 2 eV with decreasing deposition current and corresponding copper concentration f from 0.77 to 0.53. At the same time the total reflectivity decreases. For the lowest copper concentration (lowest current) the minimum is shifted to 2.5 eV and a shoulder appears around 1.8 eV. The experimental spectra reveal the same behaviour in general, although a shoulder at 1.8 eV does not appear in the numerical result for higher copper concentration. From our calculation it follows that for high copper concentrations the top layers play the most significant role in the observed spectra, while at the lowest concentration, interference in a thin layer becomes dominant. Therefore the shift of the minima in the spectrum for 0.25 mA cm−2 appears to be due to interference and not to the change in ellipticity of a single particle.
We calculate the reflectivity spectra for the structures with copper composite and cuprous oxide on top (Fig. 5(b), left-hand scale). They are coincident to an accuracy of three digits. In the experimental spectra the difference is small but distinct. This might be due to incomplete equivalence of the two structures obtained in the two experiments.
Fig. 6(b) shows the reflectivity dependence on the number of layers. This dependence is clearly interference-like without oscillations. Further increasing the number of layers leads to a significant reduction in reflectivity, and only one more interference maximum can be observed in this dependence. Experimentally we observed only a decrease in reflectivity during the deposition process up to 100 layers. If we consider as a half of an interference period the number of oscillations between the first minimum and the following maximum we obtain the period value NT![[thin space (1/6-em)]](https://www.rsc.org/images/entities/char_2009.gif) =
=![[thin space (1/6-em)]](https://www.rsc.org/images/entities/char_2009.gif) 12. This is in good agreement with the calculated results.
12. This is in good agreement with the calculated results.
The calculated results for the SHG intensity dependence on eccentricity for the samples with different layer thickness and copper composition are presented in Fig. 7(b). The thickness of the layers and the copper concentration were taken close to the experimental values. For low concentrations a strong resonant behaviour due to plasmon excitation of the SHG intensity on the particle eccentricity is obtained. To satisfy the experimental dependence of the SHG intensity on current density, the ratio c/a was chosen using Fig. 7. (The procedure was as follows: the SHG intensity dependence on the ratio a/c was calculated for each current and plotted; then the SHG intensity obtained experimentally for the same current was marked at the calculated dependences by points in Fig. 7(b); the crossection of calculated and experimental dependence gives the corresponding a/c ratio.) Obtained in this way from SHG measurements, the a/c ratio was afterwards used in fitting reflectivity spectra. It can be seen in Table 1 that the c/a ratio decreases while the deposition current density decreases. This is in agreement with our assumption that for smaller current density resulting in thinner layers, the eccentricity of oblate spheroids should be higher in order to inscribe a particle with the same radius observed in AFM (20 nm) into a thinner layer (10 nm).
In contrast to the reflectivity calculations, a rather large difference is obtained for the SHG intensity from the structures with copper composite and cuprous oxide on top (see Fig. 5(b), right-hand scale). This is again in good agreement with the experimental results.
Fig. 8(b) shows the calculated results for the SHG intensity dependence on the number of layers. Starting from one layer, we calculated I2ω(N) using exactly the model structure described above, with copper particles embedded in a cuprous oxide matrix. This gives an oscillating dependence due to the difference in SHG intensity from the structures with copper composite and cuprous oxide on top. An envelope of this dependence arises due to interference of fundamental and SH waves in a thin layer. However, for the described model structure for the initial part of the SHG thickness dependence it is impossible to get the sharp maximum observed in experiment. On the other hand, from the point of view of the deposition process, pre-oscillation conditions are different from the oscillation regime. The deposition process starts on a flat surface with pure copper deposition. Therefore, for the initial stage of deposition we have to use another model structure with copper spheroids surrounded by water. We consider, for simplicity, that during deposition the fraction of copper in a copper/water composite increases linearly, therefore the particle radius increases as t1/3. Not changing the ratio of a/c, we obtained a sharp increase in SHG intensity during the increase in particle size with good agreement with experimental results. On the other hand in the calculation of the SHG temporal dependence in the initial stage of deposition we did not take into account that pre-oxidation starts earlier than the appearance of first potential oscillation. This will make the peak even sharper in addition to the change in a/c ratio. However there is no possibility at the moment of measuring the ratio a/c explicitly during deposition.
In conclusion, the optical properties of Cu/Cu2O multilayers have been studied in situ during nonlinear electrodeposition. In comparison with reflectivity, SHG is shown to be more sensitive for periodic alteration of layers forming the Cu/Cu2O structure.
The optical properties were modelled using a matrix technique for the whole structure and the Maxwell–Garnett approximation for individual composite layers. A strong dependence of the nonlinear-optical properties on the thickness of the layers and the particle shape was shown. Parameters of the structures that can be obtained from non-linear optical measurements can be used to determine linear optical properties and local fields arising at a particulate surface due to local plasmon excitation.
Acknowledgements
This work is supported by Research for the Future (RFTF) Program and by the Japanese Society for the Promotion of Science. The authors thank Dr. A. Karantonis for useful discussions.References
- J. A. Switzer, B. M. Maune, E. R. Raub and E. W. Bohannan, J. Phys. Chem., 1999, 103, 395 CrossRef CAS.
- S. Bandyopadhyay and D. Chakravorty, J. Mater. Res., 1997, 12, 2719 CAS.
- Y. Zhou and J. A. Switzer, Scr. Mater., 1998, 11, 1731 CrossRef CAS.
- J. A. Switzer, C.-J. Hung, E. W. Bohanman, M. G. Shumsky, T. D. Golden and D. C. Van Aken, Adv. Mater., 1997, 9, 334 CrossRef CAS.
- D.-S. Wang and M. Kerker, Phys. Rev. B, 1981, 24, 1777 CrossRef CAS.
- C. K. Chen, T. F. Heinz, D. Ricard and Y. R. Shen, Phys. Rev. B, 1983, 27, 1965 CrossRef CAS.
- D.-S. Wang and M. Kerker, Phys. Rev. B, 1982, 25, 2433 CrossRef CAS.
- L. A. Peyser, A. E. Vinson, A. P. Bartko and R. M. Dickson, Science, 2001, 291, 103 CrossRef CAS.
- J. Tominaga, C. Mihalcea, D. Büchel, H. Fukuda, T. Nakano, N. Atoda, H. Fuji and T. Kikukawa, Appl. Phys. Lett., 2001, 78, 2417 CrossRef CAS.
- D. W. Lynch and W. R. Hunter, in Handbook of Optical Constants of Solids, ed. E. Palik, Academic Press, San Diego, 1998, vol. I. Search PubMed.
- R. Chandra, P. Taneja and P. Ayyub, Nanostruct. Mater., 1999, 11, 505 CrossRef CAS.
- E. W. Bohannan, L.-Y. Huang, F. S. Miller, M. G. Shumsky and J. A. Switzer, Langmuir, 1999, 16, 813 CrossRef.
- J. A. Switzer, C.-J. Hung, L.-Y. Huang, E. R. Switser, D. R. Kammier, T. Golden and E. W. Bohannan, J. Am. Chem. Soc., 1998, 120, 3530 CrossRef CAS.
- H. A. Wierenga, M. W. J. Prins and Th. Rasing, Physica B, 1995, 204, 281 CrossRef CAS.
- O. A. Aktsipetrov, P. V. Elyutin, A. A. Nikulin and E. A. Ostrovskaya, Phys. Rev.
B, 1995, 51, 17
![[thin space (1/6-em)]](https://www.rsc.org/images/entities/char_2009.gif) 591 CrossRef CAS.
591 CrossRef CAS. - N. Bloembergen, Nonlinear Optics, Benjamin, New York, 1965. Search PubMed.
- C. F. Bohren and D. R. Huffman, Absorption and Scattering of Light by Small Particles, Wiley, New York, 1983. Search PubMed.
- P. W. Barber, R. K. Chang and H. Massoudi, Phys. Rev. B, 1983, 27, 7251 CrossRef CAS.
- S. Tougaard and J. Kraaer, Phys. Rev. B, 1991, 43, 1651 CrossRef CAS.
- J. E. Sipe and R. W. Boyd, Phys. Rev. A, 1992, 46, 1614 CrossRef CAS.
- J. W. Haus, N. Kalyaniwalla, R. Inguva, M. Bloemer and C. M. Bowden, J. Opt. Soc. Am. B, 1989, 6, 7 Search PubMed.
| This journal is © the Owner Societies 2002 |

