Mechanism of response enhancement in evaporative light scattering detection with the addition of triethylamine and formic acid
Frantz S.
Deschamps
*,
Arlette
Baillet
and
Pierre
Chaminade
Groupe de Chimie Analytique de Paris-Sud, Laboratoire de Chimie Analytique, Faculté de Pharmacie, 1 rue Jean-Baptiste Clément, 92296 Châtenay-Malabry cedex, France. E-mail: Frantz.Deschamps@cep.u-psud.fr; Fax: 33146835458; Tel: 33146835790
First published on 12th December 2001
Abstract
Triethylamine with an equimolar amount of formic acid added to the mobile phase provides an enhancement of the evaporative light scattering detector (ELSD) response. After characterization of the influence of various parameters on the ELSD response, a sequential strategy was defined to elucidate this response enhancement. The response enhancement was more marked at low mobile phase flow rate, and was highly dependent on solutes and solvents. The influence of drift tube temperature on response enhancement with various solutes demonstrated that triethylamine and formic acid mainly act as mass amplifiers by the inclusion of triethylamine–formic acid clusters inside the droplets.
Introduction
Evaporative light scattering detection (ELSD) was introduced1 in the 1970’s for liquid chromatography (LC). As most analytes are less volatile than LC mobile phases, ELSD provides nearly universal detection. ELSD becomes more and more popular as it is compatible with gradient elution, allows the use of solvents with high UV absorption properties needed in non-aqueous reversed phase liquid chromatography (NARP-HPLC), and is easily integrated in a LC system. However, some drawbacks are encountered with ELSD: non-linear response, dependency of the response on the mobile phase,2 solutes3 and chromatographic peak geometry.4We have previously described the enhancement of the ELSD response5,6 with the addition of 0.1% v/v stoichiometric triethylamine (TEA) and formic acid (FA) in the mobile phase. This behavior was extended to various chromatographic systems and solutes in liquid or supercritical chromatography.7 However, in these studies, a modification of peak geometry with TEA–FA was sometimes noticed, and could potentially explain part of the ELSD response enhancement.6
The aim of this work was therefore to establish if the response enhancement occurs without peak geometry modification, and to elucidate the mechanism of this response amplification.
Experimental
Chemicals
Cholesterol, tripalmitin, 1-octadecanol, 1-triacontanol and squalene were purchased from Sigma (St. Quentin Fallavier, France). The pure ceramide, stearoyl-phytosphingosine, was a generous gift of Cosmoferm (Delft, The Netherlands). All solvents were HPLC-grade from Fisher Scientific (Elancourt, France). Chloroform was stabilized with about 0.75% ethanol. The same batch of chloroform was used throughout the study.Direct flow injection set-up
A Thermo Separation Products P1000 XR gradient pump with a TSP SCM1000 (Thermo Separation Products, San Jose, California, USA) vacuum membrane degasser was used. Direct flow injection was made with a Kontron autosampler 360 (Bio-Tek Kontron Instruments, Milan, Italy) equipped with a 20 μL sample loop injection valve. Chromatograms were recorded with a PC-integrator KromaSystem 2000 1.60 (Bio-Tek Kontron Instruments, Milan, Italy). The flow rate was set at 0.4 mL min−1. The autosampler outlet was connected to a stainless steel back-pressure regulator. Ceramide solutions were prepared daily from a 0.4 mg mL−1 stock solution of ceramide in chloroform. The desired volume of stock solution was measured, evaporated to dryness under a gentle stream of nitrogen, and diluted in the mobile phase. All calibration curves were established using at least 5 different concentration levels, injected 6 times. Detection was performed with a Cunow DDL 11 ELSD (Eurosep, Cergy, France). The drift tube temperature was set at 40 °C, air pressure at 1 bar and gain at 7. The DDL 11 incorporates a nebulisation chamber in order to eliminate the larger droplets to the waste outlet via a siphon. As non-aqueous pure solvents were used, the nebulisation efficiency was too high to continuously fill the siphon. The siphon was then regularly filled with Milli-Q water (Millipore).Chromatographic-like set-up
Measurements were made with a 525 pump including a Degasys DG 3310 degasser and equipped with a variable volume autosampler 565 from Bio-Tek Instruments (Milan, Italy). Injection volumes ranged from 1 to 20 μL. The chromatograms were recorded with a Kroma system 2000 version 1.61 Bio-Tek Instruments (Milan, Italy). A size exclusion chromatography (SEC) guard column, 50 × 7.5 mm PL-Gel 5μm 100 Å from Polymer Laboratories (Shropshire, UK), followed by a stainless steel back-pressure regulator was used. Both guard column and back-pressure regulator were thermostated at 25 °C with a HPLC 582 column thermostat Bio-Tek Instruments (Milan, Italy). Detection was performed with a Sedex 55 ELSD (Sedere, Alfortville, France). The instrument gain was set at 7, and nitrogen pressure at 2 bar. The Sedex 55 is equipped with a nebulisation chamber. As for the DDL 11 detector, the siphon had to be carefully filled at the same level with water. A slight variation of water level in the siphon led to dramatic variations of ELSD response.All samples were prepared daily from 0.5 mg mL−1 stock solutions in chloroform. After evaporation under a stream of nitrogen, samples were dissolved at the desired concentration in the mobile phase.
Principles and theory of ELSD
In LC combined with ELSD, the effluent from a chromatographic column enters a nebuliser where a primary aerosol is produced with the aid of a carrier gas. The surface volume mean droplet diameter Dsv, also known as the Sauter mean diameter, of this wet aerosol can be calculated from the Nukiyama and Tanasawa empirical equation:8 | (1) |
In spite of its restricted boundary conditions, this equation appears to have general validity as previously reviewed.3 When applied to ELSD, the main boundary conditions of eqn. (1) for an accurate prediction of the Sauter mean diameter are a liquid density between 0.7 and 1.2 g mL−1, thus excluding chloroform or dichloromethane, and its validity only for droplet diameters in the range 15–90 μm. The second term of eqn. 1 can be adjusted over a considerable range by changing the ratio of gas and mobile phase flow rates. The primary aerosol is at least somewhat polydispersed and may be simulated by the log-normal size distribution of Mugele and Evans4,9,10 for pneumatic nebulisers. From eqn. (1) it is demonstrated that, at constant liquid and gas flow rates, the droplet diameter is a function of the mobile phase surface tension, density and viscosity, and, due to their high dilution, not of the solutes.
After this nebulisation step, the primary aerosol enters the evaporation chamber, where the droplets shrink while the solvent vaporizes in the drift tube. This aerosol will be named the secondary aerosol. After complete solvent evaporation, the diameter (D) of a particle entering the detection chamber can be calculated from the corresponding wet droplet diameter of the primary aerosol D0 as in eqn. (2)
| D = D0.(C/ρ)1/3 | (2) |
It has to be pointed out that most of the ELSD response simulations1,4,10,11 consider that the aerosol, which enters the detection chamber, has the same distribution as the wet aerosol, only scaled down to a smaller size. However, it was found that the aerosol distribution entering the optical cell is not properly described by eqn. (1) and the proposed log-normal distribution.3 A modification of the particle size distribution was suspected. Some of the larger aerosol droplets can be lost by impaction on the surfaces of the drift tube or spray chamber. This phenomenon is obvious and visible with detectors equipped with a low-temperature spray chamber designed to eliminate the larger droplets, as the herein studied DDL 11 and SEDEX 55 detectors. A loss of analyte and shift of aerosol distribution can also be produced by gravitational settling and centrifugal effect, depending on the configuration of the detector.12 Some droplets may also coagulate,13 mainly in dense aerosol and turbulent aerosol formation stages. Moreover, in the case of ionic solutions, an aerosol ionic redistribution has been suggested.14 Thus, the aerosol which enters the detection chamber is called the tertiary aerosol, as it results both from the decrease in size of the primary aerosol and a shift in particle size distribution of the theoretical secondary aerosol.
The particles of the tertiary aerosol enter the detection chamber where three light scattering mechanisms can occur depending on the ratio of scatterer diameter to incident wavelength: Rayleigh scattering, Mie scattering and reflection–refraction. The consequences of this complex scattering phenomenon on ELSD response have been discussed elsewhere,1,4,12,15 and are beyond the scope of this work. The interaction of light with a particle depends on its size, shape and surface properties. An important feature is that the ELSD response depends on the peak geometry, as previously reported for the influence of peak width.4
ELSD provides a non-linear response, resulting from the various light scattering mechanisms and from the particle size distribution. The non-linear ELSD response is described by the widely used empirical model.16
| y = amb | (3) |
Results and discussion
Various hypotheses could be proposed to account for the ELSD response enhancement with the addition of TEA–FA to the mobile phase. The modification of response may result from a modification in peak geometry (width, shape) induced by these additives. For the ELSD part of the chromatographic system, the response enhancement may be linked to a modification of the primary or tertiary aerosol. The addition of TEA–FA may be thought to sufficiently modify the properties of the mobile phase (surface tension) to produce a change in the primary aerosol, as seen from eqn. (1). The effects of TEA–FA on the tertiary aerosol are possibly modifications in particle shape or nature, of scatterer size distribution rearrangement or of residual mobile phase amount in the droplets.The first step in this work was therefore to establish that the response enhancement occurs in the absence of peak geometry modification and is thus related to a pure ELSD phenomenon. A flow injection set-up, with a constant injected volume, was used to ensure a constant solute concentration profile at the entry to the detector. The necessary addition of both TEA and FA for the response enhancement was also checked with this experimental set-up.
To elucidate the response enhancement mechanism, a chromatographic-like experimental set-up was designed to extend the study to real chromatographic conditions. This set-up used an SEC guard column, in order to produce a constant solute dispersion at the entry to the detector for any solutes or solvents. The effect of mobile phase flow rate was first studied. The dependency of response enhancement on solutes was then assessed. If the response was found to be solute independent, then it could be inferred that the response enhancement was only linked to a nebulisation modification. On the contrary, a modification of the tertiary aerosol was suspected with a solute dependent response enhancement, however not excluding an effect of TEA–FA on nebulisation. The influence of drift tube temperature was then studied, as it is the unique ELSD parameter that acts only on the tertiary aerosol.
Direct flow injection set-up
The first step in this work was to study the response enhancement with constant peak geometry at the detector inlet. Ceramide was selected as the test compound, because the response enhancement was first demonstrated with this compound.5 It was previously established, during real chromatographic runs, that the response enhancement occurred only when TEA and FA were both present in the mobile phase.5 This fact was checked with the flow injection set-up, to exclude any effect of an eventual peak profile modification. As seen from Fig. 1, the response amplification occurred only with the addition of a mixture of TEA–FA to the mobile phase. | ||
| Fig. 1 Effect of TEA and FA on response enhancement. Flow injection set-up. Mobile phase: chloroform. Injection of 1 μg of ceramide. n = 6. Other experimental conditions as in Table 1. | ||
The response enhancement dependency on solvents was then studied. Various pure solvents were selected from among the common solvents used in NARP-HPLC.17 Acetonitrile, a common weak solvent in NARP-HPLC, was not studied because of the low solubility of ceramide in this solvent. Table 1 presents the response curve coefficients according to eqn. (3) with 6 pure solvents: chloroform, dichloromethane, toluene, methanol, propan-2-ol and propan-1-ol.
| Without TEA–FA | With 0.1% v/v TEA–FA | ||||||
|---|---|---|---|---|---|---|---|
| a | b | r 2 | a TEA–FA | b TEA–FA | r 2 TEA–FA | a TEA–FA/a | |
| Chloroform | 16.45 | 0.73 | 0.986 | 67.58 | 0.78 | 0.989 | 4.1 |
| Dichloromethane | 6.00 | 1.01 | 0.988 | 183.38 | 0.97 | 0.971 | 30.6 |
| Methanol | 2.36 | 1.16 | 0.997 | 30.16 | 1.23 | 0.994 | 12.8 |
| Propan-1-ol | 2.46 | 1.28 | 0.997 | 4.18 | 1.1 | 0.998 | 1.7 |
| Propan-2-ol | 3.25 | 1.07 | 0.996 | 9.87 | 1.03 | 0.996 | 3.0 |
| Toluene | 1.95 | 0.86 | 0.984 | 13.94 | 1.14 | 0.981 | 7.1 |
With all solvents tested, b ranged from 0.73 to 1.28, with values close to unity for dichloromethane and propan-2-ol. These values are in the lower portion of the range of theoretical values for the different possible light scattering processes. With the same detector used with a conventional chromatographic set-up and similar mobile phase flow rates and detector settings, we usually observed higher b values, often close to the maximal value of 2.18
However, no column was herein used, resulting in a peak width and broadening lower than in a chromatographic experiment. Peaks were very sharp (peak width at half height 0.08 min) with unsymmetrical tailed shapes (skewness was about 1.6). With sharp peaks, the scatterer diameters are higher than with broad peaks as predicted from an increase in concentration in eqn. (2). Thus, the Rayleigh theory applies over a sharper range of particles than with dispersed peaks, resulting in lower b values. The inverse effect was previously described with highly dispersed peaks, where the response tends to become exponential with increasing peak broadening.4 This previous study4 also demonstrated that the photomultiplier detection efficiency decreases with high sample loads and increasing particle concentration in the detection chamber. The concentration of particles in the detection chamber is also higher with sharper peaks. Thus, it is important to underline that these b values are only representative of this flow injection experimental set-up, not of chromatographic experiments.
The marked response increase with TEA–FA led to the injection of different sample loads to remain in the operating zone of the ELSD with the same detector settings. It is worth pointing out that, as previously described,4 the shape of the ELSD response is highly dependent on the sample load. No definitive interpretations can then be drawn from the experimental variations of b with the addition of TEA–FA, due to the difference in injected mass.
An important feature is the high variability in response enhancement with the solvents assessed. The increase in a ranged from a factor 1.7 for propan-1-ol to 30.6 for dichloromethane. The ELSD response enhancement will then exhibit strong variations if a chromatographic analysis is performed under gradient elution conditions.
We can, for the first time, conclude that the response enhancement with the addition of TEA–FA occurs even in the absence of peak geometry modification and thus is related to a pure ELSD phenomenon.
Chromatographic-like set-up
The response curves obtained with the flow injection set-up were not representative of chromatographic response curves. To extend the results to real chromatographic conditions, it was necessary that the solutes enter the detector with a chromatographic-like concentration profile. Moreover, the solute dispersions at the inlet of the detector had to be equal for all solutes. For the selected solutes, these requirements hinder the use of a unique mobile and stationary phase system. We thus used a SEC guard column to approach a gaussian peak profile at the ELSD inlet. With this set-up, all solutes emerged with the injection solvent in the total permeation volume. The samples had thus to be dissolved in the mobile phase. With a flow rate of 0.4 mL min−1, the peak maximum was measured at 3.36 min with an acceptable gaussian shape (skewness from 1.10 to 1.32), and a peak width at half height of about 0.15 min.To study the dependency of response enhancement on solutes, a rational range of compounds, in terms of functionality and physical properties, was considered. As seen in Table 2, besides the previously studied ceramide (CER), cholesterol (CHOL), two long-chain alcohols 1-triacontanol (TRIAC) and 1-octadecanol (OCTA), a neutral lipid tripalmitin (TRIPAL), and the volatile all-trans isoprenoid squalene (SQUAL) were studied. It was important to choose a solvent exhibiting a moderated amplification, in order to minimize the difference in sample loads with and without TEA–FA. The solvent screening demonstrated that, with ceramide, the response was increased by a factor of 4 with chloroform. Chloroform was able to dissolve all tested compounds and was selected.
| Compound | Melting point/°C | Boiling point/°C |
|---|---|---|
| a When anhydrous. b β polymorphic variety. | ||
| Cholesterol (CHOL) | 148.5a | 360 |
| Ceramide (CER) | 122 | N.D. |
| 1-triacontanol (TRIAC) | 87 | |
| 1-octadecanol (OCTA) | 59.8 | 21015 mm Hg |
| Tripalmitin (TRIPAL) | 66b | 310–320 |
| Squalene (SQUAL) | −75 | 28525 mm Hg |
Influence of mobile phase flow rate
In order to select an appropriate mobile phase flow rate, its effect on response enhancement was studied. The effect of liquid flow rate on response has been, to our knowledge, seldom reported. These reports are based on a different experimental set-up, leading to the absence of generalization of mobile phase flow rate influence on the ELSD response. For instance, it has been shown that the response tends to increase with increasing solvent flow rate, as the mean diameter of the primary aerosol droplets increases with increasing liquid flow rate3 [eqn. (1)]. However, this increase in size results in a response increase only if the amount of scattered light per unit volume increases with the particle diameter. Above a critical diameter, the scattering efficiency decreases with increasing particle size.1,4 A further increase in particle size causes the ratio of surface area to volume to decrease, with thus a decrease in scattering efficiency. However, the response was, in this report,3 defined as the concentration plateau height resulting from the injection of a constant solute concentration. This result can then not be extrapolated to the response obtained with chromatographic peaks, where the particle size distribution varies during the peak elution. On the contrary, using a direct injection experimental set-up, other authors have reported a marked decrease in ELSD response with increasing liquid flow rate.19 With real chromatographic peaks, it was also shown that the response tends to decrease with increasing solvent flow rate,4 and the photomultiplier detection efficiency was found to be the main factor responsible for this decrease.Peak area variations for the injection of the same amount of cholesterol are presented in Fig. 2, with the chromatographic-like set-up. The response decreases with increasing mobile phase flow rate with or without TEA–FA. An important feature is the more important decrease in response with increasing flow rate with the addition of TEA–FA. The response at 1 mL min−1, the typical flow rate with conventional HPLC 4.6 mm columns, was similar with and without TEA–FA, while the peak area was 4.5 fold higher with TEA–FA at 0.2 mL min−1. A 0.4 mL min−1 flow rate was selected, as it was the best compromise between analysis time and response enhancement for the tested compounds.
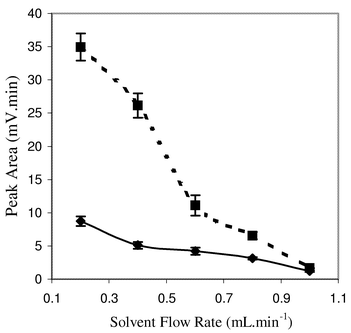 | ||
| Fig. 2 Effect of mobile phase flow rate. Peak area measured for 0.5 μg cholesterol injected with the chromatographic-like set-up. n = 3. Drift tube temperature: 35 °C. Nitrogen pressure: 2 bar. Mobile phase: (–◆–) pure chloroform, (----■----) chloroform with 0.1% v/v TEA–FA. | ||
We cannot, at the present time, interpret without ambiguities the response variation with liquid flow rate observed with our experimental set-up. However, at a 1 mL min−1 flow rate, some condensation of larger particles was noticed on the wall of the nebulisation chamber. Such a condensation may occur at lower flow rate, but the stream of nitrogen may prevent its visual observation, as an immediate uptake of highly volatile chloroform may occur just after condensation on the wall of the nebulisation chamber. It has to be noted that the apparatus, which was studied in the pioneering works on the ELSD response, did not include such a low-temperature spray chamber. A rearrangement in particle distribution, with a decrease in the number of larger particles, is thus suspected to account for the decrease in response enhancement with increasing flow rate.
Influence of solutes
The response enhancement for each selected solute was then determined with standard ELSD conditions, as presented in Table 3. The b values were all higher than 1.39 with a mean of 1.62. These values are consistent with the typical b values we are used to obtaining with this detector. It is worth remembering that b is dependent on various parameters and that, to our knowledge, no interpretation of slight variations in b can be done. The main point is that in every case b remains higher than 1, leading to exponential response curves.| a | a TEA–FA | b | b TEA–FA | r 2 | r 2 TEA–FA | a TEA–FA/a | |
|---|---|---|---|---|---|---|---|
| CER | 14.19 | 66.42 | 1.63 | 1.54 | 0.998 | 0.984 | 4.68 |
| CHOL | 16.65 | 69.63 | 1.65 | 1.66 | 0.994 | 0.987 | 4.18 |
| OCTA | 12.57 | 47.75 | 1.82 | 1.91 | 0.994 | 0.989 | 3.80 |
| SQUAL | 21.65 | 36.39 | 1.69 | 1.52 | 0.997 | 0.990 | 1.68 |
| TRIAC | 16.47 | 26.68 | 1.39 | 1.53 | 0.983 | 0.990 | 1.62 |
| TRIPAL | 21.37 | 32.30 | 1.51 | 1.64 | 0.996 | 0.997 | 1.51 |
| RSD (%) of a | 21.6 | 38.8 |
For each solute, a increases with the addition of TEA–FA. In every case, the peak area increases for the same amount injected, as the eventual slight decrease in b is always compensated by an increase in a. The increase in a for ceramide is close to the previously observed value with the flow injection analysis set-up and DDL 11 detector. The response enhancement is dependent on the solutes, as seen from the ratio aTEA–FA/a, and from the relative standard deviation of a presented in Table 3. The primary aerosol size distribution is only dependent on mobile phase properties. The dependency on solutes thus demonstrates that an eventual modification of the nebulisation properties cannot be the only cause of the response enhancement. A solvent and solute-related phenomenon, independent of nebulisation properties, seems to be the key to the response enhancement with TEA–FA.
Influence of drift tube temperature
Gas flow rate influences the nebulisation process and the distribution of particles in the nebulisation and evaporation chambers, as it modifies the particle and solute concentration, and the particle linear velocity. On the contrary, the drift tube temperature only influences the evaporation process, then the downscaled size of the tertiary aerosol, and the particle distribution rearrangement. The drift tube temperature does not affect the particle size distribution of the primary aerosol, since the SEDEX 55 detector has a nebulisation chamber set at room temperature outside the heated detector part. Thus, the drift tube temperature is the parameter of choice to study the effect of TEA–FA, as we have demonstrated that a modification of the nebulisation process could not be the only cause of response amplification.This parameter has a definitive influence on the tertiary aerosol nature. For instance, partially solvated particles at low temperature can be further dried with increasing temperature. Particles can be in the solid state largely below their melting point, providing that they have the time to precipitate or even crystallize during the residence time in the detector. Irregular and non-spherical particles can then be produced. An increase in temperature results in the formation of liquid particles. It has been clearly demonstrated that solid particles scatter light more effectively than liquid particles of the same size.20 Finally, a solute can partially vaporize, leading to a decrease in particle size.1
The effect of drift tube temperature was then studied by injection of the same amounts of pure solutes with temperature ranging from 30 to 80 °C. Fig. 3 presents the response variation with temperature for each solute, plotted as the relative response compared to 30 °C with pure chloroform or with 0.1% v/v TEA–FA in chloroform. With pure chloroform, tripalmitin, triacontanol and cholesterol responses are not affected by the temperature variation. Thus the particle size distribution and state are constant in this range of temperature. The melting point of tripalmitin is 66 °C, the particles are therefore suspected to be in the liquid state throughout the whole range of temperature. The same behavior is suspected for triacontanol (mp 87 °C). The melting point of cholesterol is 148.5 °C, cholesterol particles are in the solid state as it readily precipitates or crystallizes. The ceramide response decrease between 30 and 50 °C can be related to a melting of particles (mp 122 °C) or to a decrease in particle sizes due to a decrease in residual solvent amount. The response of squalene and 1-octadecanol decreases regularly with increasing temperature, because of the partial vaporization of these solutes.
 | ||
| Fig. 3 Effect of drift tube temperature. Relative response is defined as the ratio of peak area at the selected temperature and of peak area at 30 °C for each solvent system, n = 2. Chromatographic-like experimental set-up. Mobile phase flow rate: 0.4 mL min−1. Nitrogen pressure: 2.1 bar. Amounts injected were 1.75 μg with pure chloroform and 1 μg with 0.1% TEA–FA v/v in chloroform. (–◆–) pure chloroform. (----■----) chloroform with 0.1% TEA–FA v/v. | ||
The same experiment was performed with the addition of 0.1% v/v TEA–FA in chloroform. All other parameters were unchanged. For each solute and at each temperature, the addition of TEA–FA led to a response enhancement, as shown in Table 4 which presents the response curves established at 30 and 80 °C. The response for squalene and 1-octadecanol also regularly decreases with temperature, as seen in Fig. 3. However, at 80 °C, the response for squalene is about 5% of the response at 30 °C, while it was about 15% without TEA–FA. The most important feature is that all non-volatile solutes exhibit a drop in response from 30 to 40 °C, unlike that noticed without TEA–FA. After this drop, the curves for tripalmitin, triacontanol and ceramide show a plateau for higher temperature. The behavior of cholesterol is unique as the curve continuously decreases with increasing temperature.
| Drift tube temperature:30 °C | Drift tube temperature:80 °C | |||||||||||||
|---|---|---|---|---|---|---|---|---|---|---|---|---|---|---|
| a | a TEA–FA | b | b TEA–FA | r 2 | r 2 TEA–AF | a TEA–FA/a | a | a TEA–FA | b | b TEA–FA | r 2 | r 2 TEA–FA | a TEA–FA/a | |
| a RSD. calculated for non volatile compounds : TRIAC. TRIPAL. CHOL. CERA. | ||||||||||||||
| TRIAC | 13.67 | 25.24 | 1.47 | 1.48 | 0.991 | 0.993 | 1.85 | 8.23 | 22.10 | 1.86 | 1.81 | 0.992 | 0.99 | 2.68 |
| TRIPAL | 18.40 | 323.97 | 1.57 | 1.85 | 0.994 | 0.992 | 17.61 | 8.87 | 24.50 | 1.81 | 1.67 | 0.99 | 0.995 | 2.76 |
| CHOL | 20.90 | 107.21 | 1.63 | 1.75 | 0.995 | 0.985 | 5.13 | 8.72 | 20.07 | 1.84 | 1.87 | 0.991 | 0.997 | 2.32 |
| CERA | 14.04 | 328.50 | 1.73 | 1.83 | 0.991 | 0.993 | 23.39 | 7.87 | 24.23 | 1.75 | 1.64 | 0.991 | 0.996 | 3.08 |
| OCTA | 16.00 | 154.42 | 1.70 | 1.03 | 0.985 | 0.985 | 9.65 | |||||||
| SQUAL | 20.87 | 39.34 | 1.72 | 1.63 | 0.995 | 0.993 | 1.89 | |||||||
| RSD (%) for aa | 20.9 | 78.4 | 5.4 | 9.1 | ||||||||||
From these results, it can be concluded that the influence of temperature on the response with and without TEA–FA is solute dependent. The response enhancement was also found to be solute dependent (Table 3). These results demonstrate that a solute-related phenomenon, independent of nebulisation parameters but certainly related to the solvent used, is mainly responsible for the response enhancement with TEA–FA.
Mechanism of response enhancement
The first hypothesis we can advance is a modification of the particle properties induced by TEA–FA. For instance, a modification in shape and surface properties due to a faster or slower nucleation, precipitation, crystallization or change of polymorphic variety, may occur. However, the common curve shape for very different solute structures and chemical classes, such as ceramide, triacylglycerols or triacontanol, is difficult to readily explain with this hypothesis. Moreover, liquid particles are not suspected to undergo such surface properties or shape modification.The second hypothesis is a modification of particle size. If TEA and FA are volatile and compatible with ELSD, they are able to associate in condensed and concentrated phases. The interactions, leading to the formation of ion pairs, are too weak to result in the formation of particles of these volatile solutes during the ELSD process. However, the presence of a solute capable of interactions with these ion association complexes of TEA–FA can dramatically modify this behavior. When emerging from the nebuliser, the droplets are a solution of solute in the solvent/TEA–FA liquid phase. During the process of evaporation, the droplets shrink to a size given by eqn. (2) in case of total solvent evaporation. However, if the solute is capable of non-covalent interactions with TEA–FA ion pairs, some TEA–FA association complexes could still be present inside the droplet. These types of adducts based on non-covalent interactions are well known to occur in liquid chromatography-mass spectrometry.
A mass amplification phenomenon then appears due to the presence of TEA–FA–solutes clusters inside the droplets, and possibly to a higher residual solvent amount inside the particles at low temperature. This assumption is strengthened by the necessary addition of both TEA and FA for response enhancement, which confirms that the formation of TEA–FA association complexes, and the non-covalent interaction of solutes with these ion pairs, within the solute droplet is the key to the amplification process. We can then advance that TEA–FA mainly acts as mass amplifier rather than modifier of the nebulisation process.
Following this mechanism, some interpretations of the curves in Fig. 3 are provided. In the case of liquid particles of tripalmitin, the weak interactions of tripalmitin with TEA–FA adducts can explain the drop in response observed from 30 to 40 °C. An increase in temperature decreases the interactions between TEA and FA, and between TEA–FA and the solute. The particle size then decreases, leading to a drop in response. For triacontanol, bearing one hydroxyl group on one long alkyl chain, the same explanation can be advanced, as for amphiphilic ceramide where non polar alkyl chains are not supposed to interact with TEA–FA.
In the case of cholesterol, the response decrease is noted on the whole range of temperature. Solid particles of cholesterol lead to a strong inclusion of TEA–FA association complexes within the particles. The rigid structure and hygroscopic property of cholesterol may also be responsible for a strong inclusion of clusters inside the particles.
In order to quantify the effect of temperature on response amplification, calibration curves were established at the two extreme temperatures: 30 and 80 °C. The corresponding values of a and b are presented in Table 4.
At a 30 °C drift tube temperature, the a values increase from a factor of 1.8 to 23.4. The dispersion of a values with TEA–AF is considerable, and higher than the dispersion at 40 °C (Table 3), while the dispersion without TEA–AF is equivalent at 30 and 40 °C. This fact confirmed that the response amplification is highly solute dependent, and could be readily explained by the difference in specific interactions between the solutes and TEA–AF ion pairs. It is relevant to note that a dramatic change in the response occurred for 1-octadecanol, where the response tends to linearize with the addition of TEA–AF at 30 °C.
Another important feature is the high response amplification for tripalmitin at 30 °C, while it was one of the lowest at 40 °C. Tripalmitin possesses three polarizable ester groups capable of interactions with TEA–FA. However these interactions are weaker than the interactions resulting from the presence of hydroxyl functions on other compounds. A modification of the supramolecular assembling within the droplet can then be assumed, as it is obviously linked to temperature. At 30 and 40 °C, the response enhancement with the addition of TEA–FA is more marked for octadecanol than for triacontanol. This amplification difference is readily explained by the size of the alkyl chain for both compounds. At an equal solute concentration, a droplet of octadecanol contains more hydroxyl groups, capable of interactions with TEA–FA, than a triacontanol droplet. Thus, a higher amount of TEA–FA can be included in the particle. Squalene always exhibits a low response increase. This low amplification results from the absence of sites capable of hydrogen bonding, or of strong dipole-dipole interactions, confirming the hypothesis of a mass amplification by inclusion of TEA–FA inside the droplets.
The behavior at 80 °C is quite different. With and without TEA–FA, the dispersion of a is low as seen in Table 4. The response curves tend to become close for each non-volatile tested compound. Without TEA–FA, this fact can be related to the high efficiency of the evaporation process at higher temperature. The size of droplets tends to approach the dried particle size described by eqn. (2), and is then only related to the solute density. The rearrangement of particle distribution is also influenced by the drift tube temperature (coagulation, wall precipitation). With TEA–FA, the response curves tend also to become homogeneous. Thus, at higher temperature, the inclusion of TEA–FA clusters within the particles becomes solute independent. The high efficiency and rate of evaporation lead to similar amounts of residual TEA–FA in particles, whatever the solute structure.
Conclusion
By isolating the various ELSD parameters influencing the response, it has been demonstrated that the response enhancement phenomenon with the addition of TEA–FA is mainly governed by the inclusion of TEA–FA association complexes within the solute particles. TEA–FA acts as a mass amplifier. Due to the difference of interactions of solutes with TEA–FA and of supramolecular assembling within the droplets, the mass amplification phenomenon is highly dependent on solutes. A great care should thus be taken when performing quantitative studies with mobile phases containing such additives, as similar compounds may exhibit a very different response enhancement. The complex processes, which govern the ELSD process, also result in a strong influence of mobile phase flow rate, drift tube temperature and solvents on the amplification.At this point in the study, a prediction of the amplification phenomenon may be reached by the use of molecular modelling to describe the interactions of various solutes with TEA–FA within the droplets. A modelling of the aerosol distribution and of its complex and multivariate modification during the residence time in the detector, mainly in the spray chamber, could also be of great value. The lack of response modelling with this kind of detector, where a complex rearrangement of the primary aerosol distribution occurs, remains a gap yet to be bridged in the interpretation of the ELSD response.
Acknowledgements
We thank Pr. Patrice Prognon (Faculté de Pharmacie, Chatenay-Malabry) for her kind and careful reading of the manuscript and helpful comments.References
- J. M. Charlesworth, Anal. Chem., 1978, 50, 1414 CrossRef CAS.
- P. A. Asmus and J. B. Landis, J. Chromatogr., 1984, 316, 461 CrossRef CAS.
- R. M. Righezza and G. Guiochon, J. Liq. Chromatogr., 1988, 11, 1967.
- P. Van der Meeren, J. Vanderdeelen and L. Baert, Anal. Chem., 1992, 64, 1056 CrossRef CAS.
- K. Gaudin, P. Chaminade, D. Ferrier and A. Baillet, J. Liq. Chromatogr. Relat. Technol., 2000, 23, 387 CrossRef CAS.
- K. Gaudin, P. Chaminade, D. Ferrier and A. Baillet, Chromatographia, 1999, 50, 470 Search PubMed.
- F. S. Deschamps, K. Gaudin, E. Lesellier, A. Tchapla, D. Ferrier, A. Baillet and P. Chaminade, Chromatographia, 2001, 54, 607 Search PubMed.
- S. Nukiyama and Y. Tanasawa, Trans. Soc. Mech. Eng., 1938, 4, 86 Search PubMed.
- R. A. Mugele and H. D. Evans, Ind. Eng. Chem., 1951, 43, 1317 Search PubMed.
- T. H. Mourey and L. E. Oppenheimer, Anal. Chem., 1984, 56, 2427 CrossRef CAS.
- L. E. Oppenheimer and T. H. Mourey, J. Chromatogr., 1985, 323, 297 CrossRef CAS.
- J. A. Koropchak, L. E. Magnusson, M. Heybroek, S. Sadain, X. H. Yang and M. P. Anisimov, Adv. Chromatogr., 2000, 40, 275 Search PubMed.
- V. F. Grigor’ev, D. G. Lisienko, V. N. Muzgin and V. L. Zolotavin, J. Appl. Spectrosc. (USSR), 1974, 21, 848 Search PubMed.
- J. Farino and R. F. Browner, Anal. Chem., 1984, 56, 2709 CrossRef CAS.
- M. Dreux, M. Lafosse and L. Morin-Allory, LC-GC Int., 1996, 9, 148–156 Search PubMed.
- G. Guiochon, A. Moysan and C. Holley, J. Liq. Chromatogr., 1988, 11, 2547 CAS.
- S. Heron and A. Tchapla, Analusis, 1993, 21, 269 Search PubMed.
- J. Y. Zhou, P. Chaminade, K. Gaudin, P. Prognon, A. Baillet and D. Ferrier, J. Chromatogr., A, 1999, 859, 90 CrossRef.
- J. L. Robinson, M. Tsimidou and R. Macrae, J. Chromatogr., 1985, 324, 35 CrossRef CAS.
- A. Stolyhwo, H. Colin and G. Guiochon, J. Chromatogr., 1983, 265, 1 CrossRef CAS.
| This journal is © The Royal Society of Chemistry 2002 |