Validation of the Willems badge diffusive sampler for nitrogen dioxide determinations in occupational environments
Annika
Hagenbjörk-Gustafsson
*a,
Roger
Lindahl
a,
Jan-Olof
Levin
a and
Doris
Karlsson
b
aNational Institute for Working Life, Programme for Chemical Exposure Assessment, P.O. Box 7654, S-907 13 Umeå, Sweden. E-mail: annika.hagenbjork@niwl.se; Fax: +46(0) 90 17 61 23; Tel: +46(0) 90 17 60 51
bDepartment of Environmental Health, Umeå University, S-901 87 Umeå, Sweden
First published on 6th December 2001
Abstract
The Willems badge, a diffusive sampler for nitrogen dioxide, has previously been validated for ambient air measurements. This paper describes the laboratory and field validation of the Willems badge for personal sampling under working environment conditions. The mean sampling rate in the laboratory tests was 46 ml min−1, with an RSD of 12%. No statistically significant effects on sampling rate of the sampling time, concentration of NO2 or relative humidity were found. A slightly decreased sampling rate was observed at low wind velocity. This was also confirmed during static sampling, which makes the sampler less appropriate for static sampling indoors. No back diffusion was observed. Storage of the samplers for two weeks before or after exposure did not affect the sampling rate.Our analysis is based on a modified colorimetric method, performed by FIA (flow injection analysis). This technique was compared to ion chromatography analysis. The use of ion chromatography lowered the detection limit from 11 to 2 μg m−3 for an 8 h sample, and furthermore enabled the detection of other anions. In conclusion, the diffusive sampler was found to perform well for personal measurements in industrial environments.
Introduction
Nitrogen oxides (NOx) are a large and complex group of compounds, and key components of two of the most important pollution problems: acid rain and photochemical smog. Nitrogen dioxide (NO2) is considered the most toxic form of NOx,1 and is therefore the most important compound from the viewpoint of human exposure. NO2 is a highly reactive, poorly water-soluble gas and therefore has a greater effect on distal airways when compared, for example, to the highly water soluble gas sulfur dioxide.2 Because of its low solubility, the effects and symptoms of the gas are delayed and exposure is often not noticed early by the subject, which leads to prolonged and more damaging exposure.2 The toxicity of nitrogen dioxide probably depends on its free radical and oxidative properties, which can cause alterations in the mammalian lung. The ability of nitrogen dioxide to form nitrous acid and nitric acid on the moist surfaces of the air spaces also contributes to its toxicity.3 Several studies have revealed an increase in respiratory illness in people exposed to nitrogen dioxide, as well as increased susceptibility to airway infections.4The main sources of nitrogen dioxide in outdoor air are emissions from motor vehicles and burning of fossil fuels such as coal, oil and natural gas. Indoor sources of NO2 include combustion appliances such as gas stoves, pilot lights, wood stoves, fireplaces, gas- and kerosene-fueled space heaters and gasoline engines.5 Nitrogen dioxide exposure occurs in many occupations, including bus garage workers, agricultural workers (silo filler’s disease), welders, firefighters, street cleaners,6 crews on car ferries, miners, glass craftsmen, bridge and tunnel workers, and bus drivers. Industries associated with nitrogen dioxide are explosives factories, chemical factories, dye/lacquer factories, aerospace, metal cleaning/engraving/electroplating, diesel and jet engines industries.2 Exposure to high levels of NO2 may also occur in military combat situations.7 The Swedish occupational exposure limit (OEL) for NO2 for an 8 h workshift is 4 mg m−3 and 2 mg m−3 if the source is motor exhaust. The ceiling value is 10 mg m−3 for 15 min exposure.
There are several sensitive methods for measuring nitrogen dioxide, including the chemiluminescence technique in which emission from excited NO2* is detected photoelectrically. The chemiluminescence analyzer has the advantage of offering time-weighted averages of the NO2 concentration. However the analyzers are heavy and expensive, need electricity, calibration and specialist maintenance, and are therefore not suitable for assessing personal exposure.
To enable self-assessment of worker exposure in the occupational environment, it is important to have cheap, lightweight, easy-to-use devices that cause minimal inconvenience to the wearer. Diffusive (passive) samplers, which are based on molecular diffusion of the gas to a collector medium, fufill these requirements, and are therefore ideal for the purpose of monitoring personal exposure. Diffusive samplers, however, are more or less dependent on temperature, sampler geometry and wind speed, which may lead to higher variations in results compared to active sampling methods. It is therefore important to determine the effective sampling rate of the actual sampler.8 Badge-type samplers (short samplers with large cross-sectional area) are more sensitive to air velocities than tube samplers. At low wind speed, badge samplers have a lower sampling rate.8 Hofschreuder et al.9 made efforts to reduce the impact of wind velocities on the Willems badge, and stated that with proper sampler design and optimum choice of draught shield the influence of wind speed can be reduced to less than 10%.
We have previously validated a diffusive sampler for NO2, the Willems badge, for ambient air measurements.10,12 Our conclusion was that the sampler is suitable for measuring background levels of NO2 in ambient air. The concentration of nitrogen dioxide in occupational environments may, however, be considerably higher than outdoor levels, and it is therefore important to validate the sampler under these conditions. This paper describes the laboratory and field validation of the Willems badge for personal measurements of NO2 in working environments. Our aim was to determine the sampling rate of the sampler in laboratory studies at occupational environment concentrations and to investigate the effects of relative humidity, sampling time and concentration of nitrogen dioxide on sampling rate. Another objective was to test the sampler for personal measurements in working environment conditions in field tests.
Gair et al.11 made some recommendations for the optimized use of NO2 diffusion tube samplers, one of which was the use of ion chromatography analysis in order to reduce the detection limit. In the present study the analysis of nitrite based on a modified colorimetric method, performed by FIA (flow injection analysis), was compared to ion chromatography analysis.
Experimental
Diffusive sampler
The Willems badge diffusive sampler (Fig. 1) consists of a cylinder of polystyrene. A Whatman GF-A glass fibre filter placed at the bottom of the cylinder serves as the absorption medium. A Teflon filter (Schleicher & Schuell TE 38, 5μm) on a distance ring of polystyrene (6 mm) serves as a draught shield. A polystyrene ring of 3 mm keeps the Teflon filter in place, and the badge is closed after exposure by means of a polyethylene cap. The absorption filter is impregnated with a solution of triethanolamine–acetone as a collector reagent for NO2. The diffusion length in the badge is 6 mm. After a sampling period, the absorption filter is removed from the badge, extracted and analysed for nitrite.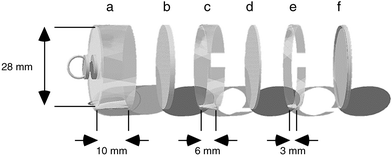 | ||
| Fig. 1 Expanded view of the Willems badge: a, sampler base of polystyrene; b, absorption filter; c, spacer ring; d, Teflon filter; e, fixation ring; f, cap of polyethylene. | ||
Analysis
The extraction step was the same for both methods of analysis. After sampling, the filter was transferred to a vessel containing 5 ml of 0.005 M NaOH (Eka Nobel, Göteborg, Sweden), shaken for 30 min and centrifuged at 4000 rpm for 10 min.Laboratory validation
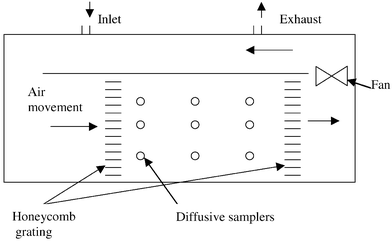 | ||
| Fig. 2 Exposure chamber. | ||
In both studies, measurements of NO2 were performed at the center of the exposure box chamber with a chemiluminescence instrument (ECO PHYSICS CLD 700 AL med, Dürnten, Switzerland) as a reference method. The analyser was calibrated daily with a certified gas of NO in nitrogen (AGA).
To examine the shelf life (stability before exposure) two sets of samplers were kept in room temperature for two weeks before they were exposed. These were compared with sets of freshly prepared samplers.
Comparison of two analytical methods
The two techniques for analysis of nitrite were compared by exposing 6 samplers at a time in the exposure box at four different nitrogen dioxide concentrations (0.088, 0.33, 2.0 and 10 ppm). Nine other samples were exposed in different office environments. Each sample was extracted in 6 ml of 5 mM NaOH. Half of the extract was analysed by the spectrophotometric method, and the other half by ion chromatography.Field validation
Static and personal sampling was performed in an environmental exposure chamber where subjects were exposed to diesel exhaust. The chamber (2.5 × 2.5 × 2.4 m) is depicted schematically in Fig. 3. The walls consist of varnished steel panel with a glass window, and the floor is made of smooth galvanized steel panel. Diesel exhaust from an idling Volvo diesel engine (Volvo-BM TD45; Volvo, Gothenburg, Sweden; 4.5 L, 4 cylinders, 1991, 680 rpm) was pumped to a gasblender and diluted with fresh, warmed, filtered outdoor air regulated by a flow meter, before entering the chamber. The flow of diesel exhaust was controlled by regulating the back pressure in the exhaust pipe. By regulating the rotation speed of the fan motor the flow of fresh air was kept between 5 and 100 m3 h−1. The diesel exhaust to the exposure chamber was standardized to give a concentration of particulate matter of 100 μg m−3 and 300 μg m−3 respectively, corresponding to steady state NO2 concentrations of about 0.5 and 1.3 ppm. Waste air from the chamber was drawn through a tube in the ceiling. Three studies of 32 simultaneous measurements with diffusive samplers and the chemiluminescence instrument were performed on 25 persons at two different NO2 concentrations. The samplers were attached to the clothes close to the breathing zone (one on each shoulder), and the measuring time was 15, 120 and 160 min, respectively. For the 120 and 160 min samples, the chemiluminescence concentrations were recorded on a datalogger (AAC-2, Intab interface teknik AB, Sweden).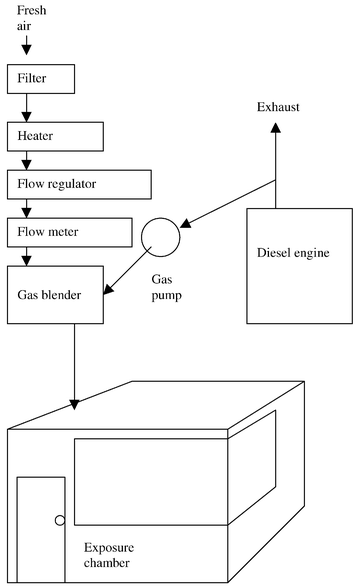 | ||
| Fig. 3 Schematic of the exposure chamber along with diesel exhaust generation system. | ||
For static sampling six diffusive samplers were mounted closely together. Two sets of 2.5 h measurements at a concentration of about 2.5 mg m−3 were carried out, with the on-line chemiluminescence instrument as a reference method.
For the statistics the Student’s t-test was used. Differences with a p-value <0.05 were considered significant.
Results and discussion
Laboratory validation
| Sampling time/min | Relative humidity (%) | Mean reference concentration/mg m−3 | RSD(%) | Sampling rate/ml min−1 |
|---|---|---|---|---|
| 16 | 80 | 2.2 | 9 | 50 |
| 15 | 20 | 2.2 | 8 | 48 |
| 485 | 20 | 0.2 | 4 | 47 |
| 15 | 20 | 17.7 | 8 | 43 |
| 468 | 80 | 0.2 | 9 | 55 |
| 15 | 80 | 17.8 | 7 | 46 |
| 479 | 20 | 3.6 | 9 | 40 |
| 475 | 80 | 3.7 | 9 | 42 |
| Mean | 46 | |||
| RSD(%) | 12 | |||
| n | 48 |
| Variable | Parameter estimate | Standard error | |
|---|---|---|---|
| Sampling rate | 45.8 | 1.7 | |
| Time | −2.3 | 1.9 | NS |
| Concentration | −3.6 | 2.4 | NS |
| RH | 1.9 | 1.5 | NS |
| Face velocity/m s−1 | Orientation | Sampling rate/ml min−1 | RSD(%) |
|---|---|---|---|
| 0.1 | Parallel | 35.5 | 11 |
| 0.3 | Parallel | 44.6 | 11 |
| 0.5 | Parallel | 51.5 | 12 |
| 0.7 | Parallel | 54.2 | 7 |
| 1.0 | Parallel | 45.7 | 16 |
| 2.0 | Parallel | 51.7 | 5 |
| 0.1 | Perpendicular | 54.3 | 10 |
| 0.3 | Perpendicular | 56.4 | 9 |
| 0.5 | Perpendicular | 51.7 | 10 |
| 0.7 | Perpendicular | 57.9 | 9 |
| 1.0 | Perpendicular | 58.4 | 11 |
| 2.0 | Perpendicular | 67.2 | 4 |
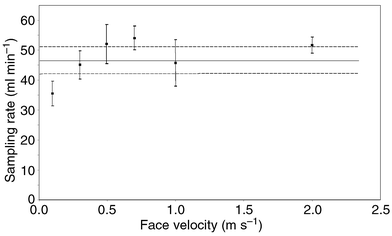 | ||
| Fig. 4 Effects of face velocity on sampling rate (parallel orientation) of the diffusive sampler (n = 6). The concentration of nitrogen dioxide was 1 ppm, temperature 20 °C, relative humidity 20%, and sampling time 1 h Mean sampling rate ± confidence interval for the mean at different wind velocities. ——— Mean sampling rate determined in the factorial study and - - - - - - ± s (=4.66) for the sampling rate means (n = 8). | ||
| Storage | Time/min | Relative humidity(%) | Mean reference concentration/mg m−3 | RSD(%) | Sampling rate/ml min−1 | |
|---|---|---|---|---|---|---|
| a Calculated sampling rate with Willems badge analysed directly after exposure or after storage (14 days) in refrigerator or room temperature. b Calculated sampling rate with freshly prepared diffusive samplers or samplers stored 14 days at room temperature before exposure. | ||||||
| Storage stability tests | No | 485 | 20 | 0.2 | 4 | 46.5 |
| Refrigerator | 485 | 20 | 0.2 | 13 | 46.7 | |
| Room temp | 485 | 20 | 0.2 | 8 | 46.4 | |
| No | 15 | 20 | 17.7 | 8 | 43.0 | |
| Room temp | 15 | 20 | 17.7 | 11 | 42.6 | |
| Shelf life tests | No | 468 | 80 | 0.23 | 8 | 54.5 |
| Room temp | 468 | 80 | 0.23 | 9 | 54.3 | |
| No | 15 | 20 | 18.4 | 8 | 36.8 | |
| Room temp | 15 | 20 | 18.4 | 6 | 37.8 | |
Comparison of two analytical methods
The detection limit for the spectrophotometric method was previously determined to be 11 μg m−3 for 8 h and 4 μg m−3 for 24 h.12 For the ion chromatography analysis the detection limit (defined as three times the mean standard deviation for the mass on filters of eight samples of low concentration (0.01mg l−1) ) was 2.3 μg m−3 for 8 h and 0.75 μg m−3 for 24 h. The day-to-day reproducibility of the method expressed as the relative standard deviation of the lowest control sample was 1.6% (n = 8). The blank signal in each run was subtracted from the samples. The repeatability of the method was determined as the mean relative standard deviation of a control sample run in 6 replicates at two different occasions and was found to be 1.5%.The correlation between the two analytical methods is illustrated in Fig. 5. The equation for the line is IC = −0.0132 + (0.9172 × FIA), where IC is the result obtained with ion chromatography and FIA is the result obtained with the spectrophotometric method. The correlation between FIA and IC is good, with a correlation coefficient (r) of 0.998 for the 33 exposures.
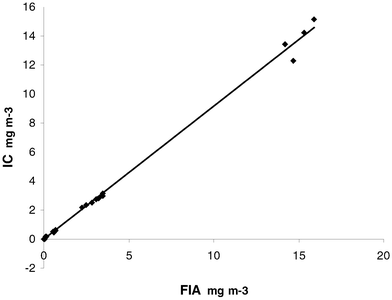 | ||
| Fig. 5 Correlation between the nitrite concentration analysed by FIA (flow injection analysis) and the concentration analysed by IC (ion chromatography). y = 0.9172x − 0.0132. | ||
Field validation
| Sampling time/min | n | Chemiluminescence | Willems badge | Ratio between Willems badge and reference method | |||
|---|---|---|---|---|---|---|---|
| Mean reference concentration/mg m−3 | Mean concentration/mg m−3 | Sampling rate/ml min−1 | RSD(%) | ||||
| 120 | 22 | 0.87 | 0.92 | 49 | 11 | 1.06 | |
| 60 | 28 | 2.44 | 2.84 | 55 | 13 | 1.16 | |
| 15 | 27 | 2.38 | 2.84 | 57 | 15 | 1.19 | |
Conclusions
The Willems Badge diffusive sampler was validated for nitrogen dioxide measurements in laboratory studies as well as in field experiments.The experimental sampling rate was determined to be 46 ml min−1 with an RSD of 12%. There was no influence on sampling rate of sampling time, concentration of NO2 or relative humidity. The ion chromatography analysis lowers the sensitivity by a factor of about 5. The sampler was found to perform well at wind velocities down to 0.3 m s−1 which makes it suitable for personal measurements. The sensitivity allows it to be used with a sampling time of 1 h for NO2 concentrations down to 0.018 mg m−3. In an 8 h sample the detection limit is 0.002 mg m−3. However at stationary sampling indoors where the wind velocity is less than 0.3 m s−1 the sampler has a lower sampling rate which makes it less suitable for these measurements.
References
- T. Sandström, Eur. Respir. J., 1995, 8, 976 CAS.
- G. Ainslie, Respir. Med., 1993, 87, 169 CrossRef CAS.
- T. Sandström, PhD Thesis, Umeå University, 1989, ISBN 91-7045-036-6.
- R. Helleday, PhD Thesis, Umeå University, 1995, ISBN 91-7191-017-4.
- W. M. Alberts, J. Allergy Clin. Immunol., 1994, 94, 289 CrossRef CAS.
- O. Raaschou-Nielsen, M. L. Nielsen and J. Gehl, Arch. Environ. Health, 1995, 50, 207 Search PubMed.
- N. M. Elsayed, Toxicology, 1994, 89, 161 CrossRef CAS.
- R. H. Brown, J. Environ. Monit., 2000, 2, 1 RSC.
- P. Hofschreuder, W. van der Meulen, P. Heeres and S. Slanina, J. Environ. Monit., 1999, 1, 143 RSC.
- A. Hagenbjörk-Gustafsson, B. Forsberg, G. Hestvik, D. Karlsson, S. Wahlberg and T. Sandström, Analyst, 1996, 121, 1261 RSC.
- A. J. Gair and S. A. Penkett, Atmos. Environ., 1995, 29, 2529 CrossRef CAS.
- A. Hagenbjörk-Gustafsson, R. Lindahl, J.-O. Levin and D. Karlsson, J. Environ. Monit., 1999, 1, 349 RSC.
- R. Lindahl, PhD Thesis, Umeå University, 1997, ISBN 91-7191-355-6.
- CEN, European Committee for Standardization, Workplace atmospheres—Diffusive samplers for the determination of gases and vapours—Requirements and test methods. EN 838, Brussels, 1995 Search PubMed.
- R. Carlson, Design and Optimization in Organic Synthesis (Data Handling in Science and Technology), Elsevier, Amsterdam, vol. 8, 1992 Search PubMed.
| This journal is © The Royal Society of Chemistry 2002 |