Evaluation and application of bismuth as an internal standard for the determination of lead in wines by simultaneous electrothermal atomic absorption spectrometry
Kelly G.
Fernandes
a,
Mercedes de
Moraes
a,
José A. Gomes
Neto
*a,
Joaquim A.
Nóbrega
b and
Pedro V.
Oliveira
c
aDepartamento de Química Analítica, Universidade Estadual Paulista, P.O. Box 355, 14801-970 Araraquara, SP, Brazil. E-mail: anchieta@iq.unesp.br; Fax: +55 16 222 7932
bDepartamento de Química, Universidade Federal de São Carlos, P.O. Box 676, 13560-970 São Carlos, SP, Brazil
cInstituto de Química, Universidade de São Paulo, P.O. Box 26077, 05513-970 São Paulo, SP, Brazil
First published on 29th November 2001
Abstract
A method for the direct determination of Pb in wines by simultaneous multi-element atomic absorption spectrometry (SIMAAS) using a transversely heated graphite atomizer, Zeeman-effect background corrector and internal standardization is proposed. Bismuth was used as an internal standard and Pd(NO3)2 plus Mg(NO3)2 as chemical modifier to stabilize both the analyte and the internal standard. The implementation of two pyrolysis steps avoided any build-up of carbonaceous residues on the graphite platform. All diluted samples (1 + 1 v/v) in 0.2% v/v HNO3 and reference solutions (5.0–50 μg l−1 Pb in 0.2% v/v HNO3) were spiked with 25 μg l−1 Bi. For a 20 μl aliquot dispensed into the graphite tube, a good correlation (r = 0.9997) was obtained between the ratio of the analyte signal to the internal standard signal and the analyte concentration of the reference solutions. The electrothermal behaviour of Pb and Bi in red, white and rosé wines were compared. In addition, absorbance variations due to changes in experimental conditions, such as atomizer temperature, integration time, injected sample volume, radiation beam intensity, graphite tube surface, dilution and sample composition, were minimized by using Bi as internal standard. Relative standard deviations of measurements based on integrated absorbance varied from 0.1 to 3.4% and from 0.5 to 7.3% (n = 12) with and without internal standard correction, respectively. Good recoveries (91–104%) for Pb spikes were obtained. The characteristic mass was 45 pg Pb and the limit of detection based on integrated absorbance was 0.9 μg l−1 Pb. Internal standardization increased the lifetime of the tube by 25%. Direct determinations of Pb in wines with and without internal standardization approaches were in agreement at the 95% confidence level. The repeatability and the tube lifetime were improved when using Bi as internal standard. The improvement in accuracy using an internal standard was only observed when the analytical results were affected by errors.
Introduction
Internal standardization (IS) is an attractive, simple and efficient method to compensate for random and systematic errors in atomic emission or absorption spectrometric analysis.1,2 The principle is the addition of a constant amount of an element to all blanks, analytical solutions and samples in an analysis or, if present in the samples, added to all blanks and analytical solutions only. When analyte and internal standard are similarly affected by changes in experimental conditions, the ratio of the analyte signal to the internal standard signal is then independent of the perturbation source.3Since the first introduction of internal standardization in atomic emission spectrometry in 1929 by Gerlach and Schweitzer,4 several studies have been published on the application of IS to increase the precision of emission spectroscopic methods.5–10 The precision of a measurement in flame atomic absorption spectrometry (FAAS) can also be improved by using IS11–18 to compensate for changes in instrumental conditions such as flame temperature, flame composition, sample composition, aspiration rate of the sample solution and nebulization. According to Radziuk et al.,19 internal standardization in atomic absorption spectrometry was introduced in 1965 by Massmann,20 to reduce the variability of sample introduction. In the same year, Butler and Strasheim11 developed instrumentation for simultaneous atomic absorption measurements and used Au as an internal standard for Cu determination in copper-based alloys by FAAS. In 1968, Smith et al.12 used Zn or Cr as internal standard for the determination by FAAS of Mg, Fe and Pb or Al, Cd and Cu, respectively, in zinc die cast. The concept of IS was also used in the work of Feldman et al. in 1969.13 They compared direct determination and IS (Cd, Mn, Cr or Zn) with respect to the precision and accuracy of the determination of Al, Ca, Cr, Cu, Fe, Mg, Mn, Ni, Si and Zn in cement, steel alloys and animal feeds by FAAS. Feldman14,15 also studied the main factors that affect the analytical signal in FAAS and atomic emission spectrometry such as gas flow rate, matrix composition, temperature and aspiration flow rate, and further demonstrated the advantage of IS for several different determinations and listed 23 useful elements as internal standards for 18 metals.
Prior to the 1980s, the main difficulty in applying IS to AAS was the unavailability of multi-channel instruments and scarce knowledge on how to select internal standards properly.
In 1979, Takada and Nakano21 developed a dual-channel spectrometer and applied IS in AAS with electrothermal atomization to determine iron using cobalt as a suitable internal standard. In 1981 they studied some selection criteria and experimental considerations for choosing an internal standard in FAAS.16 One critical parameter to choose an internal standard properly is the atomization efficiency.
The availability of commercial simultaneous multi-element electrothermal spectrometers in the 1990s allowed the investigation of the use of IS in electrothermal atomic absorption spectrometry (ETAAS).22–24
The use of IS in ETAAS is relatively recent, so the criteria for selecting an IS have not yet been fully evaluated. Some physical and chemical parameters for elements and their oxides such as atomic number, molar mass, melting-point, boiling-point, heat of vaporization of oxides, activation energy for atomization and dissociation energy of MO and MCl, may be used as indicative criteria for further experimental evaluation. In this context, Radziuk et al.19 tested Tl and Bi as internal standards for the determination of Pb in blood, placenta and urine samples by using a simultaneous multi-element atomic absorption spectrometer equipped with a transversely heated graphite atomizer (THGA) and a longitudinal Zeeman-effect background correction system. Bismuth was used to compensate changes in Pb signals and improved analytical performance. Bismuth was selected as internal standard taking into account similar physico-chemical properties and electrothermal behaviour between Pb and Bi.
This paper reports on some factors that may affect the analytical signals in simultaneous multi-element atomic absorption spectrometry (SIMAAS) (atomization temperature, integration time, injected sample volume, light intensity, graphite tube surface, dilution and sample composition) and on the use of internal standardization to correct them. As an example, a straightforward method for the direct determination of trace levels of Pb in wine samples by using multi-element electrothermal atomic absorption spectrometry and Bi as internal standard was developed. The performance of the proposed method was checked after analyzing various red, white and rosé wines.
Experimental
Instrumentation
A Perkin-Elmer SIMAA-6000 simultaneous multi-element atomic absorption spectrometer equipped with a transversely heated graphite atomizer (THGA) (Perkin-Elmer, Part No. BO 504033) and an AS-72 autosampler were used. An electrodeless discharge lamp (EDL) and a hollow-cathode lamp (HCL) were used for Pb (283.3 nm) and Bi (223.1 nm), respectively, and were operated according to the conditions recommended by the manufacturer. Atomic signals were measured in peak area mode. It should be pointed out that the experiments were carried out using STPF conditions2 including Zeeman-effect background correction.Reagents, reference solutions and samples
High-purity de-ionized water (resistivity 18.2 MΩ cm) obtained using a Milli-Q system (Millipore) was used throughout. All solutions were prepared with Suprapur grade nitric acid (Merck). Argon (White Martins, Brazil) was of 99.999% purity.Reference solutions containing 5.0, 10, 20, 30, 40 and 50 μg l−1 Pb plus 25 μg l−1 Bi were daily prepared by dilution of 1000 mg l−1 Pb and Bi stock standard solutions (Normex, Carlo Erba) and acidified with nitric acid to 0.2% v/v. The autosampler washing solution was 0.1% v/v Triton X-100 in 0.2% v/v HNO3. Chemical modifier solutions of 0.1% m/v Pd and 0.1% m/v Mg(NO3)2 were applied, both prepared from 1% m/v stock standard solutions (Perkin-Elmer, Part No. BO 190635, Pd; Perkin-Elmer, Part No. BO 190634, Mg).
Wine samples (sweet and dry red wines; sweet and dry white wines; rosé wines) were purchased at the local market in Araraquara, São Paulo State, Brazil. For direct determination, all samples were diluted (1 + 1 v/v) with 0.4% v/v HNO3 directly in the autosampler cup and spiked manually with 25 μg l−1 Bi. All samples were manually homogenized immediately before sampling with the autosampler pipette.
Evaluation of internal standardization performance
As Pd–Mg is the modifier recommended for several analytes in different matrices,25 the electrothermal behaviour of Pb and Bi were investigated in 0.2% v/v HNO3 with or without 5 μg Pd plus 3 μg Mg. It should be pointed out that this modifier mixture has been used earlier by the authors for the simultaneous determination of Pb and Cd in wines.26 For each measurement, 20 μl of reference or sample solution, 5 μl of modifier Pd and 3 μl of modifier Mg were sequentially dispensed into the tube. Five replicate analyses of each reference solution and sample were carried out. The time–temperature programme used for simultaneous measurements is presented in Table 1. With this programme, the electrothermal behaviours of Pb and Bi were studied using pyrolysis and atomization curves without and with 5 μg Pd + 3 μg Mg(NO3)2. We employed the following solutions: 25 μg l−1 Pb plus 25 μg l−1 Bi in 0.2% v/v HNO3, and red and white wine diluted (1 + 1 v/v) with 0.4% v/v HNO3 and spiked with 25 μg l−1 Bi.| Stop | Temperature/°C | Time/s (ramp, hold) | Air flow rate/ml min−1 |
|---|---|---|---|
| 1 | 110 | 1, 20 | 250 |
| 2 | 150 | 5, 15 | 250 |
| 3 | 400 | 10, 20 | 250 |
| 4 | 1100 | 5, 10 | 250 |
| 5 | 2000 | 0, 4 | 0 (read) |
| 6 | 2450 | 1, 3 | 250 |
The effect of variation of the atomizer temperature on absorbance was evaluated employing pyrolysis and atomization curves, from which the ratio of Pb and Bi absorbances was plotted as a function of the pyrolysis or atomization temperature in the ranges 400–1600 °C and 1400–2400 °C, respectively.
The influence of variation of integration time on the atomic signals of Pb and Bi was investigated by varying the atomization time from 1 to 5 s. This study was carried out using two solutions: (a) 25 μg l−1 Pb and Bi in 0.2% v/v HNO3 and (b) diluted white wine spiked with 25 μg l−1 Bi.
The effect of injected sample volume on the repeatability of absorbance measurements of Pb and Bi with and without IS was investigated by dispensing 20, 40, 60 and 80 μl of sample and 8 μl of modifier into the atomizer.
The influence of variation of the lamp intensity on the absorbance signals of Pb and Bi with or without internal standard correction was investigated by selecting different lamp currents (EDL for Pb and HCL for Bi, respectively): 450 and 10 mA; 360 and 8 mA; 315 and 7 mA; and 270 and 6 mA.
Two reference solutions (20 and 40 μg l−1 Pb containing 25 μg l−1 Bi) were prepared using beakers to simulate experimental dilution errors. The final volumes were roughly adjusted.
The influence of variation of the graphite tube surface on the integrated absorbance of Pb and Bi with and without IS was studied by measuring signals of 25 μg l−1 Pb and Bi spiked in diluted wine in 5% v/v nitric acid until the rupture of the tube. It should be emphasized that this acid concentration was used to promote faster abrasion of the tube.
The influence of the sample composition on Pb and Bi absorbances was investigated by studies of accuracy and precision, which were evaluated from spike recovery tests and analysis of wine samples with or without IS. Ten wine samples were spiked with both Pb and Bi: 500 μl of 0.4% v/v HNO3 solution containing 50 μg l−1 Pb and Bi plus 500 μl of wine sample were added to the autosampler cup. Additionally, the behaviours of the analyte (Pb) and internal standard (Bi) were studied in different diluted wine samples (red, white and rosé) which were spiked with 25 μg l−1 Bi and Pb. Five replicates were performed for each sample. The absorbance signal for each diluted sample was adopted as the blank signal.
Results and Discussion
Electrothermal behaviour of lead and bismuth
As the carbonaceous residue generated during the ashing step can be avoided using a first pyrolysis step at 400 °C,26 this step was used throughout this work. The influence of chemical modifier on the stabilization of lead in wine samples had already been studied in this previous work. Although a mixture of NH4H2PO4 + Mg(NO3)2 is the usual and suggested modifier for Pb, a mixture of Pd + Mg(NO3)2 was selected here because it is considered a fairly universally applicable modifier in ETAAS.25 Additionally, in simultaneous determinations, the operational parameters cannot always be the optimum for all selected analytes. Using the heating programme of the atomizer shown in Table 1, the behaviour of Pb and Bi in diluted nitric acid and red and white wines were studied in presence of Pd(NO3)2 + Mg(NO3)2 as chemical modifier. The added modifier masses for 20 μl of sample were 5 μg of Pd + 3 μg of Mg(NO3)2. Pyrolysis curves for Pb and Bi are presented in Fig. 1. The maximum pyrolysis temperature that could be used for Pb and Bi was 1200 °C in the three media studied and this value was kept constant in subsequent experiments. For white wine, the absorbances of Pb and Bi decreased by ca. 75% when the pyrolysis temperature was varied from 1200 to 1400 °C. For routine analysis, white and red wine samples were randomly introduced.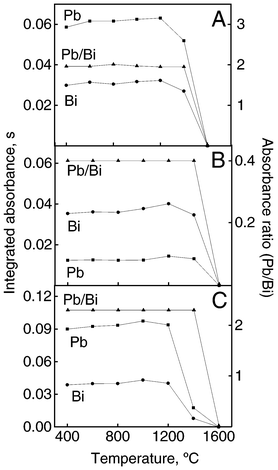 | ||
| Fig. 1 Pyrolysis temperature curves for Pb and Bi and corrected curve obtained by IS (Pb/Bi). Modifier: 5 μg of Pd + 3 μg of Mg. Integrated absorbance refers to 25 μg l−1 Pb and Bi in 0.2% v/v HNO3(A), red wine (B) and white wine (C). | ||
Effect of variation of atomization temperature
Sometimes small variations of the pyrolysis or atomization temperatures may affect the analytical absorbance, mainly in situations in which the pyrolysis or atomization curves fall abruptly around the optimum pyrolysis/atomization temperatures. To illustrate the compensation for absorbance variations caused by temperature fluctuations in different media, the pyrolysis temperature was varied in the range 400–1600 °C (Fig. 1). When the Pb/Bi signal ratio was plotted as a function of temperature, it was observed that variations of 100 °C in the pyrolysis temperature (1200 °C), which is compatible with variations observed in the programmed atomizer temperature of around 10%, was tolerated without absorbance variations. The IS method can also be used for compensating for errors caused by fluctuations in atomization temperature. When the atomization temperature was increased from 1400 to 2400 °C (Fig. 2), both the analyte and internal standard absorbance signals varied significantly. On the other hand, the Pb/Bi signal ratio was unaffected by temperature variations in the 1600–2400 °C range.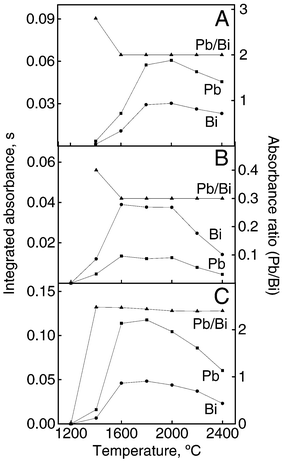 | ||
| Fig. 2 Atomization temperature curves for Pb and Bi and corrected curve obtained by IS (Pb/Bi). Modifier: 5 μg of Pd + 3 μg of Mg. Integrated absorbance refers to 25 μg l−1 Pb and Bi in 0.2% v/v HNO3 (A), red wine (B) and white wine (C). | ||
Effect of variation of atomization time
The effect of atomization time on the integrated absorbances of Pb and Bi was studied from 1 to 5 s and it was observed that the absorbance varied almost linearly. Hence variations around 1 s may affect significantly the analyte absorbance. On the other hand, the Pb/Bi absorbance ratios were nearly independent of atomization time from 3 to 5 s (Fig. 3).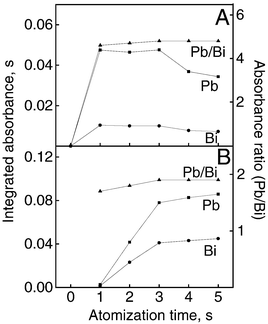 | ||
| Fig. 3 Effect of atomization time on absorbance. Integrated absorbance refers to 25 μg l−1 Pb and Bi in 0.2% v/v HNO3 (A) and white wine (B). The curve labelled Pb/Bi refers to the corrected absorbance obtained by IS. | ||
Effect of variation of injected sample volume
The integrated absorbance of Pb and Bi increased proportionally with injected sample volume (5–20 μl) of a reference solution containing 25 μg l−1 Pb and Bi. When IS was applied, the corrected signal was independent of the injected volume. The repeatability of measurements may be influenced by the injected volume: when 20, 40 and 60 μl of sample plus 8 μl of modifier were dispensed into the atomizer, the relative standard deviations (RSDs) of the measurements varied from 0.3 to 0.5% and from 1.3 to 3.0% with and without IS, respectively (n = 5). It can be concluded that the poor performance of the autosampler can be corrected using IS and the repeatability is better when using IS.Effect of variation of radiation beam intensity
Previous measurements indicated that the integrated absorbances of Pb and Bi decreased by 7% when the lamp currents were decreased by 40%. Despite of this effect, it was observed experimentally that when using the Pb/Bi ratio, no variation of absorbance occurred. It should be pointed out that this could improve the performance of single-beam spectrometers even when using radiation lamps at the end of their lifetime or when power source fluctuations are randomly occurring.Effect of dilution errors
Even when using direct methods, samples are frequently diluted prior to measurements and this step can be affected by systematic and random errors. As can be seen in Fig. 4(A) and (B), even gross dilution errors caused by the preparation of solutions in beakers are completely corrected when the Pb/Bi ratios were employed instead of integrated absorbances for Pb.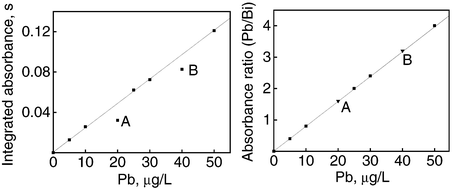 | ||
| Fig. 4 Effect of IS method on compensation by dilution errors. The curve corresponds to reference solutions (5.0–50 μg l−1) prepared in 0.2% v/v HNO3. Points A and B refer to reference solutions prepared in beakers without correction (left) and after correction by IS (right). | ||
Effect of variation of graphite tube surface
The graphite tube ages after being subjected to several heating cycles. As a consequence, the analytical peak may change in shape, prejudicing the sensitivity, accuracy and precision. It is recommended that the tube should be replaced when either the integrated absorbance value falls ca. 20% below the original value or the RSD is >10%. Provided that the tube does not break, it is possible to use the tube beyond its usual lifetime even under “unfavorable conditions” if the degradation of the surface affects the signals of Pb and Bi similarly. The integrated absorbance ratio (APb/ABi) as a function of successive measurements generated a constant value during up to 400 firings without correction or 450 firings with IS [Fig. 5(A)]. This experiment was carried out in diluted wine (1 + 1 v/v) in 5% v/v HNO3 and using a heating programme without a clean-out step in order to accelerate the degradation of the tube surface. The steps observed in the Pb/Bi ratios in Fig. 5(A) are related to three successive days of measurements. When adopting the heating programme developed and used throughout this work for Pb determination (Table 1), the lifetime of the tube was 600 and 750 firings without and with IS, respectively [Fig. 5(B)]. This demonstrated that the useful lifetime of graphite tube can be extended by up to 25% using IS.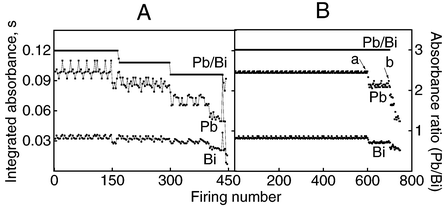 | ||
| Fig. 5 Effect of variation of graphite surface on absorbance. Integrated absorbance refers to a reference solution of 25 μg l−1 Pb and Bi in diluted wine (1 + 1 v/v) in 5% v/v HNO3 without a clean-out step (A) and 0.2% v/v HNO3 with a clean-out step (B); a and b indicate maximum heating cycles of the graphite tube without and with IS, respectively. | ||
Effect of sample matrix on absorbance of Pb and Bi
The correlation between Pb and Bi signals in different wine samples is shown in Fig. 6, which illustrates the variation of the signals for Pb and Bi spikes (25 μg l−1 Bi and Pb) in 17 red, white and rosé wine samples during simultaneous measurements of both elements. It can be seen that the absorbance signals varied for different samples despite the addition of the same amount of Pb and Bi to all of them. Any signal caused by the original concentrations of Pb and Bi in wine samples was considered as a blank and thus the signals presented are net integrated absorbance correlated only with the spiked Pb and Bi. All fluctuations observed are related to matrix effects on electrothermal atomization of Pb and Bi which show that the direct determination of Pb in wines by ETAAS is not as simple as it seems. The similar variations observed for Pb and Bi in each sample indicate that Bi is a suitable internal standard for Pb not only for urine, blood and placenta samples as demonstrated by Radziuk et al.,19 but also for wines.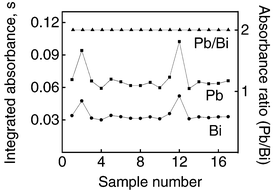 | ||
| Fig. 6 Effect of sample matrix on absorbance for Pb and Bi and corrected curve obtained by IS (Pb/Bi). Spike signals in wine samples refer to 25 μg l−1 Bi and Pb. | ||
Figures of merit
The matrix effects were evaluated by comparing the slopes between curves built up from aqueous reference solutions and matrix-matched solutions. As the errors associated with absorbance measurements using calibration with aqueous reference solutions were <6%, reference solutions in the 5.0–50 μg l−1 Pb range were used for calibration and good linear correlation coefficients (r = 0.9997) were usually attained. Accuracy and precision studies were carried out using addition–recovery tests for 10 wine samples with and without IS. The results obtained by both methods are given in Table 2. Applying a paired t-test, it was observed that all results are in agreement at the 95% confidence level. However, it can be mentioned that all RSD values were lower and all recoveries were closer to 100% when an IS method was employed. It is interesting that the RSDs were 0.1–3.4% and 0.5–7.3% with and without IS, respectively (n = 12, wine solutions spiked with 25 μg l−1 Pb). Characteristic masses obtained from calibration with Pb in aqueous reference solutions or Pb spiked in white and red wines were close to 45 pg and the limit of detection was 0.9 μg l−1. The Pb contents in all samples were determined using the IS method and all results were in agreement at the 95% confidence level with those obtained using a wet ash digestion procedure based on nitric acid and vanadium(V) oxide as catalyst.26 All samples showed Pb concentrations <50 μg l−1, which is lower than the maximum established by Brazilian food regulations (500 μg l−1, Health Department, Decree 55871)Conclusions
Single-element ETAAS methods are attractive for trace analysis owing to their high sensitivity and low detection limits. However, the heating programme of the atomizer can be a limiting factor regarding analytical throughput. Using SIMAAS, more elements can be determined per run. The use of the IS method improves the analytical figures of merit and it is easily implemented using multi-element equipment. The IS method is not limited to the selected analyte, internal standard or sample employed in this work,but the choice of an internal standard is critical and relies on the similar thermochemical behaviour of both the analyte and the element selected as an internal standard.Acknowledgements
The authors thank the Fundação de Amparo à Pesquisa do Estado de São Paulo for financially supporting this work and the Conselho Nacional de Desenvolvimento Científico e Tecnológico for fellowships to K.G.F., J.A.G.N., P.V.O. and J.A.N.References
- D. J. Butcher and J. Sneddon, A Practical Guide to Graphite Furnace Atomic Absorption Spectrometry,Wiley, New York, 1998. Search PubMed.
- B. Welz and M. Sperling, Atomic Absorption Spectrometry,VCH, Weinheim, 1999. Search PubMed.
- D. A. Skoog, F. James and T. A. Nieman, Principles of Instrumental Analysis,Saunders College, New York, 1998. Search PubMed.
- W. Gerlach and E. Schweitzer, Foundations and Methods of Chemical Analysis by Emission Spectrometry,Adam Hilger, London, 1929. Search PubMed.
- J. N. Walsh, Chem. Geol., 1992, 95, 113 CrossRef CAS.
- S. R. Goode, Abstr. Pap. Am. Chem. Soc., Part 1, 1996, 212, 122 Search PubMed.
- V. Kanicky and J. M. Mermet, Appl. Spectrosc., 1997, 51, 332 Search PubMed.
- X. Romero, E. Poussel and J. M. Mermet, Spectrochim. Acta, Part B, 1997, 52, 487 CrossRef.
- J. M. Mermet and J. C. Ivaldi, J. Anal. At. Spectrom., 1993, 8, 795 RSC.
- D. H. Sun, J. K. Waters and T. P. Mawhinney, J. Anal. At. Spectrom., 1997, 12, 675 RSC.
- L. R. P. Butler and A. Strasheim, Spectrochim. Acta, Part B, 1965, 21, 1207 CrossRef CAS.
- S. B. Smith, J. A. Blasi and F. J. Feldman, Anal. Chem., 1968, 40, 1525 CrossRef CAS.
- F. J. Feldman, J. A. Blasi and S. B. Smith, Anal. Chem., 1969, 41, 1095 CrossRef CAS.
- F. J. Feldman, Anal. Chem., 1970, 42, 719 CrossRef CAS.
- F. J. Feldman, Metall. Ital., 1972, 8, 369 Search PubMed.
- T. Takada and K. Nakano, Spectrochim. Acta, Part B, 1981, 36, 735 CrossRef.
- D. A. Katskov and B. V. L’vov, Zh. Prikl. Spektrosk., 1969, 10, 382 Search PubMed.
- B. V. L’vov, Atomic Absorption Spectrochemical Analysis,Adam Hilger, London, 1970. Search PubMed.
- B. Radziuk, N. P. Romanova and Y. Thomassen, Anal. Commun., 1999, 36, 13 RSC.
- H. Massmann, in Second International Symposium, Reinststoffe in Wissenschaft und Technik, ed. G. Ehrlich, Academie-Verlag, Berlin, 1966, pp. 297–308. Search PubMed.
- T. Takada and K. Nakano, Anal. Chim. Acta, 1979, 107, 129 CrossRef CAS.
- J. M. Harnly, T. C. O’Haver, B. Golden and W. R. Wolf, Anal. Chem., 1979, 51, 2007 CrossRef CAS.
- K. S. Farah and J. Sneddon, Appl. Spectrosc. Rev., 1995, 30, 351 Search PubMed.
- J. Sneddon, B. D. Farah and K. S. Farah, Microchem. J., 1993, 48, 318 CrossRef CAS.
- B. Welz, G. Schlemmer and J. R. Mudakavi, J. Anal. At. Spectrom., 1992, 7, 1257 RSC.
- G. P. G. Freschi, C. S. Dakusaku, M. Moraes, J. A. Nóbrega and J. A. G. Neto, Spectrochim. Acta, Part B, in the press. Search PubMed.
| This journal is © The Royal Society of Chemistry 2002 |
