Quality control of sampling: Proof of concept
Michael
Thompson
a,
Barry J.
Coles
b and
Joseph K.
Douglas
a
aSchool of Biological and Chemical Sciences, Birkbeck College (University of London), Gordon House, 29 Gordon Square, London, UK WC1H 0PP
bDepartment of Earth Science and Engineering, The Royal School of Mines, Imperial College of Science Technology and Medicine, London, UK SW7 2BP
First published on 13th December 2001
Abstract
Quality control in sampling has been demonstrated as practicable in sampling procedures that require the combination of sample increments to form a composite sample. The proposed method requires no sampling resources or use of time beyond those normally used. Increments are allocated at random into two half-sized composites, each of which is analysed separately. The absolute difference between the two results is plotted on a one-sided control chart, which is interpreted like a Shewhart chart. In commonly prevailing circumstances the analytical precision is negligible and the chart represents sampling precision alone.
In recent articles about the quality aspects of the sampling that precedes chemical analysis,1–3 it was conjectured that the routine quality control of sampling (QCSAM) could be undertaken in much the same way that internal quality control is applied to the analytical measurement process itself. However, no documented instances of the implementation of the idea were known. In this paper we demonstrate in practice a method for QCSAM that is simple to execute, and which adds little or nothing to the cost or effort of the established sampling procedure. The principle is familiar, but its application to physical sampling is apparently new. Methods for estimating the uncertainty of sampling in the geochemical sector are long established (although apparently not so in other sectors), but these are essentially short-term one-off exercises known as ‘orientation surveys’ for inter alia the initial validation of the sampling procedure.4,5 QCSAM as proposed here is a method for the ongoing assessment of routine sampling operations over long time periods.
The proposed method is applicable to sampling procedures that depend on the combination of a number of increments taken from the sample target material. The composite sample so formed is then further processed to produce the laboratory sample for analysis. In the proposed QCSAM method the standard procedure is modified: the increments, once taken, are apportioned at random to either of two separate composite samples or ‘splits’. Each of these splits is processed and analysed separately. The absolute difference between the two results depends on the combined sampling precision and analytical precision and can be plotted on a chart related to the familiar Shewhart chart. The procedure is shown schematically in Fig 1.
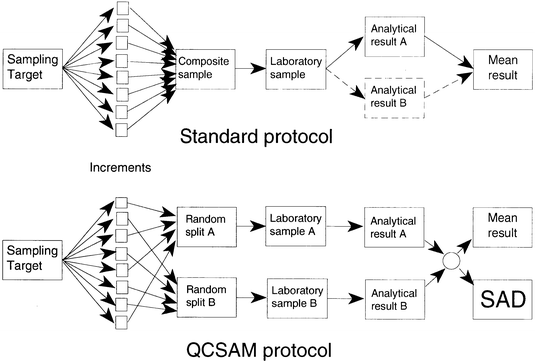 | ||
| Fig. 1 Schematic diagram showing a standard sampling/analytical protocol and the QCSAM protocol. | ||
Rationale
Suppose that a sampling variance σ2sam is obtained when the sampling is undertaken, as specified in the protocol of a standard method, by the collection of n increments that are aggregated to form the composite sample. The term σ2sam represents the variance of the true mean compositions of independent samples taken by a randomised version of the same procedure. We propose that for QCSAM purposes, instead of forming a single composite sample, we select the increments at random for aggregation into either of two composite samples (‘splits’), so that each composite comprises n/2 increments. The sampling variance based on a single split would then be 2σ2sam . If a split were analysed once by a procedure with analytical variance σ2an , the resulting measurement x would have a variance of| σ2x = 2σ2sam + σ2an |
σ2![[x with combining macron]](https://www.rsc.org/images/entities/i_char_0078_0304.gif) = σ2x /2 = σ2sam
+
σ2an /2, = σ2x /2 = σ2sam
+
σ2an /2, |
Considering now the difference d = xA
−
xB between the results xA, xB obtained by separately analysing two complementary splits, the variance of d is given by
| σ2d = 2σ2x = 2(2σ2sam + σ2an ). |
In theory such a chart would reflect the variation in sampling and analysis jointly. However, it is often more costly to reduce the sampling variance, which is therefore usually regarded by analysts as the limiting factor. Consequently, in most practical instances the sampling variance would be the dominant term, and in those instances, the QCSAM chart would provide a visual indication essentially of sampling variation alone: the analytical contribution would be negligible. For example, if (hypothetically) σan = 0, then σd = 2σsam. If σan = 0.5σsam then σd would be dilated beyond this hypothetical value by a factor of only 1.06. Even if σan = σsam, σd would only be increased by a factor of 1.22. (However, if σan > 2σsam, it would be futile to attempt to monitor σsam at all, so there is only a small window in the possible values of σan/σ sam where the analytical and sampling variation would be jointly represented on a QCSAM chart.)
Because the constitutions of the complementary splits in a pair are random, there is no difference in status between the measurements made on them. It is preferable, therefore, to construct a one-sided control chart for absolute differences |d| between the results of complementary splits (rather than a standard Shewhart chart for the signed differences d). On such a one-sided chart the bottom line would fall at zero, the warning limit at +2σd, and the action limit at +3σd, to provide probabilities corresponding with the two-tailed limits of a classical Shewhart chart.
(The last point above possibly needs some elaboration. Making the one-sided chart would be equivalent to folding a Shewhart chart (and therefore the normal distribution) along the mean line. Fig. 2(A) shows a normal distribution with the areas outside μ ± 2σd shaded: we expect about 5% of all observations d to fall in the shaded regions jointly and about 2.5% to fall above +2σd. When the distribution is folded along the zero line (Fig. 2B) the negative values of d are transformed into positive values and the frequency of observations falling in each region is doubled in the resulting half-normal distribution (Fig. 2C). As a result about 5% of the values of |d| fall above the +2σd bound, shown by the shaded area in Fig. 1C. Results fall above the +2σd bound in the one-sided chart with the same probability that they fall outside the ±2σd limits on the standard Shewhart chart. Corresponding comments would apply to the 3σd limits also. Note that the chart bounds are here defined in terms of σd, the standard deviation of the signed values d. This is the equivalent of using a one-sided range chart for two observations.6)
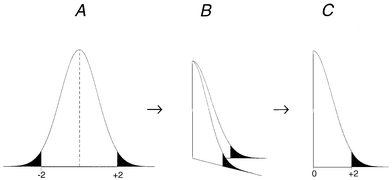 | ||
| Fig. 2 Folding the normal distribution for a one-sided QCSAM chart. | ||
The experimental points for plotting on the QCSAM chart would be the absolute differences |d| between the analytical results on complementary splits, a value that we call the split absolute difference or SAD. In the absence of an analytical problem (which should be controlled separately by existing methods) a point falling outside the action limit would indicate that either the sampling procedure had been executed ineptly (for example, with too few increments) or that the sampling target material was unusually heterogeneous. In either instance the discrepancy would demonstrate that the sample was suspect and possibly unfit for the purpose.
In common with all control charts, the control lines would have to be provisional and subject to review in the initial stages, because during that period the value of σd would be either unknown or poorly estimated. The setting-up strategy used in this study was the empirical method usually adopted in analytical science applications, namely, to use control limits based on an independent fitness-for-purpose criterion in the first instance (when there is no estimate of σd), and to replace them at specific stages with limits calculated from increasingly accurate estimates of σd based on the burgeoning experimental data. The value of σd can be estimated directly from the differences between the results from splits as stdev (d), the standard deviation of the differences d with due regard to the sign of the individual values. Alternatively, σd can be estimated from the SAD values |d| themselves, either as 1.2535 × mean(|d|) or as 1.6608 × stdev (|d|), although the value of the constants in these expressions depends on the assumption of the normal distribution. A robustified estimate (not so dependent on the normality assumption) could be obtained from the median SAD as 1.4826 × median(|d|). In any event, the estimation procedure would have to be protected in some way against undue influence from outlying results.
Experimental
Samples of soil were obtained from a number of public open spaces in North London by the collection of 16 increments from grassed areas at each site. Each sample was divided into two splits by allocating the increments at random into two sets of 8. The randomisation was effected each time by re-sorting a list [1, 1, 1, 1, 1, 1, 1, 1, 2, 2, 2, 2, 2, 2, 2, 2] into a new random order. The splits were dried at 70 °C, disaggregated, sieved through a 2 mm aperture metal-free mesh, and the undersized material was crushed to a fine powder in an agate mill to comprise the laboratory samples. Test portions of the splits were analysed in a dilute hydrochloric acid solution by simultaneous ICPAES after solubilisation with a mixture of nitric, perchloric and hydrofluoric acids.Results and discussion
Choice of test material for this study
Any heterogeneous material that is sampled by taking increments, or by a procedure such as coning and quartering, would be suitable in principle for this study. This would apply to either bulk or packaged materials. Soil was selected as the test material in this study because sampling could be undertaken quickly with negligible disturbance to the targets (sampling sites), and because they could be analysed inexpensively for a wide range of elements, each one of which provides a more-or-less independent subject for the study of sampling variance. From the 26 elements determined in this study there was a variety of combinations of major and trace concentration, analytical relative standard deviation, and sampling relative standard deviation. Any unsuspected problems with the proposed method would probably be exposed among such a wide range of possibilities. In the event no such problem was encountered, and a few typical examples are presented below.Suitability of the test materials for the study was established by a separate initial screening of the dataset for potential problems. The analytical data were examined by nested analysis of variance and visual inspection of a graphical representation of the data. There was no evidence of concentration-related heteroscedasticity in the sampling variance or analytical variance, because of the relatively short concentration ranges encountered.
Homoscedasticity
Homoscedasticity is a prerequisite for the unambiguous use of the simple control chart proposed here. In most analytical sectors this restriction will cause no problems in practice because the successively-sampled test materials will present only a narrow range of possible composition, for example, successive batches of wheat for protein, or of cement for alumina. Where the concentration of the analyte could vary over two or more orders of magnitude as, possibly, in the determination of aflatoxins in peanuts, a more elaborate QCSAM approach would be required. For example, we could envisage representing the sampling standard deviation as a function of concentration, so that σsam = f(c), and scaling the SAD values thereby to unit variance. The scaled SAD values |d|/f(c), where the concentration is estimated as c = (xA + xB)/2, could be plotted on a chart with unit-free control limits at 2 and 3.Some typical QCSAM control charts
In each of the following examples the analytical variation is negligible in comparison with the sampling variation. First we consider some control charts constructed with provisional bounds defined by an independent fitness-for-purpose criterion, namely, that the standard deviation of the sampling variation should be no greater than 5% of the concentration c of the analyte, that is,| σsam ≤ σffp = 0.05c. |
| σd = 2σsam ≤ 2σffp, |
If we calculate control limits in the normal way, that is so that the control limits simply describe the performance of the sampling/analytical system under statistical control, we have a situation exactly comparable with ordinary analytical internal quality control. Figs. 5 and 6 show values of SAD plotted on a chart provided with 2σd and 3σd limits where σd was estimated as the robust standard deviation6 of signed differences (d) available up to the sampling of Site 13. Of course, 13 is a small number of observation for the unqualified use of robust estimates and, indeed, for setting up a control chart,8 but the purpose here is merely to illustrate the feasibility of the overall procedure, not to provide a definitive example.
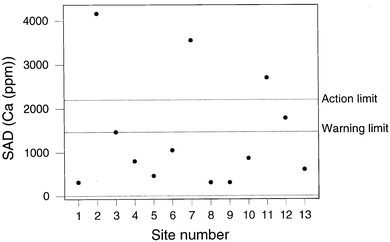 | ||
| Fig. 3 QCSAM chart for calcium, showing SAD values, with provisional control limits derived from a fitness-for-purpose criterion. | ||
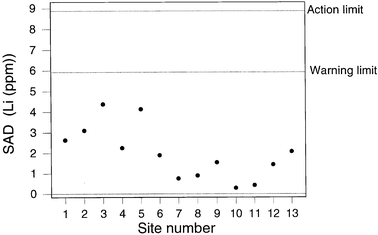 | ||
| Fig. 4 QCSAM chart for lithium, showing SAD values, with provisional control limits derived from a fitness-for-purpose criterion. | ||
Fig 5 shows the result for sodium, indicating a SAD value outside the action limit at Site 2. The sampling at Site 2 is found to be beyond the action limit for a total of four elements (Na, Sr, Ag, and P) and beyond the warning limit for three others (Ca, Ni, Cd). This is suggestive of a general problem with the sampling at site 2, presumably because the soil was unevenly contaminated and therefore unusually heterogeneous. Apart from the results from Site 2, there were only two unrelated instances of beyond-action-limit samplings. Fig. 6 shows a contrasting situation where the SAD values for lead show the sampling to be compliant throughout.
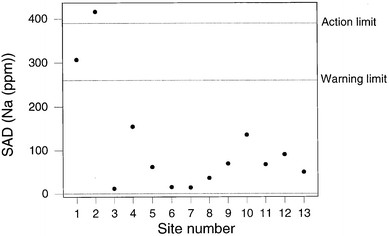 | ||
| Fig. 5 QCSAM chart for sodium, showing the SAD values, with control limits set at 2σd and 3σd, based on a robust estimate of σd. | ||
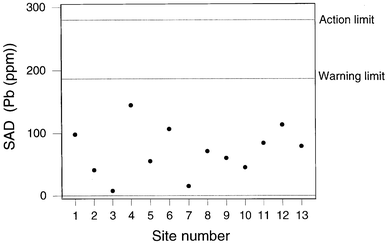 | ||
| Fig. 6 QCSAM chart for lead, showing the SAD values, with control limits set at 2σd and 3σd, based on a robust estimate of σd. | ||
Conclusions
Quality control of sampling (QCSAM) has been demonstrated to be feasible and to require no time or resources beyond those used for the normal sampling procedure that precedes analysis. That is an important feature of the proposed method, because many sampling procedures are (a) time consuming to a degree that would deter practitioners from duplicating the entire standard procedure or, (b) impossible to repeat. Two analyses are required for QCSAM, but duplicate analysis of a single sample is a common requirement in analytical protocols so, in such an instance, no extra analytical effort would be required either. The result to be reported is simply the mean of the two results from complementary splits. That result would have the same precision as would be obtained by executing the sampling protocol in the standard fashion with duplicate analysis.The QCSAM procedure as described is suitable for any sampling procedures depending on the combination of random sample increments to form a composite sample. However, it could readily be adapted to other types of sampling procedures, for instance, coning and quartering, so long as the splits were identified at the first stage of the procedure. The proposed control charts of the SAD result will in most instances represent the sampling precision unambiguously, because it is normal to find that the analytical precision is somewhat better than the sampling precision, and because heteroscedasticity will usually be negligible because of the short concentration range to be found in successive sampling targets.
QCSAM bears much the same relationship to uncertainty of sampling as does analytical internal quality control to analytical uncertainty. In both activities the respective uncertainties should be established when the procedures are validated. Thereafter, in successive runs of the operation, the statistical control is monitored by the ongoing quality control. However, the signed difference d has an expectation of zero under the assumption of statistical control, and is therefore invariant in respect of putative sampling biases. Analytical bias (at the laboratory and method levels) is an important contributor to analytical uncertainty. Whether sampling bias is an important aspect of sampling uncertainty, or even exists at all as a valid concept,9 is currently a moot point. It seems likely therefore that σ2sam , as estimated between sampling runs from QCSAM data, provides at least a reasonable representation of sampling uncertainty (certainly better than anything else available to date) and is suitable for combination with the overall analytical uncertainty to arrive at the uncertainty of the combined sampling/analytical procedure.
We have used the terms ‘compliant’ and ‘non-compliant’ to describe SAD values in this work because ‘in control’ and ‘out-of-control’ seem inappropriate in the context of sampling quality. As used in industrial production or analytical internal quality control, ‘out-of-control’ implies that the production method or analytical procedure is at fault. In QCSAM there is an alternative and perhaps more likely explanation to that of faulty procedure, namely that the sampling target is more heterogeneous than usual.
References
- M. Thompson and M. H. Ramsey, Analyst, 1995, 120, 261 RSC.
- M. Thompson, Accred. Qual. Assur., 1998, 3, 117 CrossRef CAS.
- M. Thompson, J. Environ. Monit., 1999, 1, 19N RSC.
- M. H. Ramsey, Appl. Geochem., 1993, 2, 149 CAS.
- Analytical Methods Committee, Analyst, 1989, 114, 1693 RSC.
- G. B. Wetherill, Sampling Inspection and Quality Control, Chapman and Hall, London, 2nd edn., 1977, p. 148 Search PubMed.
- R. G. Garrett, Sampling methodology, in Handbook of Exploration Geochemistry, ed. R. J. Howarth, , Elsevier, Amsterdam, 1983, vol. 2, pp. 82–110 Search PubMed.
- R. J. Howarth, Analyst, 1995, 120, 1851 RSC.
- P. M. Gy, Sampling of Heterogeneous and Dynamic Materials: Theories of Heterogeneity, Sampling and Homogenising, Elsevier, Amsterdam, 1992, p. 569ff Search PubMed.
| This journal is © The Royal Society of Chemistry 2002 |
