Synchrotron small angle X-ray scattering from organogels. Part 1. Changes in molecular assemblies of cholesterol gelators during gel–sol transition
Kazuo
Sakurai
*a,
Yoshiyuki
Ono
a,
Jong Hwa
Jung
a,
Shigeru
Okamoto
b,
Shinichi
Sakurai
c and
Seiji
Shinkai
a
aChemotransfiguration Project, Japan Science and Technology Corporation, Kurume Research Center Bldg., 2432 Aikawa, Kurume, Fukuoka, 839-0861, Japan. E-mail: k-sakurai@jst.ktarn.or.jp
bMaterial Science and Engineering, Nagoya Institute of Technology, Gokiso, Showa, Nagoya, 466-8555, Japan
cDepartment of Polymer Science and Engineering, Kyoto Institute of Technology, Matsugasaki, Kyoto, 606-8585, Japan
First published on 23rd November 2000
Abstract
We examined the synchrotron small angle X-ray scattering (SAXS) from three azobenzene-appended cholesterol organogels: an ionic gel, a nonionic gel and a mixture of them. The main purpose of the present study is to find a possible correlation between the gel stability and the aggregation structure using SAXS. A typical crystalline scattering is observed for the nonionic gel at room temperature. The ionic one gives scattering from an amorphous fiber that coexists with a small amount of crystals. On the other hand, the mixture of gels shows scattering from a completely amorphous fiber. These characteristic features from the fibril structures disappear upon heating (i.e., at the gel–sol transition) for all the samples, confirming that the presence of the fibril structure is essential for the gel state. The fiber scattering is well-fitted by the hollow cylinder model with a radius of 55–60 Å and this model is consistent with the helical stacking model proposed by the previous study.
Introduction
A family of cholesterol derivatives appended with aromatic groups is well-known to gelatinize organic solvents.1–7 One of the peculiar features of these gelators is that the molecules assemble by themselves to form a long and rigid fibrous structure.1–7 The fibers orient randomly in the gel, and organic solvents can be held within the space between the fibers, probably, due to the capillary phenomenon.8 In this sense the randomly oriented fibers are essential for the organogelators and play the role of a “sponge” to absorb solvents. Murata et al.1 systemized a series of azobenzene-appended cholesterol gelators (AZC) and extensively studied their physicochemical properties. In their work, they proposed the cholesterol stacking helical model (see Fig. 1).1 Their model successfully explains the excitation coupling of the circular dichroism, which is only observed for the gel state. To prove this model, they carried out scanning and transmission electron microscopy; however, the structure seems to be too fine to obtain clear evidence from these techniques.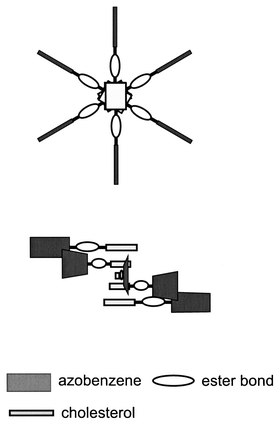 | ||
| Fig. 1 Schematic presentation of the helical stacking molecular assemblies of the cholesterol–azobenzene gelator proposed by Murata et al.1 to explain its circular dichroism. | ||
Ono et al.9 deposited tetraethoxysilane on the surface of AZC fibers and then carried out sol–gel polymerization of the silane using the fiber structure as a template. They discovered a remarkably regulated helical silica structure after pyrolysis of the resultant products. Since there is no reason to generate such a helical structure in the silica itself, the gelator fiber structure is presumably transcribed to the silica structure. Although their finding strongly supports the presence of the stacking helical structure, there is still the possibility that the azobenzene moieties are stacked instead of the cholesterol moieties. Furthermore, they found that the helical silica was observed only when an ionic AZC and a nonionic AZC were mixed in certain compositions: 5–15 wt% of the ionic compound (helical composition). Their results suggest that the fiber structure in the gel that results in the helical silica should be different from that in the gels in a composition other than the helical composition.
Synchrotron small angle X-ray scattering (SAXS) is a powerful method for exploring supramolecular structures. Since the synchrotron X-ray is almost 106 times stronger than conventional X-rays, it has great advantage for dilute solution systems such as organogels (usually the gelator’s concentration is less than 1–3 wt%). Terech et al.4–6,10 analyzed SAXS from several organogels and found that most of the scattering data can be fitted by a randomly oriented long cylinder model. In the case of the cholesterol derivatives with appended aromatic groups, however, the agreement between calculation and observation seems not as good as for other gelators.5
This report examines the temperature dependence of SAXS from the AZC gels, from which Ono et al.9 prepared helical silica, and compares the scattering profiles of the helical and other compositions. Through these studies, we propose a new model to explain the scattering from the AZC gels.
Experimental
An ionic and a nonionic AZC compound (denoted as AZC-I and AZC-N, respectively, see Fig. 2 for the chemical structures) were synthesized and purified according to Murata et al.1 The chemical structures were confirmed by 1H NMR spectroscopy and their melting temperatures, being 96 °C and above 250 °C for AZC-N and AZC-I, respectively, agreed with the reported values.1,9 The AZC-I or AZC-N was first dissolved in CH2Cl2 (10 g cm−3) and this solution was added to acetic acid so that the final concentration was 1.5 wt%. Furthermore, a mixed solution of AZC-I and AZC-N (ratio 1∶9 by weight) was prepared at 1.5 wt%. This gelator composition has been known to provide a helical silica fiber structure.9 We denoted these three samples made from AZC-I, AZC-N and the mixture as ION1, NON1 and MX1, respectively. After heating with a heat gun, all the sample solutions gelatinized within a few minutes upon cooling to room temperature. The sol–gel phase-transition temperatures (Tgel) were evaluated for the three solutions according to the established method1 to be 54, 56, and 53 °C for ION1, NON1, and MX1, respectively. The gels prepared from ION1 and MX1 were yellowish and transparent and the one prepared from NON1 was opaque and small crystallites were observed. | ||
| Fig. 2 Chemical structures of the ionic and nonionic gelators studied by Ono et al.2,3,9 and used in the present study. | ||
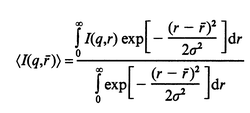
The SAXS measurements were carried out with the BL45XU biophysics beam line11 at SPring 8 in Japan. The wavelength of the X-ray was 1 Å and the beam was collimated to a 0.6 × 0.3 mm (horizontal × vertical) spot at the sample position and the flux was about 1012 photons at 100 mA. A capillary-type quartz cell with 2.0 mm diameter was purchased from Mark-Rohrchen and used for all experiments. The cell temperature (T![[hair space]](https://www.rsc.org/images/entities/char_200a.gif) ) was controlled by heating the aluminium block in which the scattering cell was mounted. The scattering intensity was measured with an X-ray image intensifier with a cooled CCD camera and the angular dependence of SAXS intensities I(q) was obtained by circular averaging, where q is the magnitude of the wavevector defined by eqn. (1).
) was controlled by heating the aluminium block in which the scattering cell was mounted. The scattering intensity was measured with an X-ray image intensifier with a cooled CCD camera and the angular dependence of SAXS intensities I(q) was obtained by circular averaging, where q is the magnitude of the wavevector defined by eqn. (1).

| (1) |
Results and discussion
Temperature dependence of small angle X-ray scattering
Fig. 3 shows the temperature dependence of SAXS from NON1, where the scattering curves have been vertically shifted to make comparison easier. At T < Tgel (Tgel = 56 °C), NON1 shows two sharp peaks at q = 0.127 and 0.131 Å−1, and above Tgel both peaks disappear. The sharpness of the peaks and the flat base line indicate that the major component of the gel fiber is a crystal. Panel A in Fig. 4 plots the peak intensities against temperature for both the 0.127 and 0.131 Å−1 peaks.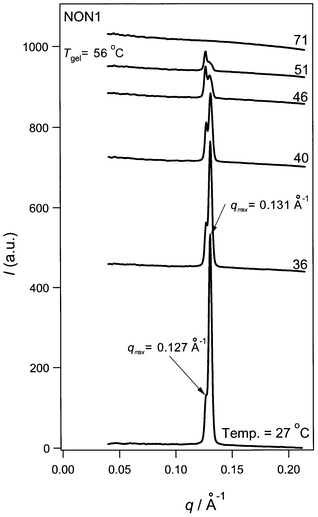 | ||
| Fig. 3 Temperature dependence of the SAXS profiles for NON1. | ||
 | ||
| Fig. 4 Intensity change in the crystalline peaks upon heating for NON1 (panel A) and ION1 (panel B). | ||
Terech et al.4,5,10 observed broad peaks in SAXS from other cholesterol gelators and they interpreted them in terms of the cylindrical fibril supramolecular structure. Although we can see the fiber image in NON1 by electron microscopy,1–3 similar to that of Terech et al., we do not see such a broad peak, or any trace of a large aggregate structure, which usually appears as a shoulder at lower q (for example see the profile at 101 °C in Fig. 5). As mentioned in the Experimental section, this gel was yellowish and opaque when prepared and after a few days visible crystallites had grown. All of these facts confirm that the fibril structure of this sample consists of the AZC-N crystal.
 | ||
| Fig. 5 Temperature dependence of the SAXS profiles for ION1. An example of the deconvolution is presented by the dotted line. | ||
As shown in Fig. 4A, the intensity at q = 0.127 Å−1 is essentially unchanged up to T = 51 °C and above Tgel (ca. 55 °C) the peak disappears. On the other hand, the peak intensity at q = 0.131 Å−1 decreases with increasing T and above Tgel it also disappears. Since the two peaks independently decrease in intensity, we consider that two types of crystals exist in the system. The values of q = 0.127 and 0.131 Å−1 provide a characteristic spacing of 49.5 and 48 Å, respectively. These lengths are comparable with the intermolecular distance in the crystal, assuming that AZC-N has a crystalline structure similar to that of the cholesteryl anthraquinone-2-carboxylate studied by Ostuni et al.12 However, the corresponding crystalline lattice parameter is unknown and X-ray crystallography is needed to clarify the origin of these peaks. As clarified by our previous studies,1–3 the SEM image for NON1 shows a fibril structure and the size of the fiber is about 500–2000 Å. The present SAXS data show that the characteristic order of the molecular assembly is 50 Å. In order to form a fibril structure, there should be an intermediate structure (or ordering) to correlate the molecular assembly and the fiber. However, neither SEM nor SAXS provide any clues to help to answer this question.
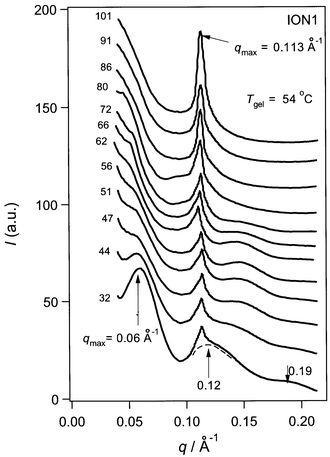
Fig. 5 presents the temperature dependence of SAXS from ION1. Compared with NON1, the scattering profiles are rather complicated. At 32 °C, three broad peaks and one sharp peak can be observed. Three broad peaks around q = 0.06, 0.120, and 0.19 Å−1 at 32 °C are probably due to the supramolecular structure of the gel. With increasing temperature, these broad peaks become less defined and finally disappear at T > Tgel. Even above Tgel, however, strong scattering still remains in the lower q range. This indicates heterogeneity or the presence of relatively large aggregates in this system. The sharp peak, due to a crystalline structure, appears at q = 0.113 Å−1. The peak intensity is unchanged below Tgel whereas above Tgel it increases with increasing T (see the plot of the deconvoluted intensity against T in Panel B of Fig. 4).
The disappearance of the broad peaks above Tgel demonstrates that these peaks are related to the gel fiber structure. Furthermore, by referring to earlier work,5,6,10 it becomes clear that these three peaks can be assigned to the particle scattering from a bundle-type molecular aggregate. The presence of the crystal peak at 32 °C means that some of the bundle contains crystals or at least that bundle and crystal coexist. When we measured the scattering immediately after preparing the gel, there is no sharp peak and only weak, broad peaks are observed (Fig. 6). The data presented in Fig. 5 were recorded two days after the solution was prepared. Therefore, it seems that during the two days, bundles as well as crystallites have grown. These facts suggest that the bundle structure without crystallites (Fig. 6) is a metastable state for ION1 and the system may eventually transform into a crystal structure, such as that seen for NON1.
 | ||
| Fig. 6 Scattering profile for ION1 measured immediately after preparation of the gel. | ||
The difference between ION1 and NON1 can probably be ascribed to the difference in the type of interaction that governs the system. Van der Waals forces are essential for NON1 and these moderate attractive forces are usually not strong enough to sustain a metastable state. On the other hand, electrostatic interactions must play a major role in the structure formation for ION1. In some cases, electrostatic interaction can create diversification in the structure; the structure is determined kinetically or by the thermal or mechanical history. Therefore, the time-dependent structure for ION1 can be explained as follows. When the ION1 solution is prepared, an ionic pair of AZC-I molecules is immediately formed and this attractive force is so dominant as to freeze the molecular motion to settle the system toward the most stable state (crystal state). This initial stage should correspond to the amorphous nature of the sample (Fig. 6). While the sample is left to stand at room temperature, the solution should slowly drift to the stable state owing to the thermal energy, and after two days we can observe the crystalline peak (Fig. 5).
Fig. 7 illustrates the temperature dependence of SAXS from MX1. The scattering profiles in the figure are apparently different from a combination of ION1 (Fig. 5) and NON1 (Fig. 3). This implies that both AZC-I and AZC-N mix at the molecular level to form a different structure from that formed from the individual compounds. In contrast to ION1 and NON1, there is no sharp peak due to crystallites and this feature did not change when we measured the SAXS after 2 days. This result indicates that crystallization does not occur in this system. This can be explained by the mixture effect: adding a small amount of compatible component (AZC-I) to the crystalline material (AZC-N) can make the system amorphous. At 31 °C, the scattering profile shows two broad peaks at q = 0.13 and 0.19 Å−1 and a faint peak around 0.06 Å−1. With increasing T, these three peaks disappear at T > Tgel. Since Ono et al.2,3,9 confirm that a fibril structure exists in the gel state for MX1 and it disappears at T > Tgel, these three peaks should be due to scattering from the fibril structure. The peak positions of MX1 are similar to those of the broad peaks in ION1. This agreement indicates that a similar fibril structure is formed in the gel of ION1 and MX1 at room temperature.
 | ||
| Fig. 7 Temperature dependence of the SAXS profiles for MX1. | ||
The similarity in the scattering curves between MX1 and ION1 is surprising, since 90 wt% of the gelator in MX1 is AZC-N, which is a crystallizing component and its SAXS profile has no broad peak (see Fig. 3). This coincidence suggests that a fibril structure with the peaks at q = 0.06, 0.13, and 0.19 Å−1 is a common feature for cholesterol gelators. Therefore, these three peaks are related to the molecular assemblies shown in Fig. 1.
The foregoing results show that MX1 has a completely amorphous fiber. As mentioned in the introduction, the helical silica structure is only made from MX1 by the template reaction. This suggests that it is important that the gel has an amorphous nature, i.e., the fibril structure without any crystals, in order to carry out the sol–gel template reaction. This can be explained by competition of the well-defined structure of a crystal with the fiber structure in the template reaction, thus disturbing the transformation of the helical structure into the final silica structure.
Theoretical analysis of the small angle X-ray scattering
Terech et al.4,5,10 extensively studied SAXS from organogels and found that the randomly oriented solid cylinder model can describe the scattering profiles. According to them, the solid cylinder with a diameter of r gives the q dependence of I as given in eqn. (2). Here, J1 is the first-order Bessel function. In order to account for the distribution in r, we use the Gaussian function [eqn. (3)]. Here, r is the average radius and σ is the standard deviation of r. The best fit using a combination of eqns. (2) and (3) is shown in Fig. 8. The agreement between calculation and experiment, however, is not good and there are two serious problems shown by the following. The first problem is that the model with r = 85 Å can fit the first peak (q = 0.06 Å−1), though, it does not fit the second peak (q = 0.12 Å−1) for its position as well as its intensity. On the other hand, the model with r = 65 Å cannot fit the first peak, while it does fit the second peak. Therefore, it is difficult to fit the peak positions with this model. The second problem is that eqn. (2) predicts the power low of I ∝ q−4 at the top of the peak (the indicated slope in the figure). However, this low does not agree with the data. These two problems indicate that the solid cylinder model is inadequate to interpret the experimental data. | ||
| Fig. 8 Comparison of the measured SAXS data and the particle scattering functions of the solid cylinder model with r = 65 and 85 Å. | ||

| (2) |
| (3) |
Instead of the solid cylinder model, we tried to fit the data using the randomly oriented hollow cylinder model, whose particle scattering function is given by eqn. (4)13 where J0 is the zeroth-order Bessel function. Similar to the above discussion, we found the best fit for our data by substituting eqn. (4) into eqn. (3) and using the iteration method. The results are presented in Fig. 9. As shown in this figure, the power low of the hollow cylinder model is given by I ∝ q−2 and this feature satisfactorily represents that of the data. Furthermore, the three observed peak positions are well matched by the calculations. Consequently, we can conclude that the fiber structure in the present system can be represented by the hollow cylinder model with r = 60–55 Å rather by than the solid cylinder model.
 | ||
| Fig. 9 Comparison of the measured SAXS data and the particle scattering functions of the hollow cylinder model with r = 65 and 55 Å. | ||

| (4) |
The contrast for the X-ray scattering is based on the electron density difference in the system.14 The hollow cylinder model can explain the data, thus we consider that the electron density of the outside of the gel fiber is higher than that of the inside. This speculation is consistent with the helical stacking model presented in Fig. 1, where the azobenzene moiety, which has a higher electron density, is located on the outside of the fiber and the cholesterol and alkyl chain, which have a lower electron density, are on the inside of the gel fiber. The resultant r value of 55–60 Å is in a reasonable order to the molecular structure and agrees with the SAXS results for other cholesterol gels studied by Terech et al.4,5 However, a more elaborate analysis and accurate scattering data are required for a more detailed correspondence between the model and the chemical structure.
Conclusion
We carried out synchrotron SAXS from ION1, NON1, and MX1 and found that NON1 gives a crystalline fiber, ION1 gives an amorphous fiber coexisting with a small amount of the crystal, and MX1 shows a completely amorphous fiber. The scattering from the fibers disappears at T > Tgel for all of the samples, confirming that the presence of fibers is essential for the gel state. Furthermore, from comparison with the results of Ono et al., the amorphous nature has been found to be essential to transcribe the fibril structure into the silica by the template reaction. The fiber scattering is well-fitted by the hollow cylinder model with r = 55–60 Å and this model is consistent with the helical stacking model proposed by Murata et al.1Acknowledgements
This work is performed under the approval of the SPring8 Advisory Committee (No. 1999B0391-DN-np).References
- K. Murata, M. Aoki, T. Suzuki, T. Harada, H. Kawabata, T. Komori, F. Ohseto, K. Ueda and S. Shinkai, J. Am. Chem. Soc., 1994, 116, 6664 CrossRef CAS.
- Y. Ono, Y. Kanekiyo, K. Inoue, J. Hojo and S. Shinkai, Chem. Lett., 1999, 23 CrossRef CAS.
- Y. Ono, K. Nakajima, M. Sano, Y. Kanekiyo, K. Inoue, J. Hojo and S. Shinkai, Chem. Commun., 1998, 1477 RSC.
- P. Terech, E. Ostuni and R. G. Weiss, J. Phys. Chem., 1996, 100, 3759 CrossRef CAS.
- P. Terech, I. Furman, R. G. Weiss, H. B. Laurent, J. P. Desvergne and R. Ramasseul, Faraday Discuss., 1995, 101, 345 RSC.
- P. Terech and R. G. Weiss, Chem. Rev., 1997, 97, 3133 CrossRef.
- Y. Lin, B. Kachar and R. G. Weiss, J. Am. Chem. Soc., 1989, 111, 5542 CrossRef CAS.
- R. Wang, C. Geiger, L. Chen, B. Swanson and D. G. Whitten, J. Am. Chem. Soc., 2000, 122, 2399 CrossRef CAS.
- Y. Ono, K. Nakajima, M. Sano, Y. Kanekiyo, J. Hojo and S. Shinkai, Chem. Lett., 1999, 1119 CrossRef CAS.
- P. Terech, J. J. Allegraud and C. M. Garner, Langmuir, 1998, 14, 3991 CrossRef CAS.
- T. Fujisawa, J. Synchrotron Radiat., 1999, 12, 194.
- E. Ostuni, P. Kamaras and R. G. Weiss, Angew. Chem., Int. Ed. Engl., 1996, 35, 1324 CrossRef.
- I. S. Fedorova and P. W. Schmidt, J. Appl. Crystallogr., 1978, 11, 405 CrossRef CAS.
- O. Kratky , in Small Angle X-ray Scattering, eds. O. Glatter and O. Kratky, Academic Press, New York, 1982, p. 3. Search PubMed.
| This journal is © The Royal Society of Chemistry 2001 |