Integration of a wet analysis system on a glass chip: determination of Co(II) as 2-nitroso-1-naphthol chelates by solvent extraction and thermal lens microscopy
Tomoko
Minagawa
a,
Manabu
Tokeshi
b and
Takehiko
Kitamori
*ab
aDepartment of Applied Chemistry, Graduate School of Engineering, The University of Tokyo, 7-3-1 Hongo, Bunkyo-ku, Tokyo, 113-8656, Japan. E-mail: kitamori@icl.t.u-tokyo.ac.jp; Fax: +81 3 5841 6039
bIntegrated Chemistry Project, Kanagawa Academy of Science and Technology (KAST), 3-2-1 Sakado, Takatsu-ku, Kawasaki-shi, Kanagawa, 213-0012, Japan
First published on 9th August 2001
Abstract
The integration of a wet analysis system on a glass chip was demonstrated and determination of Co(II) was performed using this system. The Co(II) was extracted into m-xylene from aqueous solution as 2-nitroso-1-naphthol chelates, and colorimetric determination of the m-xylene phase was applied by a thermal lens microscope. The integration of the chemical operation procedures shown here leads to a considerable reduction in analyzing time. The time for extraction in the integrated system, 10 min, was about tenfold shorter than a conventional system using a separatory funnel and mechanical shaker. Moreover, troublesome operations such as phase separation necessary for the conventional system could be omitted. The determination of Co(II) in the range 2 × 10⁻⁷–1 × 10⁻⁸ M, which was estimated to be 0.072–1.44 zmol, was achieved.
Introduction
Recently, there has been great interest in utilizing micromachining techniques to fabricate miniaturized chemical devices.1,2 The development of these devices has brought about many advantages, including simplified experimental operations, shortened measurement time, reduced sample and waste quantities, and so on. These merits are important for a variety of fields such as analytical chemistry, biochemistry, clinical diagnosis, medicinal chemistry and industrial chemistry. However, to date, most of the published works have concentrated on the area of biochemical analysis, e.g. DNA analysis and sequencing; capillary electrophoresis and fluorescence detection have been used in combination because of their high performance for fluid control, separation and detection sensitivity. Although this combination is an ideal system for biochemical analysis, other approaches are also necessary to realize wider applications as mentioned above.Then, we paid attention to molecular behavior in a microspace. Regardless of the size of the space, molecular behavior such as molecular diffusion and chemical reaction is based on the thermodynamics governing free energy, entropy and enthalpy. Therefore diffusion and the rate of a reaction are not dependent on the size of the space. However, as the size of the space decreases, the time required to reach thermodynamic equilibrium of diffusion and the reaction becomes shorter. Thus, we consider that high performance analysis systems, using only spontaneous molecular behavior, can be realized in a microspace.
There are several characteristic features of the microspace, for example, short diffusion distance, high interface-to-volume ratio (the specific interface area), and small heat capacity. We have demonstrated the integration of flow injection analysis,3,4 solvent extraction,5–8 immunological analysis9,10 and temperature control of an enzyme reaction11 on a microchip making use of these characteristics. In particular, to control molecular transport between different phases in the microspace such as on microchips, the molecular transportation time and the specific interface area must be considered. The molecular transportation time (diffusion time) is given by
| t = l2/D | (1) |
| σ = S/V ≅ 1/l | (2) |
In this paper, we report the integration of a chelating reaction of divalent cobalt ion with 2-nitroso-1-naphthol and solvent extraction of its cobalt chelates on a microchip taking into account the scale merits as described above. This is the first report on the integration of the wet analysis procedures including two chemical processes of the chelating reaction and solvent extraction.
Experimental
Glass chip
The details of our glass chip have been previously published.3,6 The chip was composed of three quartz glass plates, i.e., cover, middle, and bottom plates having thicknesses of 170, 100, and 500 µm, respectively. Each plate was a 32 × 66 mm rectangle. A highly focused and intensified CO2 laser beam was shone on the middle plate to pierce the channel part, and then the beam was scanned to inscribe the channel pattern. The microchannels were made inside the glass chip by sandwiching the middle plate between the top and bottom plates. Five small holes 0.5 mm in diameter were mechanically bored, ultrasonically, on the top glass for three inlets and two outlets (drains). These three plates were laminated using optical contact, that is, the plates were polished to an optically smooth and flat (λ/10) finish, and then laminated together in an oven at 1150 °C without any adhesive.Fig. 1 shows the layout and dimensions of the glass chip. The microchannels were 250 µm wide and 100 µm deep. The chip had a reaction and solvent extraction zone of the 5 mm length.
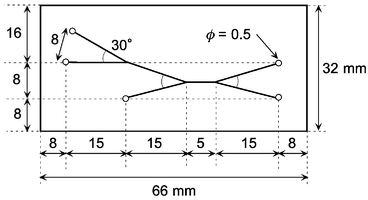 | ||
| Fig. 1 Layout and dimensions of the microchip. The microchannels were 100 µm deep and 250 µm wide. | ||
Reagents
A Co(II) standard solution (1000 ppm), 2-nitroso-1-naphthol (NN), sodium hydroxide and m-xylene were obtained from Wako Pure Chemical Industries (Osaka, Japan). Co(II) standard solution, sodium hydroxide and m-xylene were analytical grade. 2-Nitroso-1-naphthol was purified by using the protocol of the literature.13 Ultrapure water was obtained using an ultrapure water purification apparatus (Nomura Micro Science, Kanagawa, Japan, TW-600RU).The sample solutions of Co(II) (1 × 10⁻⁸–2 × 10⁻⁷ M) were prepared by the stepwise dilution of the standard solution with ultrapure water. A NN solution (ca. 3.4 × 10⁻⁵ M) including sodium hydroxide was also prepared by the literature procedure.13
Instrumentation
The thermal lens microscope (TLM) used for an ultrasensitive detection has been described previously.6–11 Briefly, the TLM system consisted of an optical microscope (Nikon, Tokyo, Japan, special design); two lasers, one an Ar+ laser (Lexel Laser, Fremont, CA, Model-95, 488 nm, 200 mW) for the excitation beam and the other a He–Ne laser (Melles Griot, Carlsbad, CA, 632.8 nm, 15 mW) for the probe beam; and opto-electronic detection systems. The excitation beam, which was modulated at 1060 Hz by a light chopper (NF Electronic Instruments, Yokohama, Japan, 5584A) and the probe beam were coaxially aligned by a dichroic mirror and a mirror in the bodytube of the microscope and then introduced into an objective lens with a numerical aperture of 0.46 and ×20 magnification (Nikon, CF IC EPI Plan). Transient divergence of the probe beam, induced by the modulated thermal lens effect, was detected as a change in the light intensity. The probe laser intensity passed through a condenser lens, a glass filter (Melles Griot, Rochester, NY, 03FCG089) and an interference filter (Melles Griot, 03FIL024) before being monitored with a photodiode (Electro-Optics Technology, Traverse City, MI, ET-2030). The intensity signal went to a low-noise preamplifier (NF Electronic Instruments, LI-75A) and a lock-in amplifier (NF Electronic Instruments, LI-575) before being recorded on a chart recorder (Rikadenki Electronics, Tokyo, Japan, R-62A).Operating procedures for integrated system
The flow rates of the liquid samples used as extracting solvent, reagent and sample were controlled by three syringes (Hamilton, Reno, NV, 1710TLL) and two microsyringe pumps (KD Scientific, Boston, MA, model-200 and model-100). A fused silica capillary tube (GL Sciences, Tokyo, Japan) was used for connection of the syringes and microchip as described previously.6,7Operating procedures for conventional method
The ordinary analytical experiments in the bulk scale were carried out by a conventional method with separatory funnels, a shaker, beakers, pipettes, and a cuvette, in order to compare the results of the present integrated system and the conventional method. A 5 ml portion of sample solution, 5 ml of NN solution, and 5 ml of m-xylene were shaken well in a separatory funnel with a shaker. After this, the separatory funnel was allowed to stand until the liquid sample separated completely into two phases (aqueous and organic phases). Then, the absorbance of Co complex in the organic phase was measured by a conventional absorption spectrometer (Shimadzu Corporation, Kyoto, Japan, UV-1601PC). To carry out a reference experiment, the prepared organic phase was introduced into the microchannels and measured by the TLM.Results and discussion
Chelating reaction and solvent extraction scheme for the integrated system
In order to realize a chelating reaction of Co(II) with 2-nitroso-1-naphthol and solvent extraction in a microchannel, we fabricated a microchip having a microchannel pattern suited to our purpose, as shown in Fig. 1. It is extremely important to produce a stable liquid/liquid interface for the realization of solvent extraction on the microchip because it is very difficult to stabilize an organic/aqueous interface in a capillary tube such as a microchannel. Very recently, for the first time, we succeeded in solvent extraction on the microchip.6 With reference to our previous studies,6,7 the angles of encounter of the liquids and length of the extraction zone in the microchannel were optimized for the present study. Fig. 2 shows a schematic illustration of molecular behavior in the microchannels. First, the m-xylene and the NN solution were introduced into two inlets of the first Y-shaped microchannel by the first microsyringe pump at a constant flow rate (4 cm s−1). These two liquids met at the intersection point, and a parallel two-phase laminar flow, i.e. an organic/aqueous interface, was formed in the microchannel. In this region, the NN in the aqueous solution could not be extracted into m-xylene whether the liquids were flowing or not. This was confirmed by absorption spectrophotometry in the bulk experiment using the separatory funnel. Next, the sample solution of Co(II) was introduced into the third inlet of the second Y-shaped microchannel by the second microsyringe pump at the same constant flow rate (4 cm s−1). Then, a parallel three-phase laminar flow was formed from behind the intersection point of the second Y structure during flow. There was almost no interdiffusion in the three fluids under the flow condition although it depended on the flow rate. In our experimental conditions, interdiffusion could never occur. Thus, the chelating reaction of Co(II) with the NN and extraction of Co chelates did not occur under flow. When the flow was stopped, the NN solution and the Co(II) sample solution were promptly mixed, and Co(II) reacted with NN. Then, the reaction product, Co chelates, in the aqueous phase was extracted into the organic phase. Finally, the Co chelates in m-xylene were detected by TLM at the center of the m-xylene phase, just halfway between the organic/aqueous interface and a sidewall (a point ca. 62.5 µm from the microchannel sidewall), 2.5 mm downstream from the second intersection point. A typical time course of the TLM signal is shown in Fig. 3. This time course corresponds to that of the extraction of the Co chelates from the aqueous phase to the organic phase. After the flow was stopped, the intensity of the TLM signal gradually increased about 1 min later. This time lag for the signal rise may be caused by streaming of sample liquids after the syringe pumps were stopped and the properties of the Co chelates. The signal reached at extraction equilibrium after about 10 min. As shown in a comparison with the conventional system later, the time to reach extraction equilibrium in the present system was about twelve times faster than that of the conventional system. In our previous studies of solvent extraction,6,7 the extraction time could be estimated by molecular diffusion. Since the diffusion time, which was calculated from the diffusion distance and diffusion coefficient, was about 60 s, the present result could not be explained by molecular diffusion alone. In the present experiment, the chelating reaction of Co(II) with 2-nitroso-1-napthol may be considered as the diffusion-controlled reaction.14 Thus, the present result showed that extraction was influenced strongly by the interfacial adsorption of the Co chelates and the interfacial potential. Of course, the magnitude of their influences would be dependent on the chemical substances used.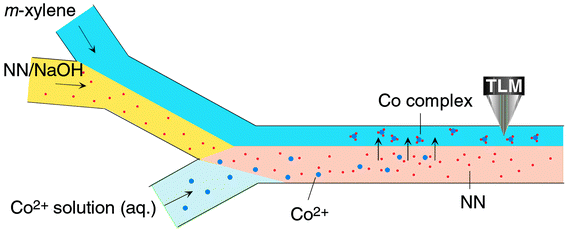 | ||
| Fig. 2 Schematic illustration of the chelating reaction and solvent extraction in the microchannel. | ||
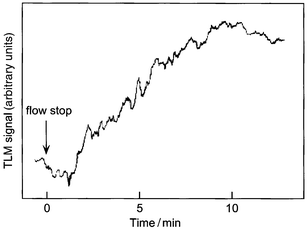 | ||
| Fig. 3 A typical time course of the TLM signal. The concentration of Co(II) solution was 1 × 10⁻⁷ M. | ||
Comparison between the integrated system and the conventional system
A comparison with the conventional system is necessary for performance evaluation of the present system. We then carried out experiments by the conventional method using a separatory funnel (sample solution, 5 ml; NN solution, 5 ml; m-xylene, 5 ml) and mechanical shaker (300 times min−1). The same volume ratio of 1∶1∶1 was used in the experiments in order to make a strict comparison with the present system. Fig. 4 shows the dependence of the absorbance on the shaking time. It took about ten times longer for the conventional system to reach extraction equilibrium. This result was due to the characteristic factors of the microspace such as the short diffusion distance and the large specific interface area.6,7 Although the present experiment was used in microchannels having a 250 µm width, the analysis time would be reduced easily by using a narrower channel. Actually, in the same experiment that used microchannels having a 50 µm width, the time to reach extraction equilibrium was about 150 s.15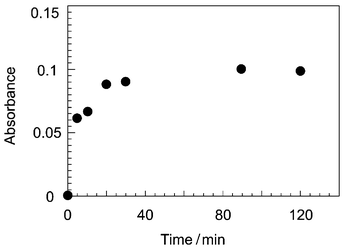 | ||
| Fig. 4 Dependence of the absorbance on the shaking time as measured with a conventional spectrophotometer. The concentration of the Co(II) was 50 µM. | ||
Fig. 5 shows the dependence of the TLM signal on the concentration of Co(II) in the m-xylene phase. For the conventional system using a separatory funnel, the Co chelates were extracted from the aqueous phase into the organic phase and the organic phase, including only Co chelates, was introduced into the same microchannel and then detected. Both results showed good linearity in the range of 1 × 10⁻⁸–2 × 10⁻⁷ M. As in our own previous work,6 the TLM signal intensity in the integrated system was slightly smaller than that in the conventional system. This result may be caused by adsorption on the channel surface of Co ions in the aqueous phase. This adsorption may be eliminated by applying the proper surface treatment.
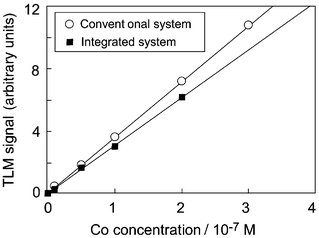 | ||
| Fig. 5 Calibration curves of Co(II) concentration in the range of 1 × 10⁻⁸–2 × 10⁻⁷ M. | ||
The volume of the extraction zone in the integrated system was 125 nl (assuming introduction of the same quantities; the sample solution of Co(II), 41.7 nl; NN/NaOH solution, 41.7 nl; m-xylene, 41.7 nl). Assuming that the Co(II) ions introduced reacted completely with NN and all of the chelates formed were extracted into the m-xylene phase, the absolute amounts of the Co(II) ions extracted were 0.42–8.34 fmol. The Co(II) ions detected were estimated to be 0.072–1.44 zmol from the absolute amounts of Co(II) ions and the detection volume of the TLM, 7.2 fl.7 Actually, the amount of Co chelates detected by this integrated system should be less than these values, since the reaction was incomplete and there was adsorption of the Co(II) ions on the microchannel sidewall.
Conclusions
In this work, we have successfully demonstrated the integration of wet analysis procedures, including two chemical processes of a chelating reaction and a solvent extraction, on a microchip. The solvent extraction procedures integrated in the present work will allow wider applications in fields including analytical chemistry, organic synthesis and industrial chemistry. Since solvent extraction after chemical reactions is an essential operation process for organic synthesis, the present technique may lead to a microchip-based combinatorial organic synthesis system in the future. Our future applications will focus on the addition of other chemical operations to the present system.Acknowledgement
The authors would like to thank the staff of the Integrated Chemistry Project (KAST) and The University of Tokyo for valuable discussions on the subject. The authors also thank Mrs Junko Fujita of the Laboratory of Analytical Chemistry, Kaken Co., Ltd., for synthesis of 2-nitroso-1-naphthol and Prof. Tsuguo Sawada and Prof. Masanori Fujinami of The University of Tokyo for their useful discussions and suggestions. This research was partially supported by the SHISEIDO Grant for Science and Technology Research, 2000 and the Grant-in-Aid for University and Society Collaboration (No.11794006) from the Ministry of Education, Science, Sports and Culture of Japan.References
- Micro Total Analysis Systems 2000, ed. A. van den Berg, W. Olthuis and P. Bergveld, Kluwer Academic Publishers, Dordrecht, 2000 Search PubMed.
- Microsystems Technology in Chemistry and Life Sciences, ed. A. Manz and H. Becker, Springer-Verlag, Berlin, 1999 Search PubMed.
- K. Sato, M. Tokeshi, T. Kitamori and T. Sawada, Anal. Sci., 1999, 15, 641 CAS.
- H. M. Sorouraddin, A. Hibara, M. A. Proskurnin and T. Kitamori, Anal. Sci., 2000, 16, 1033 CAS.
- K. Sato, M. Tokeshi, T. Sawada and T. Kitamori, Anal. Sci., 2000, 16, 455..
- M. Tokeshi, T. Minagawa and T. Kitamori, Anal.
Chem., 2000, 72, 1711 CrossRef CAS .
![[*]](https://www.rsc.org/images/entities/char_e103.gif) This paper was the first to report on solvent extraction using a microchip.
This paper was the first to report on solvent extraction using a microchip. - M. Tokeshi, T. Minagawa and T. Kitamori, J. Chromatogr. A, 2000, 894, 19 CrossRef CAS.
- H. Hisamoto, T. Horiuchi, M. Tokeshi, A. Hibara and T. Kitamori, Anal. Chem., 2001, 73, 1382 CrossRef CAS .
This paper was the first to highlight the potential of integration for ion-sensing systems using the neutral ionphore-based ion pair extraction reaction.
- K. Sato, M. Tokeshi, T. Odake, H. Kimura, T. Ooi, M. Nakao and T. Kitamori, Anal. Chem., 2000, 72, 1144 CrossRef CAS.
- K. Sato, M. Tokeshi, H. Kimura and T. Kitamori, Anal. Chem., 2001, 73, 1213 CrossRef CAS .
This paper was the first to report on a microchip-based diagnosis system that is useful practically for clinical diagnosis with short analysis time, high sensitivity, and easy to use procedures.
- Y. Tanaka, M. N. Slyadnev, A. Hibara, M. Tokeshi and T. Kitamori, J. Chromatogr. A, 2000, 894, 45 CrossRef CAS.
- CRC Handbook of Chemistry and Physics, ed. D. R. Lide, CRC Press, Boca Raton, FL, 78th edn., 1997, pp. 5–93 Search PubMed.
- T. Kitamori, K. Suzuki, T. Sawada, Y. Gohshi and K. Motojima, Anal. Chem., 1986, 58, 2275 CrossRef CAS.
- T. Kitamori, unpublished work..
- M. Tokeshi, T. Minagawa, K. Uchiyama, A. Hibara, K. Sato, H. Hisamoto and T. Kitamori, manuscript in preparation. This cannot be compared straightforwardly with the present results, because the aspect ratio (width-to-depth ratio) of the microchannel used is different from that in the present experiment.
| This journal is © The Royal Society of Chemistry 2001 |