Structural and transport characteristics of the LAMOX family of fast oxide-ion conductors, based on lanthanum molybdenum oxide La2Mo2O9†
F.
Goutenoire
*a,
O.
Isnard
b,
E.
Suard
c,
O.
Bohnke
a,
Y.
Laligant
a,
R.
Retoux
a and
Ph.
Lacorre
a
aLaboratoire des Fluorures, UPRES-A CNRS 6010, Université du Maine, 72085, Le Mans Cedex 9, France. E-mail: francois.goutenoire@univ-lemans.fr
bLaboratoire de Cristallographie, BP 166, 38042, Grenoble Cedex 9, France
cInstitut Laue-Langevin, BP156X, 38042, Grenoble Cedex 9, France
First published on 5th October 2000
Abstract
A new family of fast O2− conductors, which exhibit
anionic conductivity comparable to that of stabilised zirconia, is presented.
The parent compound of this new family, hereafter called LAMOX, is lanthanum
molybdate La2Mo2O9. Various substitutions
have been attempted: on the lanthanum site (La2 − xAx)Mo2O9 with A = Sr, Ba, K, or Bi; on the molybdenum site La2(Mo2 − xBx)O9 with B = Re, S, W, Cr
and V; and on the oxygen site with fluorine. Most of these substitutions suppress
the phase transition which occurs in La2Mo2O9
around 580![[thin space (1/6-em)]](https://www.rsc.org/images/entities/char_2009.gif) °C from a low temperature α form to a high temperature (more
conducting)
β form, and stabilise the β form at room temperature.
Several members of the LAMOX series are studied through X-ray and neutron
diffraction, and conductivity measurements. Large O2− thermal
factors and local static disorder agree well with the anionic nature of the
conductivity. Partly vacant sites with short inter-site distances suggest
a most probable conduction path with tridimensional character.
°C from a low temperature α form to a high temperature (more
conducting)
β form, and stabilise the β form at room temperature.
Several members of the LAMOX series are studied through X-ray and neutron
diffraction, and conductivity measurements. Large O2− thermal
factors and local static disorder agree well with the anionic nature of the
conductivity. Partly vacant sites with short inter-site distances suggest
a most probable conduction path with tridimensional character.
1 Introduction
Fast oxide-ion conductors attract considerable interest for both fundamental and technical reasons, due to their important fields of application, among which solid oxide fuel cells, oxygen sensors, or oxygen pumping devices (see, for instance, recent reviews such as refs. 1 and 2, and references therein). The main oxide-ion conductors known to date belong to four distinct structural groups: fluorite type (stabilised zirconia,3 ceria, δ-Bi2O3,4,5...), deficient perovskites6 (doped LaGaO37,8 or browmillerite phases), Aurivillius type phases (BIMEVOX), 9,10 pyrochlores11 (Gd2Zr2O7, Gd2Ti2O7).12 Among those, the most famous and commonly used materials are stabilised zirconia.3Given the widespread interest of such materials, any new finding on the topic should stimulate research in the field, with the aim to increase anionic conductivity at lower temperature. Here we present a new family of fast oxide-ion conductors: the LAMOX series, based on atomic substitutions on the parent compound La2Mo2O9.13,14 The most probable conduction path in La2Mo2O9 is deduced from its crystallographic arrangement (Section 2), and the extension (Section 3) and conduction properties (Section 4) of the LAMOX family are explored through several ionic substitutions.
2 Parent compound La2Mo2O9
We have recently discovered13,14 a new family of fast oxide-ion conductors whose parent compound is lanthanum molybdate La2Mo2O9, which exhibits a transition from a slightly distorted low temperature α form, to a cubic high temperature β form. It is accompanied by an abrupt increase by almost two orders of magnitude of the anionic conductivity (see Fig. 1). Above this transition, which takes place around 580![[thin space (1/6-em)]](https://www.rsc.org/images/entities/char_2009.gif) °C, the oxide-ion
conductivity is slightly higher than that of yttria-stabilized zirconia,
the reference compound in the field.
°C, the oxide-ion
conductivity is slightly higher than that of yttria-stabilized zirconia,
the reference compound in the field.
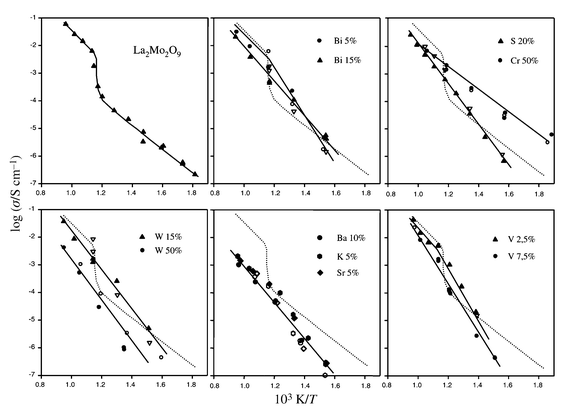 | ||
| Fig. 1 Arrhenius plot of the conductivity of pure and substituted La2Mo2O9, upon heating (solid symbols) and cooling (open symbols). | ||
2.1 Crystal structure of β-La2Mo2O9
Neutron powder diffraction patterns were recorded at two temperatures (620![[thin space (1/6-em)]](https://www.rsc.org/images/entities/char_2009.gif) °C
and 670
°C
and 670![[thin space (1/6-em)]](https://www.rsc.org/images/entities/char_2009.gif) °C) on Bragg–Brentano X-ray diffractometers
and/or on the Debye–Scherrer neutron diffractometers D2B (ILL)
and D1B (CRG-CNRS instrument operating at the ILL). These patterns
were collected under the following conditions: angular range 12.5°–91.85°,
step 0.2°, wavelength 1.28 Å, total counting time 12 hours
on D1B, and angular range 0°–160°, step 0.05°, wavelength
1.59 Å, for 6 hours on D2B. All measurements were recorded
under air in a silica glass container. Fourier syntheses and structural refinements
were calculated and refined with programs FullProf and ShelxL93.15,16
°C) on Bragg–Brentano X-ray diffractometers
and/or on the Debye–Scherrer neutron diffractometers D2B (ILL)
and D1B (CRG-CNRS instrument operating at the ILL). These patterns
were collected under the following conditions: angular range 12.5°–91.85°,
step 0.2°, wavelength 1.28 Å, total counting time 12 hours
on D1B, and angular range 0°–160°, step 0.05°, wavelength
1.59 Å, for 6 hours on D2B. All measurements were recorded
under air in a silica glass container. Fourier syntheses and structural refinements
were calculated and refined with programs FullProf and ShelxL93.15,16
The electron diffraction study was performed on a 200 kV side entry JEOL 2010 electron microscope with a double tilt specimen holder operated at room temperature.
In our previous structural study based on the D1B pattern,14 four different models were tested, the most consistent one appearing to be model D, with three oxygen sites O1, O2 and O3, and a slight cationic deficiency (La3.556Mo3.556O16 = La2Mo2O9). The result of the new refinements using the D2B data, with about 24% more reflections, is in agreement with the previous arrangement (see Table 1, and Fig. 2(a) for final refinement).
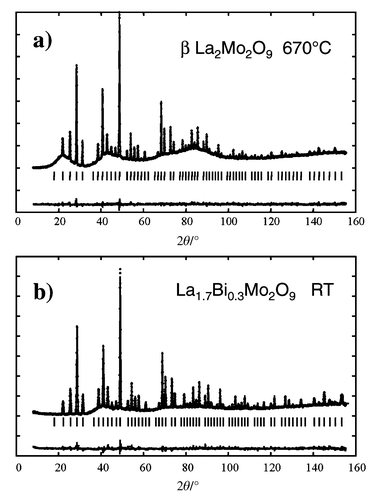 | ||
Fig. 2
D2B neutron diffraction
pattern fits (model D) of the crystal structure of: a)
β-La2Mo2O9
at 670![[thin space (1/6-em)]](https://www.rsc.org/images/entities/char_2009.gif) °C. Note that the strong undulating background is in this
case due to diffuse scattering from the glass container. b) La1.7Bi0.3Mo2O9
at room temperature. In this case the strong undulating background is due
to the sample. Dots = observed patterns; lines = calculated
patterns; below = difference pattern. °C. Note that the strong undulating background is in this
case due to diffuse scattering from the glass container. b) La1.7Bi0.3Mo2O9
at room temperature. In this case the strong undulating background is due
to the sample. Dots = observed patterns; lines = calculated
patterns; below = difference pattern.
| ||
![[thin space (1/6-em)]](https://www.rsc.org/images/entities/char_2009.gif) °C)
and La1.7Bi0.3Mo2O9
(25
°C)
and La1.7Bi0.3Mo2O9
(25![[thin space (1/6-em)]](https://www.rsc.org/images/entities/char_2009.gif) °C)
°C)
| a B iso = 4/3a2 (β11 + β22 + β33). b Isotropic B thermal factors. c From reference 17, single crystal data. | ||||||||||
|---|---|---|---|---|---|---|---|---|---|---|
| Model | β-SnWO4 | Model A | Model A | Model B | Model B | Model C | Model C | Model D | Model D | |
| Formula | SnWO4 | La2Mo2O8 | La1.7Bi0.3Mo2O8 | La2Mo2O9 | La1.7Bi0.3Mo2O9 | La2Mo2O8 | La1.7Bi0.3Mo2O8 | La2Mo2O9 | La1.7Bi0.3Mo2O9 | |
| La/Bi (4a) | x | 0.8416(2) | 0.8514(3) | 0.8522(4) | 0.8517(3) | 0.8532(3) | 0.8492(4) | 0.8525(3) | 0.8525(3) | 0.8519(3) |
| Sn (4a) | Occupancy | 1 | 1 | 1 | 1 | 1 | 1 | 1 | 0.889 | 0.889 |
| B eq/Å2a | 0.96(2) | 4.6(3) | 3.8(3) | 5.2(2) | 5.2(2) | 5.9(2) | 5.4(2) | 5.9(2) | 5.0(3) | |
| Mo (4a) | x | 0.1644(1) | 0.1776(5) | 0.1649(7) | 0.1684(6) | 0.1700(4) | 0.1665(5) | 0.1673(5) | 0.1695(5) | 0.1689(5) |
| W (4a) | Occuppancy | 1 | 1 | 1 | 1 | 1 | 1 | 1 | 0.889 | 0.889 |
| B eq/Å2a | 0.69(2) | 4.2(2) | 5.4(3) | 4.4(2) | 2.7(2) | 5.6(2) | 3.9(2) | 4.4(2) | 3.4(3) | |
| O1 (4a) | x | 0.3039(16) | 0.333(2) | 0.3137(7) | 0.3144(6) | 0.3142(6) | 0.3141(5) | 0.3138(6) | 0.3179(6) | 0.3171(5) |
| Occupancy | 1 | 1 | 1 | 1 | 1 | 1 | 1 | 1 | 1 | |
| B eq/Å2a | 1.60(36) | 14.23(2) | 3.5(3) | 6.8(15)b | 6.7(2) b | 9.0(2) | 9.4(2) | 8.4(2) | 8.5(2) | |
| O2 (12b) | x | 0.0470(18) | 0.9855(4) | 0.9802(4) | 0.9864(5) | 0.9828(5) | 0.9797(6) | 0.9796(5) | 0.9908(6) | 0.9916(7) |
| y | 0.1362(19) | 0.1537(9) | 0.149(2) | 0.177(1) | 0.1710(9) | 0.166(2) | 0.168(1) | 0.179(1) | 0.177(2) | |
| z | 0.2271(18) | 0.3287(8) | 0.311(2) | 0.334(1) | 0.3363(9) | 0.329(1) | 0.3328(8) | 0.337(1) | 0.336(1) | |
| Occupancy | 1 | 1 | 1 | 0.87(1) | 0.97(1) | 0.77(1) | 0.85(1) | 0.66(2) | 0.66(9) | |
| B eq/Å2a | 2.02(23) | 10.25(4) | 18.6(2) | 9.2(4) | 10.7(3) | 12.2(4) | 11.6(4) | 6.7(5) | 5.7(4) | |
| O3 (12b) | x | 0.919(2) | 0.920(2) | 0.920(2) | 0.907(1) | 0.912(2) | 0.906(2) | |||
| y | 0.613(3) | 0.604(2) | 0.608(2) | 0.610(1) | 0.648(4) | 0.667(4) | ||||
| z | 0.550(2) | 0.546(2) | 0.549(2) | 0.5482(8) | 0.544(2) | 0.548(1) | ||||
| Occupancy | 0.29(1) | 0.18(1) | 0.23(1) | 0.15(1) | 0.34(2) | 0.34(9) | ||||
| B eq/Å2a | 8.0(5) | 0.0(2) | 4.5(2) | −1.1(3) | 18.4(1) | 26.5(1) | ||||
| R Bragg (%) | 3.4c | 12.6 | 14.2 | 6.1 | 8.94 | 6.4 | 9.21 | 5.7 | 8.01 | |
As shown in reference 14, the crystal structure of β-La2Mo2O9 appears to be very close to that of β-SnWO4,17 with extra oxygen atoms in statistical occupation (see Table 1). Cations occupy the same type of positions in both compounds, as well as most anions (see Fig. 3). Given that divalent tin is a lone pair element the tungstate formula can be rewritten Sn2W2O8E2 (E = lone pair). In this case, trivalent lanthanum with no lone pair replaces divalent tin and its lone pair, which is partially replaced by oxygen, so that the formulation of the lanthanum molybdate becomes La2Mo2O8 + 1□. The created vacancy (□) is indeed a favourable element for the extra oxygen migration, as evidenced by the anionic conductivity of the molybdate. As a structural proof, it can be seen on Fig. 3 that the extra oxygen atom partially occupies, in the molybdate, the site normally occupied by the tin lone pair in the tungstate. Besides, the large anisotropic values of oxygen thermal factors, and the undulation of the neutron diffraction background (see Fig. 4, with a first maximum around Q = 3.1 Å−1 characteristic of a minimal O–O distance around 2.5 Å, according to the Debye formula) are further indications of the oxygen disordering.
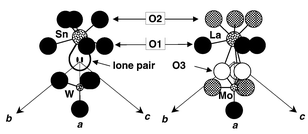 | ||
| Fig. 3 Cationic environments in β-SnWO4 (left) and β-La2Mo2O9 (right). For clarity, the environment of La is limited to the nearest neighbours. Hatched and open circle oxygen sites are partially occupied. | ||
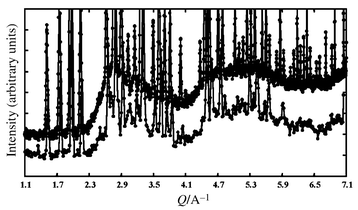 | ||
| Fig. 4 Detail of the neutron diffraction patterns of β-La2Mo2O9 (below) and La1.7Bi0.3Mo2O9 (above) at room temperature versusQ = 4π sin θ/λ, showing a large diffuse peak in the background around 3.1 Å−1 (due to short range order with pair distances around 2.5 Å). Note that the container contribution to the background is negligible (vanadium container). For clarity, the patterns have been shifted with respect to each other. | ||
Concerning the crystal structure of the low temperature form α-La2Mo2O9, we have already mentioned14 that it is a 2 × 3 × 4 superstructure of the cubic form with a slight (probably monoclinic) distortion.
2.2 Conduction path in La2Mo2O9
It is to be noted that 2 of the 3 oxygen sites of β-La2Mo2O9 are partially occupied (O2 and O3), which represent 3/4 of the total number of oxygen atoms, and as many vacancies. Oxygen atoms O2 and O3 are thus most probably the only ones which participate in the conduction path, since oxygen site O1, despite it also having a large thermal factor, appears to remain fully occupied. It can be made even clearer when considering the shortest distances between oxygen sites. Since sites O2 and O3 are together 50% occupied, and site O3 less than 50%, some O2–O3 and O3–O3 distances (see Table 2) are smaller than the commonly admitted smallest O–O distance (about 2.5 Å). When such is the case, it means that one of the two sites is not occupied by an oxygen atom, and that the oxygen atom on the other site is therefore very close to a vacancy. These shortest O2–O3 and O3–O3 distances are thus indicative of the most likely conduction path for oxide ions. Fig. 5a gives a view of such short distances between sites O2 and O3. They form interconnected infinite paths along the 3-fold axes of the cubic structure, whose approximate trace is schematised by cylindrical rods on Fig. 5b, which thus most likely represent the oxide-ion conduction path in La2Mo2O9. This conduction path is three-dimensional in nature, by virtue of the rods interconnection in a cubic symmetry.![Conduction path in
La2Mo2O9: (a) 3D lattice of short O2–□
and O3–□ distances in β-La2Mo2O9
forming infinite paths along the [111] cubic direction (direction
of the projection). Orange = oxygen, blue = lanthanum,
green = molybdenum; (b) 3D lattice of the conduction
paths schematised as infinite cylindrical rods along the cube diagonals (see
section on Fig. 5a).](/image/article/2001/JM/b002962i/b002962i-f5.gif) | ||
| Fig. 5 Conduction path in La2Mo2O9: (a) 3D lattice of short O2–□ and O3–□ distances in β-La2Mo2O9 forming infinite paths along the [111] cubic direction (direction of the projection). Orange = oxygen, blue = lanthanum, green = molybdenum; (b) 3D lattice of the conduction paths schematised as infinite cylindrical rods along the cube diagonals (see section on Fig. 5a). | ||
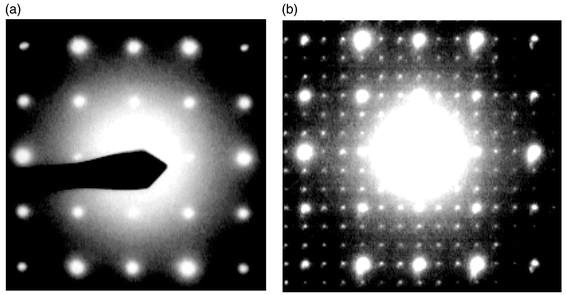 | ||
| Fig. 6 Room temperature electron diffraction patterns of: (a) La1.7Bi0.3Mo2O9 (cubic cell). (b) La2Mo2O8.95F0.1 showing a superstructure relative to the cubic cell. | ||
![[thin space (1/6-em)]](https://www.rsc.org/images/entities/char_2009.gif) °C)a
°C)a
| a Crystallographic parameters: space group P213 (no. 198), Z = 2, a = 7.2342(1) Å, RBragg = 5.7%, Rp = 23.5%, Rwp = 11.3%, Rexp = 8.5%, χ2 = 1.8, number of reflections = 156, number of refined parameters = 35. b O2 and O3 sites are partially occupied. | |
|---|---|
| La polyhedron | |
| La–O2 | 2.496(5) [×3]b |
| La–O3 | 2.71(2) [×3]b |
| La–O1 | 2.696(4) [×3] |
| La–O3 | 2.83(3) [×3]b |
| La–O2 | 2.809(7) [×3]b |
| Mo polyhedron | |
| Mo–O3 | 1.73(4) [×3]b |
| Mo–O2 | 1.77(3) [×3]b |
| Mo–O1 | 1.83(2) [×1] |
| Oxygen–oxygen short distances | |
| O1–O2 | 2.574(7) [×3]b |
| O1–O2 | 2.789(8) [×3]b |
| O1–O3 | 2.79(2) [×3]b |
| O2–O3 | 2.30(2) [×1]b |
| O2–O3 | 2.86(2) [×1]b |
| O2–O3 | 2.68(2) [×1]b |
| O2–O3 | 1.54(3) [×1]b |
| O2–O3 | 2.98(2) [×1]b |
| O3–O3 | 1.74(2) [×2]b |
3 Synthesis and crystallographic characterisation in the LAMOX family
3.1 Synthesis
Various substitutions on both cationic sites of La2Mo2O9 were carried out: (La2 − xMx)Mo2O9 (M = Sr, Ba, K, Bi) and La2(Mo2 − xMx)O9 with (M = Re, S, W, Cr and V) were prepared from appropriate stoichiometric mixtures of starting materials La2O3, MoO3, SrCO3, BaCO3, K2CO3, Bi2O3, ReO3, La2(SO4)3, WO3, La2CrO6 or V2O5. In the case of Sr, Ba, K, Bi, S, W and V the weighted powder was mixed in an agate mortar, and then placed in an alumina crucible. These mixtures were first heated in air at 500![[thin space (1/6-em)]](https://www.rsc.org/images/entities/char_2009.gif) °C for 12 hours, then kept at
700–1100
°C for 12 hours, then kept at
700–1100![[thin space (1/6-em)]](https://www.rsc.org/images/entities/char_2009.gif) °C (depending on the substituted cation, see Table 3) for several hours, and finally
cooled down slowly. Several regrindings and heatings were necessary in order
to obtain a pure compound. In the case of rhenium substitution the mixed powder
was placed in a sealed platinum tube. The tube was first heated slowly at
500
°C (depending on the substituted cation, see Table 3) for several hours, and finally
cooled down slowly. Several regrindings and heatings were necessary in order
to obtain a pure compound. In the case of rhenium substitution the mixed powder
was placed in a sealed platinum tube. The tube was first heated slowly at
500![[thin space (1/6-em)]](https://www.rsc.org/images/entities/char_2009.gif) °C for a few hours, then the temperature was slowly increased
to 900
°C for a few hours, then the temperature was slowly increased
to 900![[thin space (1/6-em)]](https://www.rsc.org/images/entities/char_2009.gif) °C and kept at this temperature for 12 hours. In
the case of chromium substitution the weighted powder was placed in an alumina
crucible and heated under a flow of pure oxygen firstly at 500
°C and kept at this temperature for 12 hours. In
the case of chromium substitution the weighted powder was placed in an alumina
crucible and heated under a flow of pure oxygen firstly at 500![[thin space (1/6-em)]](https://www.rsc.org/images/entities/char_2009.gif) °C
and then at 700
°C
and then at 700![[thin space (1/6-em)]](https://www.rsc.org/images/entities/char_2009.gif) °C for a few hours.
°C for a few hours.
| Compounds | Temperature /°C | a/Å |
|---|---|---|
| α-La2Mo2O9 | 850–900 | ≈7.149 |
| K(5%) | 960 | 7.1718 |
| Ba(10%) | 970 | 7.1878 |
| Sr(5%) | 1050 | 7.1680 |
| Cr(50%) | 700 | 7.1315 |
| W(15%) | 1000 | 7.1524 |
| W(50%) | 1100 | 7.1535 |
| W(75%) | 1100 | 7.1526 |
| W(80%) | 1100 | 7.1402 |
| Bi(5%) | 850 | 7.1643 |
| Bi(10%) | 850 | 7.1757 |
| Bi(15%) | 850 | 7.1862 |
| S(20%) | 800 | 7.0784 |
| S(50%) | 800 | 7.1460 |
| V(2.5%) | 900 | 7.1500 |
| V(7.5%) | 900 | 7.1480 |
| Re(5%) | 900 | 7.1567 |
Partial substitution of oxygen by fluorine was successfully attempted: La2Mo2O8.95F0.1 was prepared from an appropriate stoichiometric mixture of starting materials La2O3, LaOF and MoO3. The synthesis conditions were identical to those of the rhenium substituted compound.
3.2 Crystal structure of La1.7Bi0.3Mo2O9
Partial substitution of lanthanum by bismuth in La2Mo2O9 leads to a stabilisation at room temperature of the cubic form, as evidenced by electron diffraction (see Fig. 6). The results of the structure refinement from the room temperature neutron diffraction pattern (D2B) of La1.7Bi0.3Mo2O9 is given in Table 1 (see also Fig. 2b). The agreement between the calculated and observed patterns is not as good as those of the high temperature form of La2Mo2O9. For instance, the equivalent isotropic thermal factors for O3 in models B, C and D seem unrealistic. This is probably related to the (re)introduction of a lone pair among O3 oxygen atoms (see Fig. 3). Attempts to find another oxygen position from Fourier difference analysis in model A were in vain. It seems that the strict localisation of the extra oxygen is a real challenge (such a difficulty to locate conducting ions is rather common in ionic conductors due to their strong delocalisation).18,19 One can note the same undulation in the backgrounds of the neutron diffraction patterns of La1.7Bi0.3Mo2O9 and α-La2Mo2O9 at room temperature (see Fig. 4).3.3 Cell parameter evolution upon substitution
Several other substitutions on the cationic sites of La2Mo2O9 have been tested, all of them leading to a stabilisation of the cubic form at room temperature. The cell parameter evolutions with the percentage and the nature of the substitution are summarised in Fig. 7 and Table 3. The parameter evolution can be simply analysed by considering the cationic sizes20 (for instance with 9-fold and tetrahedral coordination for La and Mo substitutes, respectively). Substitutions on the lanthanum site (La2 − xAx)Mo2O9 (A = Sr, K, Bi) give coherent results in view of the ionic radii r(SrII)9 = 1.31 Å, r(KI)9 = 1.55 Å and r(LaIII)9 = 1.216 Å. The size of BiIII is comparable to that of LaIII, but we should take into account the presence of the lone pair, which can explain the large increase of cell parameter upon doping. Substitutions on the molybdenum site La2(Mo2 − xBx)O9 with B = S, W, Cr and V give a cell parameter evolution which also reflects the ionic radii: r(SVI)4 = 0.12 Å, r(WVI)4 = 0.42 Å, r(CrVI)4 = 0.26 Å, r(VV)4 = 0.355 Å, and r(MoVI)4 = 0.41 Å. The substitutions with sulfur and chromium could be performed up to at least fifty percent, and in the case of tungsten up to eighty percent.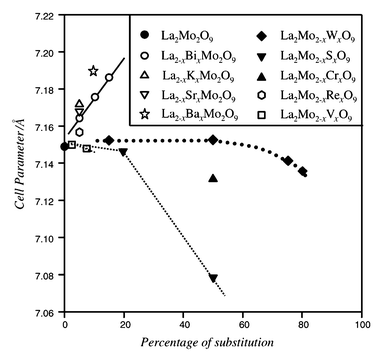 | ||
| Fig. 7 Evolution upon substitution rate of the cell parameters of different members of the LAMOX family. For α-La2Mo2O9 the cell parameters have been averaged to pseudo cubic. Lines are guides for the eye. | ||
Substitution by fluorine on the oxygen lattice leads to another type of superstructure, different from that of α-La2Mo2O9 with a tripling of cubic cell parameters and a slight distortion (see Fig. 6).
4 Oxide-ion conduction in the LAMOX family
For conductivity measurements, gold or platinum electrodes were vacuum deposited on both flat surfaces of rod shaped samples (about 5 mm in diameter and 6 mm in length). These rods were prepared from appropriate powder samples. Approximately three drops of a solution of polyvinyl alcohol were mixed with 1 g of as-synthesized powder in an agate mortar. This mixture was placed in a furnace for a few hours at 200![[thin space (1/6-em)]](https://www.rsc.org/images/entities/char_2009.gif) °C,
and then pressed in a die under about 1–2 tons. These rod shaped
samples were first heated slowly in air at 400
°C,
and then pressed in a die under about 1–2 tons. These rod shaped
samples were first heated slowly in air at 400![[thin space (1/6-em)]](https://www.rsc.org/images/entities/char_2009.gif) °C for a few hours,
then kept at 700–1100
°C for a few hours,
then kept at 700–1100![[thin space (1/6-em)]](https://www.rsc.org/images/entities/char_2009.gif) °C (depending on the substitution)
for several hours, and finally cooled down slowly. The ratios of the measured
density (deduced from the weight and geometric parameters of the samples)
to the theoretical density ranged from 70 to 80%
°C (depending on the substitution)
for several hours, and finally cooled down slowly. The ratios of the measured
density (deduced from the weight and geometric parameters of the samples)
to the theoretical density ranged from 70 to 80%
The conductivity was determined by impedance spectroscopy in the 0.1 Hz–32 MHz
range using a Schlumberger Solartron SI1260 frequency response analyser. Each
set of data was recorded under dry air flow at the given temperature after
1 h stabilisation. The conductivity of substituted compounds given
at 500 and 800![[thin space (1/6-em)]](https://www.rsc.org/images/entities/char_2009.gif) °C (Table 4),
were obtained from a linear regression of conductivity measured during heating
and cooling of the sample.
°C (Table 4),
were obtained from a linear regression of conductivity measured during heating
and cooling of the sample.
| Compounds |
σ/S cm−1
(T = 500![[thin space (1/6-em)]](https://www.rsc.org/images/entities/char_2009.gif) °C) °C) |
σ/S cm−1
(T = 800![[thin space (1/6-em)]](https://www.rsc.org/images/entities/char_2009.gif) °C) °C) |
|---|---|---|
| α-La2Mo2O9 | 4.6 × 10⁻⁵ | — |
| β-La2Mo2O9 | — | 8.02 × 10⁻² |
| K (5%) | 1.40 × 10⁻⁵ | 5.65 × 10⁻³ |
| Ba (10%) | 8.56 × 10⁻⁶ | 2.74 × 10⁻³ |
| Sr (5%) | 1.20 × 10⁻⁵ | 6.03 × 10⁻³ |
| Cr (50%) | 5.42 × 10⁻⁴ | 9.98 × 10⁻³ |
| W (15%) | 1.77 × 10⁻⁴ | 6.04 × 10⁻² |
| W (50%) | 9.33 × 10⁻⁶ | 4.21 × 10⁻³ |
| Bi (5%) | 2.05 × 10⁻⁴ | 6.96 × 10⁻² |
| Bi (15%) | 1.33 × 10⁻⁴ | 2.22 × 10⁻² |
| S (20%) | 1.01 × 10⁻⁴ | 4.81 × 10⁻² |
| V (2.5%) | 3.00 × 10⁻⁵ | 5.20 × 10⁻² |
As previously reported,13,14 La2Mo2O9
is a good oxide-ion conductor, as can be seen on Fig. 1
which presents an Arrhenius plot of its conductivity as deduced from impedance
measurements. The phase transition around 580![[thin space (1/6-em)]](https://www.rsc.org/images/entities/char_2009.gif) °C is accompanied,
upon heating, by an abrupt increase of the conductivity by almost two orders
of magnitude. In all cases of substitution (Sr, Ba, K, Bi, S, W, Cr and
V) no phase transition was observed from conductivity measurements (see Fig. 1).
°C is accompanied,
upon heating, by an abrupt increase of the conductivity by almost two orders
of magnitude. In all cases of substitution (Sr, Ba, K, Bi, S, W, Cr and
V) no phase transition was observed from conductivity measurements (see Fig. 1).
In most cases the conductivity of the substituted compounds is of the same
order as that of La2Mo2O9. For Bi (5%),
W (15%) and V (2.5%) substitutions, the
conductivity at 800![[thin space (1/6-em)]](https://www.rsc.org/images/entities/char_2009.gif) °C is very close to that of β-La2Mo2O9
(see Table 4). In the case of bismuth doping,
the large cell parameter increase does not improve anionic conduction probably
due to the introduction of the bismuth lone-pair in the conduction path,
which tends to block conduction rather than to open the lattice. For Ba (10%),
K (5%) and Sr (5%) substitutions, the conductivity
at 800
°C is very close to that of β-La2Mo2O9
(see Table 4). In the case of bismuth doping,
the large cell parameter increase does not improve anionic conduction probably
due to the introduction of the bismuth lone-pair in the conduction path,
which tends to block conduction rather than to open the lattice. For Ba (10%),
K (5%) and Sr (5%) substitutions, the conductivity
at 800![[thin space (1/6-em)]](https://www.rsc.org/images/entities/char_2009.gif) °C is almost one order of magnitude lower than that β-La2Mo2O9
(see Table 4). The comparison of the conductivity
of the substituted compounds and α-La2Mo2O9
at 500
°C is almost one order of magnitude lower than that β-La2Mo2O9
(see Table 4). The comparison of the conductivity
of the substituted compounds and α-La2Mo2O9
at 500![[thin space (1/6-em)]](https://www.rsc.org/images/entities/char_2009.gif) °C presents an interesting feature in the case of Cr (50%):
the chromium substitution is the only case where the conductivity below the
transition is one order of magnitude higher than that of α-La2Mo2O9
in the whole temperature range (see Fig. 1).
°C presents an interesting feature in the case of Cr (50%):
the chromium substitution is the only case where the conductivity below the
transition is one order of magnitude higher than that of α-La2Mo2O9
in the whole temperature range (see Fig. 1).
5 Conclusion
We have presented in this paper a new family of fast oxide-ion conductors called LAMOX and based on parent compound La2Mo2O9. Several members of this family, obtained by partial substitution on the different ionic sites, have been studied through X-ray and neutron diffraction, and conductivity measurements. The structural characterisation from powder samples suffers from the low number of uncorrelated diffraction peaks. A more accurate localisation of oxygen atoms, together with a better characterisation of physical properties would necessitate single crystals, whose growth attempts are currently under consideration. The partial substitution of oxygen by fluorine gives another promising research field, since fluorine doping is a way to modulate the rate of vacancies on the anionic sublattice. These different fields are currently under study and will be thoroughly explored in the near future. On a more general point of view, the substitution of a lone pair element could lead to a fruitful concept for the elaboration of other families of oxide-ion conductors, and open new fields of research. It will be fully developed in a subsequent paper.21References
- B. C. H. Steele, Oxygen ion conductors in High Conductivity Solid Ionic Conductors, Recent Trends and Applications, ed. T. Takahashi, World Scientific Publishing Co., Singapore, 1989, pp. 402–446. Search PubMed.
- J. C. Boivin and G. Mairesse, Chem. Mater., 1998, 10, 2870 CrossRef CAS.
- E. C. Subbarao, Zirconia—an overview in Advances in Ceramics, eds. A. H. Heuer and L. W. Hobbs, vol. 3, Science and Technology of Zirconia I, American Ceramic Society, Columbus, OH, 1981, pp. 1–24. Search PubMed.
- T. Takahashi and H. Iwara, J. Appl. Electrochem., 1973, 3, 65.
- H. A. Harwig and A. G. Gerards, J. Solid State Chem., 1978, 26, 265 CrossRef CAS.
- K. R. Kendall, C. Navas, J. K. Thomas and H.-C. zur Loye, Solid State Ionics, 1995, 82, 215 Search PubMed.
- T. Ishihara, H. Matsuda and Y. Takita, J. Am. Chem. Soc., 1994, 116, 3801 CrossRef CAS.
- M. Feng and J. B. Goodenough, Eur. J. Solid State Inorg. Chem., 1994, 31, 663 CAS.
- F. Abraham, M. F. Debreuille-Gresse, G. Mairesse and G. Nowogrocki, Solid State Ionics, 1988, 28–30, 529 Search PubMed.
- F. Abraham, J. C. Boivin, G. Mairesse and G. Nowogrocki, Solid State Ionics, 1990, 40–41, 934 Search PubMed.
- H. L. Tuller, Solid State Ionics, 1997, 94, 63 Search PubMed.
- S. A. Kramer and H. L. Tuller, Solid State Ionics, 1995, 82, 15 Search PubMed.
- Ph. Lacorre, F. Goutenoire, O. Bohnke, R. Retoux and Y. Laligant, Nature, 2000, 404, 856 CrossRef CAS.
- F. Goutenoire, O. Isnard, R. Retoux and Ph. Lacorre, Chem. Mater., in press. Search PubMed.
- J. Rodriguez-Carvajal, Fullprof, version 3.5d, 1998. Search PubMed.
- ShelxS86, G. M. Sheldrick, in Crystallographic Computing 3, eds. G. M. Sheldrick, C. Krüger and R. Goddards, Oxford University Press, Oxford, 1985 Search PubMed; G. M. Sheldrick, ShelxL93, A Program for Refinement of Crystal from Diffraction Data, University of Göttingen, 1993. Search PubMed.
- W. Jeitschko and A. W. Sleight, Acta Crystallogr., Sect. B, 1972, 28, 3174 CrossRef CAS.
- M. J. Cooper and M. Sakata, Acta Crystallogr., Sect. A, 1979, 35, 989 CrossRef CAS.
- C. Muller, M. Anne, M. Bacman and M. Bonnet, J. Solid State Chem., 1998, 141, 241 CrossRef CAS.
- R. D. Shannon, Acta Crystallogr., Sect. A, 1976, 32, 751.
- Ph. Lacorre, in preparation..
Footnote |
| † Basis of a presentation given at Materials Discussion No. 3, 26–29 September, 2000, University of Cambridge, UK. |
| This journal is © The Royal Society of Chemistry 2001 |
